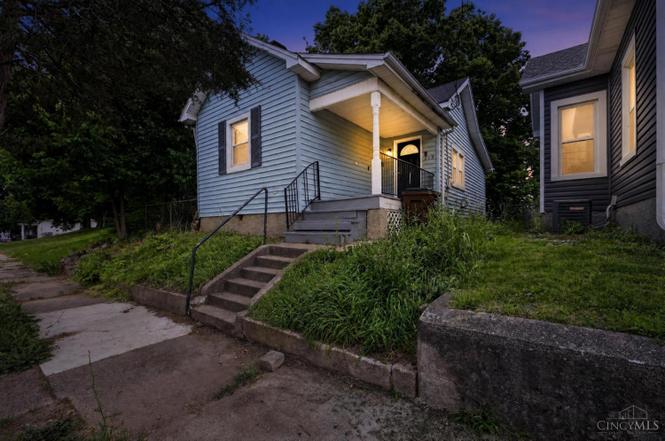
313 Leibee St · Middletown, OH
Flood risk 1/10 · Minimal
- FEMA flood zone
- X (unshaded)
- Chance of flooding over 30 yrs
- 0.0%
- Est. flood insurance / yr
- $473 – $860
Fire risk 1/10 · Minimal
- Est. fire insurance / yr
- $713 – $1,323
Heat risk 4/10 · Minor
- Hot days now (above 103°F)
- 7 days/yr
- Hot days in 30 yrs
- 19 days/yr
Wind risk 2/10 · Minimal
- Chance of severe wind over 30 yrs
- 1.0%
Air-quality risk 3/10 · Minor
- Unhealthy air days now
- 2 days/yr
- Unhealthy air days in 30 yrs
- 3 days/yr
Risk factors via First Street. Map © Google.
Why this score? — see what drove the C- grade
The composite is a weighted blend of 9 inputs, each scored 0–100. Each bar is that input's sub-score; the figure is the points it added to the 100-point composite (weight × sub-score).
- Cash flow +20.7/30.0
- ARV discount +12.5/15.0
- DSCR +6.6/10.0
- 1% rule +4.5/10.0
- Livability +3.6/5.0
- Rent growth +2.5/5.0
- Condition / age +2.5/5.0
- Schools +2.0/10.0
- Appreciation +0.0/10.0
$104,900
🖨 Deal sheet 📄 Offer letter ✓ Due diligence
Listing remarks
Charming and well-maintained home in a convenient Middletown location! This 3-bedroom, 1-bath residence offers a bright and inviting living space, a spacious kitchen, and an open dining area perfect for gatherings. Enjoy the comfort of a large backyard, ideal for outdoor entertaining or relaxing weekends. Updates throughout include [insert any notable updates: flooring, roof, HVAC, etc. ], providing move-in readiness and peace of mind. Situated close to schools, parks, shopping, and major highways, this home combines small-town charm with easy access to everyday conveniences. Don't miss the opportunity to make this delightful property your own!
Key facts
- Close to parks
- Close to schools
- Open dining area
Tags
Property features AI
Finance
- Other: Zoned residential; Located in Middletown North suburb; directions available
- Financial info: Lease not considered
- HOA & community: No HOA
Exterior
- Parking: Off-street parking
- Security: Smoke alarm
- Utilities: Public water; Public sewer; Natural gas
- Home design: Craftsman/Bungalow style single-family home; One story
- Construction: Vinyl siding; Shingle roof; Block foundation; Built with 220 volt service
- Exterior features: Front porch; Storm windows
Interior
- Kitchen: Oven/Range; Refrigerator; Kitchen with vinyl floor and wood cabinets
- Bedrooms: Three bedrooms total; Primary bedroom about 15 x 12 (on main level); Second bedroom about 13 x 11 (on main level); Third bedroom about 10 x 11 (on main level)
- Flooring: Vinyl flooring in kitchen
- Bathrooms: One full bathroom on main level with shower and tub; One half bathroom
- Heating & cooling: Forced air heating (gas); Gas water heater; Window air conditioning unit
- Interior features: Partial basement; Window treatments; Wood cabinets; Vinyl flooring in kitchen; Smoke alarm; 220 volt
- Laundry & utility: No dedicated laundry info provided
Neighborhood map
What this means for you Summary
Snapshot
- This is a 2-bed/1.0-bath single-family listed at $105k.
Deal economics
- At list price, monthly cash flow is $143 ($2k/yr) — positive.
- The deal already cash-flows at list — no discount required.
- To meet the 1% rule (rent ≥ 1% of price), the offer needs to be $100k (4.7% below list).
- Recommended offer: $100k (4.7% below list) — sets the bar for 1% rule.
- Cap rate 7.9% vs local median 4.5% in Middletown — top-decile yield for the area; either an underpriced asset or a hidden risk that comps aren't pricing in. Stress-test before assuming the spread holds.
Location & tenants
- Location reads 72/100 on livability (#389 in OH) — a middle-class / working-renter tenant base. Strengths: cost of living A+, housing A+, health & safety A+; Watch: schools D+, crime D+, amenities D+.
- Middletown City (suburban): math 21% / reading 28% proficiency, ranked #610 of 656 in OH (top 93%) — low school quality limits family demand, transient renter base, plan for 1-2y turnover; 69% free/reduced lunch — lower-income household profile, screen leases tightly.
- Market conditions: 71 active listings in the ZIP; 4 comparable units currently listed for rent nearby; rentals at typical pace (median 15d on market — plan ~3-4 weeks tenant-placement turnaround); 1,163 units permitted in Butler County in 2024 (356 in 5+ unit buildings).
- This rent is only 17% of the median local income ($70k/yr) — well below the 30% rent-burden line; pricing power to push rent on renewal without tenant pushback.
Forward outlook
- Local home prices are declining (-3.0%/yr); year-one equity from $725 of loan paydown is wiped out by about $3k of value loss. Plan a longer hold.
Negotiation context
- Only 3 days on market — expect competitive offers; lowballing is unlikely to land.
- 4 sale attempts since 28y ago with the ask held roughly flat each time — persistent listings suggest the price (not the market) is what's stuck; bring a comps-based counter.
Risks & watch-outs
- Watch-outs: built in 1919 — expect roof / HVAC / electrical / plumbing capex.
Questions for the listing agent
- Built in 1919 — when were the roof, HVAC, electrical panel, plumbing, and water heater last replaced?
- Is there a deadline driving the sale (1031 exchange, divorce, estate, relocation)? That informs how much negotiation room exists.
- Schools are D-rated, which usually means shorter tenancies and higher turnover. Who's the typical renter profile here, and what's been the actual vacancy rate?
- Crime grade is D in this area — have there been break-ins, vandalism, or insurance claims at this property in the last 3 years? What carrier currently insures it and at what premium?
- What's the average days-on-market for RENTAL listings here right now (not sales)? A rising rental-DOM trend means longer vacancies and softer asking-rent achievability than the comps imply.
- What's the recent tenant-quality profile in this submarket — average credit score on applications, eviction rate, late-payment / NSF rate, and stable-employment percentage? A property-management company in the area should have these aggregated.
- How much new for-sale + rental construction is in the pipeline within 1–3 miles? Heavy new supply typically softens prices + rents 12–24 months out; constrained supply supports both.
Investment metrics
- 1% rule
- 0.95% ✗
- Cap rate
- 7.93%
- Cash-on-cash
- 5.84%
- DSCR
- 1.26
- GRM
- 8.7
CMA / ARV
- ARV (on-the-fly)
- $117,936
- Comps found
- 12
Show comp detail 12 sales within ~0.75 mi
| Address | Dist | Beds/Ba | Sqft | Sold | Price | $/sf | Match |
|---|---|---|---|---|---|---|---|
| 206 N Sutphin St | 0.31mi | 2/1.0 | 753 (+3%) | 6mo | $86,000 | $114 | 75 |
| 708 Auburn St | 0.46mi | 2/1.0 | 750 (+3%) | 2mo | $150,000 | $200 | 72 |
| 1014 Elwood Ave | 0.53mi | 2/1.0 | 720 (-1%) | 16mo | $75,000 | $104 | 60 |
| 2100 Crescent Blvd | 0.47mi | 2/1.0 | 804 (+10%) | 6mo | $108,000 | $134 | 56 |
| 2111 Crescent Blvd | 0.50mi | 2/1.0 | 688 (-6%) | 15mo | $97,500 | $142 | 55 |
| 818 Auburn St | 0.49mi | 2/1.0 | 672 (-8%) | 12mo | $118,000 | $176 | 54 |
| 1904 Clayton Ave | 0.31mi | 2/1.0 | 816 (+12%) | 14mo | $145,000 | $178 | 54 |
| 709 Elsmere St | 0.43mi | 2/1.0 | 820 (+13%) | 9mo | $133,000 | $162 | 51 |
| 2010 Sherman Ave | 0.72mi | 2/1.0 | 684 (-6%) | 9mo | $135,000 | $197 | 49 |
| 905 Auburn St | 0.54mi | 2/1.0 | 832 (+14%) | 9mo | $75,569 | $91 | 44 |
| 319 Moore St | 0.61mi | 2/1.0 | 834 (+15%) | 6mo | $141,000 | $169 | 43 |
| 1006 Catalpa Dr | 0.63mi | 2/1.0 | 792 (+9%) | 16mo | $114,000 | $144 | 43 |
Match score weights: distance 35% · size 25% · config 20% · recency 20%. Top-matched comps best support the ARV.
Projected returns pro-forma
-3.0% appreciation · 3.0% rent growth · sell at horizon
- IRR
- -7.3%
- Equity multiple
- 0.73×
- Total profit
- $-7,933
- Equity at exit
- $15,641
- IRR
- 2.2%
- Equity multiple
- 1.16×
- Total profit
- $4,675
- Equity at exit
- $9,070
Cash invested: $29,372 (down + closing). Projections, not guarantees.
Landlord ↔ Tenant lean methodology
- Overall (STATE)
- 73 Landlord-Friendly
- State Ohio
- 73 Landlord-Friendly · R+6
- County
- — inherits STATE
- City
- — inherits STATE
ZIP-level market 45042
- Active inventory
- 71
- Price-to-rent
- 8.7×
Monthly cashflow live
- Estimated rent
- $1,000 medium interval (Pro) →
- Mortgage (P&I)
- −$550
- Tax from tax record
- −$53 /mo · $642/yr
- Insurance
- −$44
- HOA
- −$0
- Vacancy / Maint / Mgmt
- −$210
- Net cashflow
- $143
Break-even live
UW: 25.0% down · 7.5% · 30yr · 1.5% tax · 5.0% vac · 8.0% maint · 8.0% mgmt
Financing live
Cash to close
- Down payment
- $26,225
- Closing costs
- $3,147
- Reserves months
- —
- Total cash needed
- —
Loan-product check · same deal, 3 products live
Conventional
25% down · 7.5% · 30yr
- Down + closing
- —
- Monthly P&I
- —
- Monthly cashflow
- —
- DSCR
- —
- Eligible?
- —
Personal DTI + credit; lowest rate.
DSCR
20% down · 8.5% · 30yr
- Down + closing
- —
- Monthly P&I
- —
- Monthly cashflow
- —
- DSCR
- —
- Eligible?
- —
No personal income docs; deal must DSCR.
Hard money
10% down · 12.0% · 12mo
- Down + closing
- —
- Monthly P&I
- —
- Monthly cashflow
- —
- DSCR
- —
- Eligible?
- —
Short-term bridge; refi at stabilization.
Rent comps 4 comps
| Address | Beds | Baths | Sqft | Rent | $/sqft | DOM | Units | Dist |
|---|---|---|---|---|---|---|---|---|
| 5 N Sutphin St Middletown, OH | 2.0 | 1.0 | 715 | $925 | $1.29 | 4d | 1 | 0.43mi |
| 3 N Sutphin St Middletown, OH | 2.0 | 1.0 | 715 | $925 | $1.29 | 4d | 1 | 0.43mi |
| 1002 Auburn St Unit 2 Middletown, OH | 2.0 | 1.0 | 600 | $895 | $1.49 | 23d | 1 | 0.53mi |
| 3018 Tytus Ave Middletown, OH | 2.0 | 1.0 | 726 | $895 | $1.23 | 15d | 1 | 1.42mi |
Listing history 4 events
-
2026-06-18days on market $104,900 Active 3 DOM
-
2026-06-17days on market $104,900 Active 2 DOM
-
2026-06-16remarks 652-char remark
-
2026-06-16$104,900 Active 1 DOM
ⓘ Source: listings_history table (triggers on properties + properties_extension) + one-shot
backfill from property_details.listing_events for pre-trigger history.
Tax reassessment forecast OH · Partial reset (capped growth)
- Current annual tax
- $642 · $53/mo
- Projected year-2 tax
- $1,139 · $95/mo
- Expected delta
- +$497/yr (+$41/mo · 77.5%)
ⓘ Screening estimate from a state-policy table — verify with the county assessor before closing.
Climate risk First Street
- Flood 1/10 Low FEMA zone X (unshaded) · 0% chance over 30 yrs
- Wildfire 1/10 Low
- Heat 4/10 Moderate 7 d/yr ≥103°F today · 19 d/yr by 30 yrs out
- Wind 2/10 Low 100% chance of damaging wind over 30 yrs
- Air quality 3/10 Moderate 2 unhealthy d/yr today · 3 by 30 yrs out
Nearby sold comps map
Loading sold comps map…
Walkable amenities ~0.75 mi
Loading nearby amenities…
Taxation est. · year 1
- Rental income
- $12,002
- − Mortgage interest
- −$5,876
- − Property taxes
- −$642
- − Insurance
- −$524
- − Repairs & maintenance
- −$960
- − Management
- −$960
- − Depreciation
- −$3,052
- Taxable loss
- −$12
- Est. tax savings @ 24.0%
- +$3
- After-tax cash flow
- $1,717/yr
For passive investors: Depreciation is non-cash, so a rental often shows a tax loss while cash-flowing — sheltering income. Rental losses are passive: they offset passive income freely, and up to $25,000/yr can offset ordinary (W-2) income if you actively participate and your MAGI is under $100k (phasing out to $0 by $150k); unused losses carry forward. On sale, claimed depreciation is recaptured at up to 25%, and gains may owe capital-gains tax (a 1031 exchange can defer both). Figures are a year-1 estimate at your 24.0% rate — not tax advice; consult a CPA.
Schools (NCES district)
- District
- Middletown City
- NCES district ID
- 3904440
- Math proficiency
- 21% ▼ -17.00%
- Reading proficiency
- 28% ▼ -15.00%
- Median HH income
- $36,650
- Composite
- 20.35/100
- National rank
- #8605
- State rank
- #610 of 656 in OH
Livability — Middletown
- Score
- 72/100
- State rank
- #389
- US rank
- #6338
Category grades
Schools grade is shown separately in the Schools card above.
Census & demographics
- Census place
- Middletown, OH
- County
- Butler County · 381,674 people
- City population
- 96,117
- Metro
- Cincinnati, OH-KY-IN
- Population (ZIP)
- 27,652
- Household income
- $69,520
- Rent vs Own
- Severe rent burden
- 751.0
Population outlook (Butler County) Hauer SSP2
- Today (2025)
- 387,706 people
- By 2030
- 392,028 · +1.1%
- By 2040
- 395,307 · +2.0%
- By 2050
- 391,116 · +0.9%
- By 2075
- 378,642 · -2.3%
- By 2100
- 343,248 · -11.5%
Race, ethnicity, and origin ACS 2023
- Neighborhood character
- Predominantly White (88%)
- Race & ethnicity
- White 88% Two or more races 5% Black 4% Hispanic / Latino 3%
- Common ancestry
- Slovak 2% Lithuanian 2% Italian 1%
- Foreign-born
- 2% · Canada, Jamaica, China
- Languages at home
- 96% English-only · Spanish 2%
Political lean MEDSL · Butler
- 2024 margin
- Strong R (+26.3) · D 36.4% · R 62.7%
- 2008→2024 swing
- -3.6pp toward R · 2008: -22.6pp · 2024: -26.3pp
- All cycles
- 2024: R+26.3 2020: R+24.0 2016: R+28.3 2012: R+26.2 2008: R+22.6
Not yet ingested
- Civics
- —
Market trends
- HPI YoY
- ▼ -169.01%
- Current HPI
- 217.3827
- Rent YoY
- —
- Metro
- Cincinnati, OH-KY-IN
- State GDP YoY
- ▲ 1.98%
- F500 in state
- 48
Industry mix (Fortune 500 HQ in OH)
| Industry | F500 HQs | Revenue |
|---|---|---|
| Insurance | 3 | $145B |
|
||
| Industrial Machinery | 3 | $49B |
|
||
| Financial Services | 3 | $24B |
|
||
| Consumer Goods | 2 | $93B |
|
||
| Aerospace / Defense | 2 | $47B |
|
||
| Utilities | 2 | $33B |
|
||
Price history
+424.5% since first listed14 events — show timeline
- 2026-06-12 Listed $104,900 Cincy MLS
- 2024-11-13 Sold (Public Records) $271,000 Public Records
- 2017-11-13 Sold (Public Records) $325,000 Public Records
- 2016-08-11 Sold (Public Records) $7,600 Public Records
- 2005-07-15 Listing Removed — Cincy MLS
- 2005-01-15 Listed $57,900 Cincy MLS
- 2002-12-01 Listing Removed — Cincy MLS
- 2001-06-11 Listed $62,900 Cincy MLS
- 1998-08-04 Sold (Public Records) $57,000 Public Records
- 1998-07-30 Sold (MLS) $49,900 Cincy MLS
- 1998-06-16 Listed $57,000 Cincy MLS
- 1993-06-16 Sold (Public Records) $44,000 Public Records
- 1992-11-10 Sold (Public Records) $30,000 Public Records
- 1991-05-02 Sold (Public Records) $20,000 Public Records
Property tax history
-19.3%/yrLatest (2025): $642 · +1.2% YoY. Source: county tax records.
Cash-flow waterfall
monthlySold comps — $/sqft
last 12 mo · ≤1 miLoading sold comps…