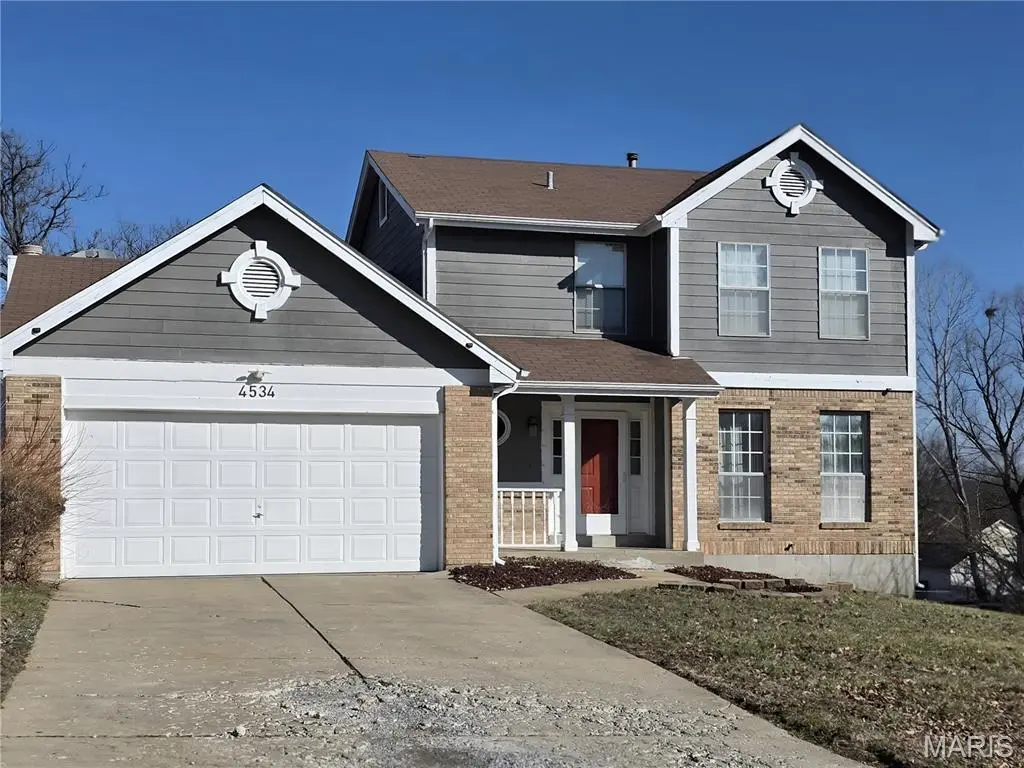
4534 Cambrook Dr · St. Peters, MO
Flood risk 1/10 · Minimal
- FEMA flood zone
- X (unshaded)
- Chance of flooding over 30 yrs
- 0.0%
- Est. flood insurance / yr
- $473 – $860
Fire risk 1/10 · Minimal
- Est. fire insurance / yr
- $1,054 – $1,958
Heat risk 5/10 · Moderate
- Hot days now (above 107°F)
- 7 days/yr
- Hot days in 30 yrs
- 20 days/yr
Wind risk 2/10 · Minimal
- Chance of severe wind over 30 yrs
- 1.0%
Air-quality risk 2/10 · Minimal
- Unhealthy air days now
- 2 days/yr
- Unhealthy air days in 30 yrs
- 2 days/yr
Risk factors via First Street. Map © Google.
Why this score? — see what drove the B- grade
The composite is a weighted blend of 9 inputs, each scored 0–100. Each bar is that input's sub-score; the figure is the points it added to the 100-point composite (weight × sub-score).
- Cash flow +25.0/30.0
- ARV discount +15.0/15.0
- DSCR +8.2/10.0
- 1% rule +6.5/10.0
- Schools +5.2/10.0
- Rent growth +3.1/5.0
- Livability +2.5/5.0
- Condition / age +2.5/5.0
- Appreciation +0.0/10.0
$214,950
🖨 Deal sheet 📄 Offer letter ✓ Due diligence
Listing remarks MLS
Spacious 2 story home with 3 bedrooms, 2.5 baths and a partially finished basement. A blank canvas for you to make your own. Special features include: fireplace, open concept kitchen and living room with fireplace. Lower level has family room, office and more with this partially finished walk out to large backyard. Easy to show, set your appointment today! Some photos are virtually staged
Key facts
- Open concept kitchen
- Large backyard
- Fireplace
Tags
Neighborhood map
What this means for you Summary
Snapshot
- This is a 3-bed/2.5-bath single-family listed at $215k.
Deal economics
- At list price, monthly cash flow is $468 ($6k/yr) — positive.
- The deal already cash-flows at list — no discount required.
- Meets the 1% rule at list price ($2k rent vs $215k).
- Cap rate 8.9% vs local median 4.2% in St. Peters — top-decile yield for the area; either an underpriced asset or a hidden risk that comps aren't pricing in. Stress-test before assuming the spread holds.
Location & tenants
- Location reads: area grade B — affects rentability + tenant quality, not the cash-flow math above.
- Francis Howell R-III (suburban): math 53% / reading 63% proficiency, ranked #11 of 324 in MO (top 3%) — acceptable for families but not a draw, mixed tenant base, ~2y average lease; only 15% free/reduced lunch — higher-income household profile.
- Market conditions: Rents rising (+2.5%/yr); 278 active listings in the ZIP; 5 comparable units currently listed for rent nearby; rentals at typical pace (median 18d on market — plan ~3-4 weeks tenant-placement turnaround); 40% of comp listings sitting > 30 days — soft ceiling on asking rent; high-income renter base; 2,021 units permitted in St. Charles County in 2024 (568 in 5+ unit buildings).
Forward outlook
- Local home prices are declining (-3.0%/yr); year-one equity from $1k of loan paydown is wiped out by about $6k of value loss. Plan a longer hold.
- St. Charles County population projected at +22% by 2050 — long-run rental-demand tailwind backs the buy-and-hold thesis.
Negotiation context
- Only 13 days on market — expect competitive offers; lowballing is unlikely to land.
- Current owner paid $105k; list at $215k implies a 105% gain — meaningful room to come down on a strong offer.
Risks & watch-outs
- Climate carrying-cost: extreme-heat days projected 7→20/yr by 2055 (HVAC capex compounding) — expect insurance premiums to compound above CPI over the hold.
Questions for the listing agent
- Is there a deadline driving the sale (1031 exchange, divorce, estate, relocation)? That informs how much negotiation room exists.
- What's the average days-on-market for RENTAL listings here right now (not sales)? A rising rental-DOM trend means longer vacancies and softer asking-rent achievability than the comps imply.
- What's the recent tenant-quality profile in this submarket — average credit score on applications, eviction rate, late-payment / NSF rate, and stable-employment percentage? A property-management company in the area should have these aggregated.
- How much new for-sale + rental construction is in the pipeline within 1–3 miles? Heavy new supply typically softens prices + rents 12–24 months out; constrained supply supports both.
Investment metrics
- 1% rule
- 1.15% ✓
- Cap rate
- 8.91%
- Cash-on-cash
- 9.34%
- DSCR
- 1.42
- GRM
- 7.2
CMA / ARV
- ARV (median comp)
- $345,237
- List price
- $214,950
- Delta
- -37.74%
- Verdict
- UNDERPRICED
- Comps
- 20 within 1.0 mi
Show comp detail 12 sales within ~0.75 mi
| Address | Dist | Beds/Ba | Sqft | Sold | Price | $/sf | Match |
|---|---|---|---|---|---|---|---|
| 24 Shaw Ct | 0.37mi | 3/2.5 | 2,631 (+5%) | 11mo | $369,000 | $140 | 64 |
| 1369 Pine Bluff Dr | 0.49mi | 3/3.0 | 2,590 (+4%) | 6mo | $389,900 | $151 | 64 |
| 44 Dugan Ct | 0.56mi | 3/3.0 | 2,534 (+2%) | 7mo | $375,000 | $148 | 63 |
| 4133 Stonecroft Dr | 0.57mi | 3/2.0 | 2,460 (-1%) | 8mo | $450,000 | $183 | 62 |
| 219 Kreder Ln | 0.45mi | 3/2.5 | 2,247 (-10%) | 11mo | $608,542 | $271 | 54 |
| 1359 Pine Bluff Dr | 0.47mi | 3/3.0 | 2,770 (+11%) | 8mo | $369,900 | $134 | 51 |
| 1276 Stephenridge Dr | 0.62mi | 4/2.5 (+1) | 2,276 (-9%) | 3mo | $345,000 | $152 | 49 |
| 1106 Claycrest Dr | 0.40mi | 4/2.5 (+1) | 2,168 (-13%) | 7mo | $350,000 | $161 | 48 |
| 4084 Ramona Ln | 0.65mi | 3/2.0 | 2,278 (-9%) | 10mo | $325,000 | $143 | 45 |
| 150 Hunters Pointe Dr | 0.73mi | 3/2.5 | 2,160 (-14%) | 0mo | $435,000 | $201 | 43 |
| 1415 Southgate Dr | 0.69mi | 3/3.5 | 2,233 (-10%) | 11mo | $330,000 | $148 | 37 |
| 4705 Kellykris Ct | 0.71mi | 4/2.5 (+1) | 2,144 (-14%) | 7mo | $390,000 | $182 | 33 |
Match score weights: distance 35% · size 25% · config 20% · recency 20%. Top-matched comps best support the ARV.
Projected returns pro-forma
-3.0% appreciation · 2.52% rent growth · sell at horizon
- IRR
- -2.7%
- Equity multiple
- 0.90×
- Total profit
- $-6,152
- Equity at exit
- $32,050
- IRR
- 6.4%
- Equity multiple
- 1.47×
- Total profit
- $28,376
- Equity at exit
- $18,585
Cash invested: $60,186 (down + closing). Projections, not guarantees.
Landlord ↔ Tenant lean methodology
- Overall (STATE)
- 81 Strongly Landlord-Friendly
- State Missouri
- 81 Strongly Landlord-Friendly · R+10
- County
- — inherits STATE
- City
- — inherits STATE
ZIP-level market 63304
- Rents YoY
- 2.5%
- Active inventory
- 278
- Price-to-rent
- 7.2×
Monthly cashflow live
- Estimated rent
- $2,475 high interval (Pro) →
- Mortgage (P&I)
- −$1,127
- Tax from tax record
- −$270 /mo · $3,245/yr
- Insurance
- −$90
- HOA
- −$0
- Vacancy / Maint / Mgmt
- −$520
- Net cashflow
- $468
Break-even live
UW: 25.0% down · 7.5% · 30yr · 1.5% tax · 5.0% vac · 8.0% maint · 8.0% mgmt
Financing live
Cash to close
- Down payment
- $53,738
- Closing costs
- $6,448
- Reserves months
- —
- Total cash needed
- —
Loan-product check · same deal, 3 products live
Conventional
25% down · 7.5% · 30yr
- Down + closing
- —
- Monthly P&I
- —
- Monthly cashflow
- —
- DSCR
- —
- Eligible?
- —
Personal DTI + credit; lowest rate.
DSCR
20% down · 8.5% · 30yr
- Down + closing
- —
- Monthly P&I
- —
- Monthly cashflow
- —
- DSCR
- —
- Eligible?
- —
No personal income docs; deal must DSCR.
Hard money
10% down · 12.0% · 12mo
- Down + closing
- —
- Monthly P&I
- —
- Monthly cashflow
- —
- DSCR
- —
- Eligible?
- —
Short-term bridge; refi at stabilization.
Rent comps 5 comps
| Address | Beds | Baths | Sqft | Rent | $/sqft | DOM | Units | Dist |
|---|---|---|---|---|---|---|---|---|
| 1400 Navaho Trl Saint Charles, MO | 4.0 | 2.0 | 1700 | $2,166 | $1.27 | 11d | 1 | 0.40mi |
| 4801 Greenburg Dr Saint Peters, MO | 4.0 | 2.5 | 2500 | $2,606 | $1.04 | 7d | 1 | 1.00mi |
| 7 Big Oak Dr Saint Peters, MO | 4.0 | 2.5 | 2592 | $2,745 | $1.06 | 43d | 1 | 1.13mi |
| 271 Lakeview Farms Dr Saint Charles, MO | 4.0 | 2.5 | 2784 | $3,400 | $1.22 | 17d | 1 | 1.35mi |
| 733 Pecan Hill Dr Saint Charles, MO | 3.0 | 2.0 | 1882 | $2,750 | $1.46 | 43d | 1 | 1.38mi |
Listing history 5 events
-
2026-05-04status Pending 392-char remark
Show marketing remark (392 chars)
Spacious 2 story home with 3 bedrooms, 2.5 baths and a partially finished basement. A blank canvas for you to make your own. Special features include: fireplace, open concept kitchen and living room with fireplace. Lower level has family room, office and more with this partially finished walk out to large backyard. Easy to show, set your appointment today! Some photos are virtually staged
-
2026-04-21$214,950 Active 392-char remark
Show marketing remark (392 chars)
Spacious 2 story home with 3 bedrooms, 2.5 baths and a partially finished basement. A blank canvas for you to make your own. Special features include: fireplace, open concept kitchen and living room with fireplace. Lower level has family room, office and more with this partially finished walk out to large backyard. Easy to show, set your appointment today! Some photos are virtually staged
-
1997-08-01soldstatus $105,000
-
1988-08-01soldstatus
-
1987-11-01soldstatus $90,000
ⓘ Source: listings_history table (triggers on properties + properties_extension) + one-shot
backfill from property_details.listing_events for pre-trigger history.
Tax reassessment forecast MO · Resets to sale price
- Current annual tax
- $3,245 · $270/mo
- Projected year-2 tax
- $3,245 · $270/mo
- Expected delta
- $0/yr ($0/mo · 0.0%)
ⓘ Screening estimate from a state-policy table — verify with the county assessor before closing.
Climate risk First Street
- Flood 1/10 Low FEMA zone X (unshaded) · 0% chance over 30 yrs
- Wildfire 1/10 Low
- Heat 5/10 Major 7 d/yr ≥107°F today · 20 d/yr by 30 yrs out
- Wind 2/10 Low 100% chance of damaging wind over 30 yrs
- Air quality 2/10 Low 2 unhealthy d/yr today · 2 by 30 yrs out
Nearby sold comps map
Loading sold comps map…
Walkable amenities ~0.75 mi
Loading nearby amenities…
Taxation est. · year 1
- Rental income
- $29,705
- − Mortgage interest
- −$12,041
- − Property taxes
- −$3,245
- − Insurance
- −$1,075
- − Repairs & maintenance
- −$2,376
- − Management
- −$2,376
- − Depreciation
- −$6,253
- Taxable income
- $2,339
- Est. tax owed @ 24.0%
- −$561
- After-tax cash flow
- $5,059/yr
For passive investors: Depreciation is non-cash, so a rental often shows a tax loss while cash-flowing — sheltering income. Rental losses are passive: they offset passive income freely, and up to $25,000/yr can offset ordinary (W-2) income if you actively participate and your MAGI is under $100k (phasing out to $0 by $150k); unused losses carry forward. On sale, claimed depreciation is recaptured at up to 25%, and gains may owe capital-gains tax (a 1031 exchange can defer both). Figures are a year-1 estimate at your 24.0% rate — not tax advice; consult a CPA.
Schools (NCES district)
- District
- Francis Howell R-III
- NCES district ID
- 2928950
- Math proficiency
- 53% ▼ -12.00%
- Reading proficiency
- 63% ▼ -5.00%
- Median HH income
- $79,768
- Composite
- 52.23/100
- National rank
- #1602
- State rank
- #11 of 324 in MO
Livability — St. Peters
No livability data for this city. (Only ~50 U.S. cities are tracked.)
Census & demographics
- County
- Saint Charles County · 399,703 people
- City population
- 74,876
- Metro
- St. Louis, MO-IL
- Population (ZIP)
- 43,195
- Household income
- $114,442
- Rent vs Own
- Severe rent burden
- 560.0
Population outlook (St. Charles County) Hauer SSP2
- Today (2025)
- 437,857 people
- By 2030
- 461,707 · +5.4%
- By 2040
- 503,222 · +14.9%
- By 2050
- 534,684 · +22.1%
- By 2075
- 597,047 · +36.4%
- By 2100
- 609,682 · +39.2%
Race, ethnicity, and origin ACS 2023
- Neighborhood character
- Predominantly White (87%)
- Race & ethnicity
- White 87% Two or more races 4% Hispanic / Latino 4% Black 4% Asian 2%
- Common ancestry
- Lithuanian 3% Romanian 3% Italian 3%
- Foreign-born
- 5% · Canada
- Languages at home
- 95% English-only · Spanish 2% Other Indo-European 1% Russian/Polish/Slavic 1%
Political lean MEDSL · St. Charles
- 2024 margin
- R (+17.0) · D 40.8% · R 57.8% · Other 1.4%
- 2008→2024 swing
- -7.2pp toward R · 2008: -9.7pp · 2024: -17.0pp
- All cycles
- 2024: R+17.0 2020: R+17.5 2016: R+26.4 2012: R+21.0 2008: R+9.7
Not yet ingested
- Civics
- —
Market trends
- HPI YoY
- ▼ -225.72%
- Current HPI
- 233.745
- Rent YoY
- ▲ 2.52%
- Metro
- St. Louis, MO-IL
- State GDP YoY
- ▲ 1.84%
- F500 in state
- 20
Industry mix (Fortune 500 HQ in MO)
| Industry | F500 HQs | Revenue |
|---|---|---|
| Healthcare | 1 | $163B |
|
||
| Insurance | 1 | $21B |
|
||
| Industrial Technology | 1 | $17B |
|
||
| Retail | 1 | $16B |
|
||
| Industrial Distribution | 1 | $10B |
|
||
| Utilities | 1 | $9B |
|
||
Price history
+138.8% since first listed5 events — show timeline
- 2026-05-04 Pending — MARIS as Distributed by MLS Grid
- 2026-04-21 Listed $214,950 MARIS as Distributed by MLS Grid
- 1997-08-01 Sold (Public Records) $105,000 Public Records
- 1988-08-01 Sold (Public Records) — Public Records
- 1987-11-01 Sold (Public Records) $90,000 Public Records
Property tax history
+4.3%/yrLatest (2025): $3,245 · +5.5% YoY. Source: county tax records.
Cash-flow waterfall
monthlySold comps — $/sqft
last 12 mo · ≤1 miLoading sold comps…