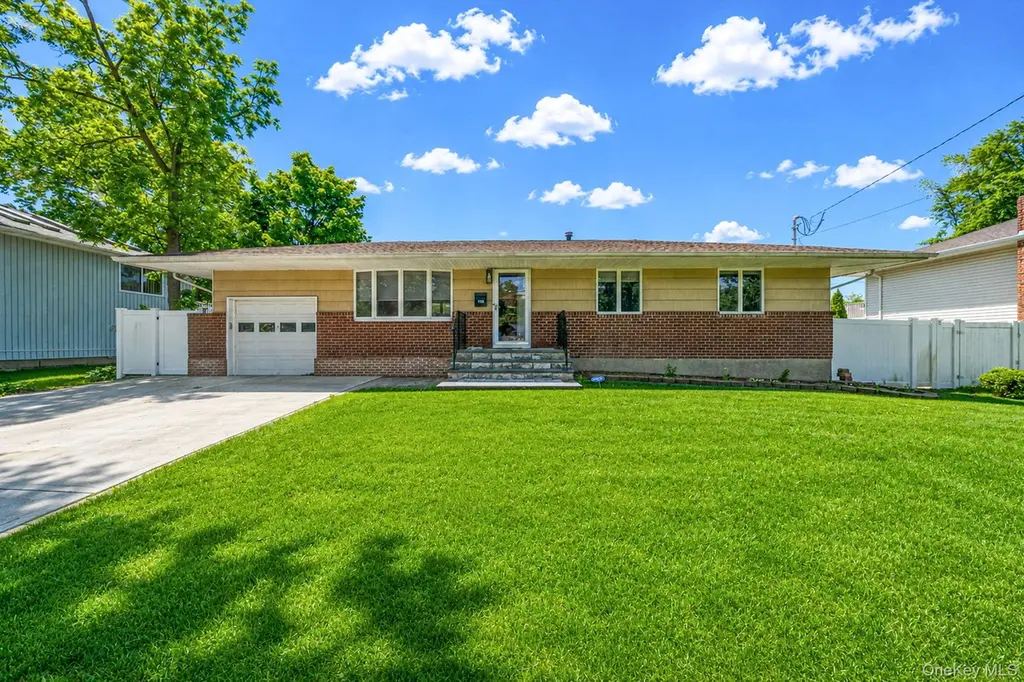
156 Wicks Rd · Commack, NY
Flood risk 1/10 · Minimal
- FEMA flood zone
- X (unshaded)
- Chance of flooding over 30 yrs
- 0.0%
- Est. flood insurance / yr
- $473 – $860
Fire risk 3/10 · Minor
- Est. fire insurance / yr
- $691 – $1,283
Heat risk 5/10 · Moderate
- Hot days now (above 98°F)
- 7 days/yr
- Hot days in 30 yrs
- 15 days/yr
Wind risk 8/10 · Major
- Chance of severe wind over 30 yrs
- 80.0%
Air-quality risk 4/10 · Minor
- Unhealthy air days now
- 4 days/yr
- Unhealthy air days in 30 yrs
- 6 days/yr
Risk factors via First Street. Map © Google.
Why this score? — see what drove the D+ grade
The composite is a weighted blend of 9 inputs, each scored 0–100. Each bar is that input's sub-score; the figure is the points it added to the 100-point composite (weight × sub-score).
- Cash flow +12.8/30.0
- ARV discount +9.4/15.0
- Schools +7.0/10.0
- DSCR +3.8/10.0
- 1% rule +3.7/10.0
- Livability +3.7/5.0
- Rent growth +2.5/5.0
- Condition / age +2.5/5.0
- Appreciation +0.0/10.0
$699,000
🖨 Deal sheet (PDF) 📄 Offer letter ✓ Due diligence
Listing remarks MLS
Welcome to 156 Wicks Road, Commack. This beautiful updated 3-bedroom, 2 full baths with full finished basement in the heart of Commack with award winning schools, is conveniently located close to shopping and all major highways. Updated kitchen with quartz countertops, wood floors throughout, great size backyard for entertaining. At this price it won't last!!
Key facts
- Quartz countertops
- Spacious backyard
- Updated kitchen
Tags
Property features AI
Exterior
- Parking: Driveway; 1-car garage
- Utilities: Public sewer; Natural gas connected
- Home design: Single family residence; Living area reported from public records
- Construction: Vinyl siding construction
- Exterior features: Vinyl siding; Not waterfront
Interior
- Kitchen: Gas cooktop; Gas oven; Gas range; Microwave
- Bedrooms: 7 total rooms (room level details not provided)
- Flooring: Wood flooring
- Bathrooms: 2 full bathrooms
- Heating & cooling: Forced air heating; Central air conditioning
- Interior features: Kitchen island; Open floor plan; Open kitchen; Finished basement; Crawl attic
- Laundry & utility: Washer hookup; Gas dryer hookup
Neighborhood map
What this means for you Summary
Snapshot
- This is a 3-bed/2.0-bath single-family listed at $699k.
Deal economics
- At list price, monthly cash flow is $-69 ($-830/yr) — negative.
- To cash-flow at today's rent, offer at most $687k (1.7% below list).
- To meet the 1% rule (rent ≥ 1% of price), the offer needs to be $611k (12.6% below list).
- Recommended offer: $611k (12.6% below list) — sets the bar for 1% rule.
- Cap rate 6.2% vs local median 3.3% in Commack — top-decile yield for the area; either an underpriced asset or a hidden risk that comps aren't pricing in. Stress-test before assuming the spread holds.
Location & tenants
- Location reads 73/100 on livability (#319 in NY) — a middle-class / working-renter tenant base. Strengths: employment A+, housing A+, crime A; Watch: amenities D, cost of living F, health & safety F.
- Commack Union Free School District (suburban): math 70% / reading 79% proficiency, ranked #61 of 590 in NY (top 10%) — strong family-tenant draw, lease renewals of 3-5y typical; only 5% free/reduced lunch — higher-income household profile.
- Zoned schools: Sawmill Intermediate School (math 50% / reading 69%, grade B-, #745 of 2,108 statewide, top 39%, 574 students, 17% FRL); Commack Middle School (math 54% / reading 67%, grade B+, #153 of 729 statewide, top 21%, 1,322 students, 16% FRL); Commack High School (math 98% / reading 97%, grade A+, #19 of 1,100 statewide, top 4%, 1,861 students, 15% FRL).
- Market conditions: 102 active listings in the ZIP; 3 comparable units currently listed for rent nearby; rentals leasing fast (median 1d on market — plan ~1-2 weeks tenant-placement turnaround); 1,366 units permitted in Suffolk County in 2024 (216 in 5+ unit buildings).
Forward outlook
- Local home prices are declining (-3.0%/yr); year-one equity from $5k of loan paydown is wiped out by about $21k of value loss. Plan a longer hold.
- Suffolk County population projected to shrink 5% by 2050 — rents likely to lag national; underwrite the cash flow, not the appreciation.
Negotiation context
- Only 11 days on market — expect competitive offers; lowballing is unlikely to land.
- 3 sale attempts since 7y ago with the ask held roughly flat each time — persistent listings suggest the price (not the market) is what's stuck; bring a comps-based counter.
Risks & watch-outs
- Climate carrying-cost: severe wind risk, 80% chance of damaging wind over 30y; extreme-heat days projected 7→15/yr by 2055 (HVAC capex compounding) — expect insurance premiums to compound above CPI over the hold.
Questions for the listing agent
- What do current leases actually rent for vs. the listed asking? Can we see a recent rent roll and the last 12 months of T-12 income?
- Built in 1961 — when were the roof, HVAC, electrical panel, plumbing, and water heater last replaced?
- Is there a deadline driving the sale (1031 exchange, divorce, estate, relocation)? That informs how much negotiation room exists.
- Schools are A-rated — typically a magnet for longer-tenancy family renters. What's the average tenant stay here, and is there a school-zone premium baked into asking?
- The area grade is low — what's the realistic commute time and amenity access for the typical tenant pool here? Any planned neighborhood developments (good or bad) we should know about?
- What's the average days-on-market for RENTAL listings here right now (not sales)? A rising rental-DOM trend means longer vacancies and softer asking-rent achievability than the comps imply.
- What's the recent tenant-quality profile in this submarket — average credit score on applications, eviction rate, late-payment / NSF rate, and stable-employment percentage? A property-management company in the area should have these aggregated.
- How much new for-sale + rental construction is in the pipeline within 1–3 miles? Heavy new supply typically softens prices + rents 12–24 months out; constrained supply supports both.
Investment metrics
- 1% rule
- 0.87% ✗
- Cap rate
- 6.17%
- Cash-on-cash
- -0.42%
- DSCR
- 0.98
- GRM
- 9.5
CMA / ARV
- ARV (on-the-fly)
- $730,500
- Comps found
- 12
Show comp detail 12 sales within ~0.75 mi
| Address | Dist | Beds/Ba | Sqft | Sold | Price | $/sf | Match |
|---|---|---|---|---|---|---|---|
| 7 Joyce Ln | 0.30mi | 3/2.0 | 1,475 (-2%) | 5mo | $725,000 | $492 | 80 |
| 23 Olga Ln | 0.32mi | 3/1.0 | 1,458 (-3%) | 0mo | $700,000 | $480 | 76 |
| 3 Saratoga St | 0.35mi | 3/1.5 | 1,549 (+3%) | 1mo | $690,000 | $445 | 75 |
| 41 Wiltshire Dr | 0.40mi | 3/1.5 | 1,600 (+7%) | 2mo | $733,000 | $458 | 66 |
| 44 Delaware Ave | 0.62mi | 3/1.5 | 1,500 (0%) | 4mo | $735,000 | $490 | 66 |
| 10 Otsego Pl | 0.63mi | 3/2.0 | 1,500 (0%) | 7mo | $785,000 | $523 | 65 |
| 63 Hedgerow Ln | 0.69mi | 3/2.0 | 1,500 (0%) | 7mo | $731,000 | $487 | 62 |
| 22 Niagara Ln | 0.31mi | 3/1.5 | 1,300 (-13%) | 3mo | $850,000 | $654 | 58 |
| 17 Wyoming St | 0.53mi | 3/1.5 | 1,600 (+7%) | 7mo | $720,000 | $450 | 57 |
| 11 Dwight Cir | 0.38mi | 3/2.0 | 1,700 (+13%) | 6mo | $762,000 | $448 | 55 |
| 17 Wayne Pl | 0.57mi | 3/1.5 | 1,600 (+7%) | 7mo | $660,000 | $413 | 55 |
| 6 Grand Haven Ct | 0.67mi | 4/2.0 (+1) | 1,275 (-15%) | 1mo | $785,000 | $616 | 38 |
Match score weights: distance 35% · size 25% · config 20% · recency 20%. Top-matched comps best support the ARV.
Projected returns pro-forma
-3.0% appreciation · 3.0% rent growth · sell at horizon
- IRR
- -17.0%
- Equity multiple
- 0.40×
- Total profit
- $-117,539
- Equity at exit
- $104,223
- IRR
- -8.8%
- Equity multiple
- 0.45×
- Total profit
- $-107,484
- Equity at exit
- $60,437
Cash invested: $195,720 (down + closing). Projections, not guarantees.
Landlord ↔ Tenant lean methodology
- Overall (STATE)
- 15 Strongly Tenant-Friendly
- State New York
- 15 Strongly Tenant-Friendly · D+10
- County
- — inherits STATE
- City
- — inherits STATE
ZIP-level market 11725
- Active inventory
- 102
- Price-to-rent
- 9.5×
Monthly cashflow live
- Estimated rent
- $6,109 medium interval (Pro) →
- Mortgage (P&I)
- −$3,666
- Tax from tax record
- −$939 /mo · $11,262/yr
- Insurance
- −$291
- HOA
- −$0
- Vacancy / Maint / Mgmt
- −$1,283
- Net cashflow
- $-69
Break-even live
Sensitivity live
| Price | -10% $327 | -5% $129 | +0% $-69 | +5% $-267 | +10% $-465 |
|---|---|---|---|---|---|
| Rent | -10% $-552 | -5% $-310 | +0% $-69 | +5% $172 | +10% $413 |
| Rate | -1.0pp $283 | -0.5pp $109 | base $-69 | +0.5pp $-250 | +1.0pp $-435 |
UW: 25.0% down · 7.5% · 30yr · 1.5% tax · 5.0% vac · 8.0% maint · 8.0% mgmt
Financing live
Cash to close
- Down payment
- $174,750
- Closing costs
- $20,970
- Reserves months
- —
- Total cash needed
- —
Loan-product check · same deal, 3 products live
Conventional
25% down · 7.5% · 30yr
- Down + closing
- —
- Monthly P&I
- —
- Monthly cashflow
- —
- DSCR
- —
- Eligible?
- —
Personal DTI + credit; lowest rate.
DSCR
20% down · 8.5% · 30yr
- Down + closing
- —
- Monthly P&I
- —
- Monthly cashflow
- —
- DSCR
- —
- Eligible?
- —
No personal income docs; deal must DSCR.
Hard money
10% down · 12.0% · 12mo
- Down + closing
- —
- Monthly P&I
- —
- Monthly cashflow
- —
- DSCR
- —
- Eligible?
- —
Short-term bridge; refi at stabilization.
Rent comps 3 comps
| Address | Beds | Baths | Sqft | Rent | $/sqft | DOM | Units | Dist |
|---|---|---|---|---|---|---|---|---|
| 200 Sutton Landing Ct Commack, NY | 2.0 | 2.5 | 1795 | $7,400 | $4.12 | 0d | 4 | 0.63mi |
| 85 Rhett Ct Commack, NY | 2.0 | 2.5 | 1290 | $4,850 | $3.76 | 45d | 1 | 1.13mi |
| 18 Amalia Ln Commack, NY | 3.0 | 1.5 | 1800 | $5,000 | $2.78 | 0d | 1 | 1.23mi |
Listing history 9 events
-
2026-06-17status $699,000 Pending 11 DOM
-
2026-06-16days on market $699,000 Active 11 DOM
-
2026-06-15days on market $699,000 Active 10 DOM
-
2026-06-13days on market $699,000 Active 8 DOM
-
2026-06-13days on market $699,000 Active 7 DOM
-
2026-06-09days on market $699,000 Active 4 DOM
-
2026-06-08days on market $699,000 Active 3 DOM
-
2026-06-07remarks 699-char remark
-
2026-06-07$699,000 Active 2 DOM
ⓘ Source: listings_history table (triggers on properties + properties_extension) + one-shot
backfill from property_details.listing_events for pre-trigger history.
Tax reassessment forecast NY · Partial reset (capped growth)
- Current annual tax
- $11,262 · $939/mo
- Projected year-2 tax
- $11,538 · $961/mo
- Expected delta
- +$275/yr (+$23/mo · 2.4%)
ⓘ Screening estimate from a state-policy table — verify with the county assessor before closing.
Climate risk First Street
- Flood 1/10 Low FEMA zone X (unshaded) · 0% chance over 30 yrs
- Wildfire 3/10 Moderate
- Heat 5/10 Major 7 d/yr ≥98°F today · 15 d/yr by 30 yrs out
- Wind 8/10 Severe 80% chance of damaging wind over 30 yrs
- Air quality 4/10 Moderate 4 unhealthy d/yr today · 6 by 30 yrs out
Nearby sold comps map
Loading sold comps map…
Walkable amenities ~0.75 mi
Loading nearby amenities…
Taxation est. · year 1
- Rental income
- $73,311
- − Mortgage interest
- −$39,155
- − Property taxes
- −$11,262
- − Insurance
- −$3,495
- − Repairs & maintenance
- −$5,865
- − Management
- −$5,865
- − Depreciation
- −$20,335
- Taxable loss
- −$12,666
- Est. tax savings @ 24.0%
- +$3,040
- After-tax cash flow
- $2,210/yr
For passive investors: Depreciation is non-cash, so a rental often shows a tax loss while cash-flowing — sheltering income. Rental losses are passive: they offset passive income freely, and up to $25,000/yr can offset ordinary (W-2) income if you actively participate and your MAGI is under $100k (phasing out to $0 by $150k); unused losses carry forward. On sale, claimed depreciation is recaptured at up to 25%, and gains may owe capital-gains tax (a 1031 exchange can defer both). Figures are a year-1 estimate at your 24.0% rate — not tax advice; consult a CPA.
Schools (NCES district)
- District
- Commack Union Free School District
- NCES district ID
- 3608130
- Math proficiency
- 70% ▼ -8.00%
- Reading proficiency
- 79% ▲ 4.00%
- Median HH income
- $117,583
- Composite
- 69.52/100
- National rank
- #306
- State rank
- #61 of 590 in NY
Livability — Commack
- Score
- 73/100
- State rank
- #319
- US rank
- #5296
Category grades
Schools grade is shown separately in the Schools card above.
Census & demographics
- Census place
- Commack, NY
- City population
- 58,941
- Population (ZIP)
- 29,050
Population outlook (Suffolk County) Hauer SSP2
- Today (2025)
- 1,505,262 people
- By 2030
- 1,498,318 · -0.5%
- By 2040
- 1,471,101 · -2.3%
- By 2050
- 1,424,848 · -5.3%
- By 2075
- 1,337,157 · -11.2%
- By 2100
- 1,217,720 · -19.1%
Race, ethnicity, and origin ACS 2023
- Neighborhood character
- Predominantly White (81%)
- Race & ethnicity
- White 81% Hispanic / Latino 10% Asian 6% Two or more races 5% Black 2%
- Hispanic origin (detail)
- Puerto Rican 4%
- Common ancestry
- Romanian 5% Scotch-Irish 5% Italian 2%
- Foreign-born
- 10% · Canada, China, Jamaica
- Languages at home
- 85% English-only · Other Indo-European 4% Spanish 3% Russian/Polish/Slavic 2%
Political lean MEDSL · Suffolk
- 2024 margin
- Lean R (+10.0) · D 45.0% · R 55.0%
- 2008→2024 swing
- -16.0pp toward R · 2008: 6.0pp · 2024: -10.0pp
- All cycles
- 2024: R+10.0 2020: R+0.0 2016: R+8.2 2012: D+2.9 2008: D+6.0
Not yet ingested
- Civics
- —
Market trends
- HPI YoY
- ▼ -795.52%
- Current HPI
- 262.3806
- Rent YoY
- —
- Metro
- —
- State GDP YoY
- ▲ 2.60%
- F500 in state
- 92
Industry mix (Fortune 500 HQ in NY)
| Industry | F500 HQs | Revenue |
|---|---|---|
| Financial Services | 10 | $950B |
|
||
| Consumer Goods | 9 | $162B |
|
||
| Insurance | 4 | $225B |
|
||
| Telecommunications | 2 | $144B |
|
||
| Pharmaceuticals | 2 | $112B |
|
||
| Media / Entertainment | 2 | $69B |
|
||
Price history
+62.9% since first listed9 events — show timeline
- 2026-05-25 Listed $699,000 OneKey® MLS as Distributed by MLS Grid
- 2026-01-23 Sold (Public Records) $705,000 Public Records
- 2025-10-17 Sold (MLS) $705,000 OneKey® MLS as Distributed by MLS Grid
- 2025-07-30 Pending — OneKey® MLS as Distributed by MLS Grid
- 2025-07-08 Listed $679,999 OneKey® MLS as Distributed by MLS Grid
- 2020-02-28 Sold (Public Records) $429,000 Public Records
- 2019-12-06 Sold (MLS) $429,000 OneKey® MLS as Distributed by MLS Grid
- 2019-09-17 Pending — OneKey® MLS as Distributed by MLS Grid
- 2019-08-27 Listed $429,000 OneKey® MLS as Distributed by MLS Grid
Property tax history
+1.5%/yrLatest (2025): $11,262 · +0.0% YoY. Source: county tax records.
Cash-flow waterfall
monthlySold comps — $/sqft
last 12 mo · ≤1 miLoading sold comps…