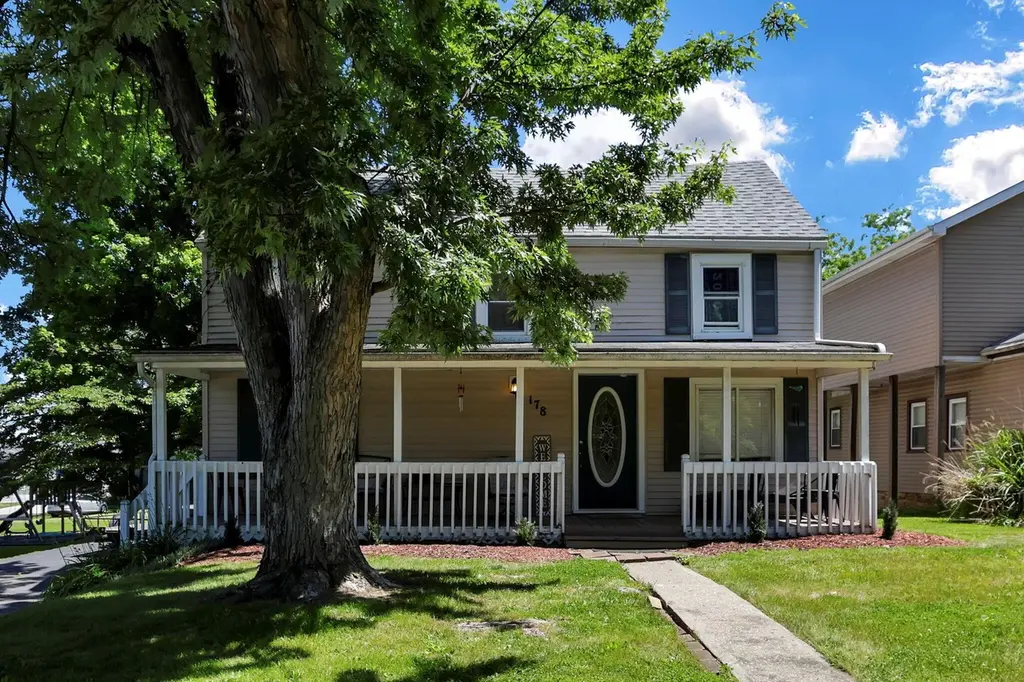
178 E South St · Lithopolis, OH
Flood risk 1/10 · Minimal
- FEMA flood zone
- X (unshaded)
- Chance of flooding over 30 yrs
- 0.0%
- Est. flood insurance / yr
- $473 – $860
Fire risk 1/10 · Minimal
- Est. fire insurance / yr
- $713 – $1,323
Heat risk 3/10 · Minor
- Hot days now (above 98°F)
- 6 days/yr
- Hot days in 30 yrs
- 16 days/yr
Wind risk 2/10 · Minimal
- Chance of severe wind over 30 yrs
- —
Air-quality risk 2/10 · Minimal
- Unhealthy air days now
- 1 days/yr
- Unhealthy air days in 30 yrs
- 1 days/yr
Risk factors via First Street. Map © Google.
Why this score? — see what drove the C+ grade
The composite is a weighted blend of 9 inputs, each scored 0–100. Each bar is that input's sub-score; the figure is the points it added to the 100-point composite (weight × sub-score).
- Cash flow +17.2/30.0
- ARV discount +15.0/15.0
- Schools +5.7/10.0
- DSCR +5.4/10.0
- Appreciation +4.8/10.0
- 1% rule +4.3/10.0
- Livability +3.8/5.0
- Rent growth +2.5/5.0
- Condition / age +2.5/5.0
$269,900
🖨 Deal sheet 📄 Offer letter ✓ Due diligence
Listing remarks
You'll notice a touch of Victorian as you approach this lovely Lithopolis old village home. Located within walking distance of all the best spots around town and just 20 to 25 minutes from Columbus or Lancaster! Walk to the Wagnalls Memorial Library, Community Center and Gardens, the coffee shop, restaurants, Wilson Park and more! Spacious 1st Floor Primary Bedroom and 3 more rooms on the 2nd floor. Some nice updates throughout but still room to put your own vision in place! Selling As Is - See Agent to Agent Remarks.
Key facts
- Walking distance
- Community center
- Wilson park
Tags
Property features AI
Exterior
- Parking: On-street parking
- Utilities: Public water; Public sewer
- Home design: Single-family home; Two levels; Built in 1914; No shared/common walls
- Construction: Block foundation
- Exterior features: Deck
Interior
- Bedrooms: One main-level bedroom
- Flooring: Wood flooring; Vinyl flooring
- Bathrooms: Two full bathrooms
- Heating & cooling: Central air conditioning; Forced-air heating
- Interior features: Full basement; 1,560 total living area
Neighborhood map
What this means for you Summary
Snapshot
- This is a 4-bed/2.0-bath single-family listed at $270k.
Deal economics
- At list price, monthly cash flow is $194 ($2k/yr) — positive.
- The deal already cash-flows at list — no discount required.
- To meet the 1% rule (rent ≥ 1% of price), the offer needs to be $251k (7.0% below list).
- Recommended offer: $251k (7.0% below list) — sets the bar for 1% rule.
- Cap rate 7.2% vs local median 3.6% in Lithopolis — top-decile yield for the area; either an underpriced asset or a hidden risk that comps aren't pricing in. Stress-test before assuming the spread holds.
Location & tenants
- Location reads 76/100 on livability (#232 in OH, #3,655 nationally) — a middle-class / working-renter tenant base. Strengths: crime A+, employment A+, cost of living A+; Watch: amenities F, commute F.
- Bloom-Carroll Local (rural): math 58% / reading 71% proficiency, ranked #179 of 656 in OH (top 27%) — acceptable for families but not a draw, mixed tenant base, ~2y average lease; only 16% free/reduced lunch — higher-income household profile.
- Market conditions: 26 active listings in the ZIP; 1 comparable units currently listed for rent nearby; solid renter incomes; 475 units permitted in Fairfield County in 2024 (0 in 5+ unit buildings).
Forward outlook
- In year one you build about $980 of equity ($2k loan paydown + $-886 appreciation (-0.3% local appreciation)).
- Fairfield County population projected at +8% by 2050 — modest demand growth; plan on rents tracking national, not racing it.
Negotiation context
- Only 13 days on market — expect competitive offers; lowballing is unlikely to land.
- 3 sale attempts since 8y ago with the ask held roughly flat each time — persistent listings suggest the price (not the market) is what's stuck; bring a comps-based counter.
- Current owner paid $145k; list at $270k implies a 86% gain — meaningful room to come down on a strong offer.
Risks & watch-outs
- Watch-outs: built in 1914 — expect roof / HVAC / electrical / plumbing capex.
Questions for the listing agent
- Built in 1914 — when were the roof, HVAC, electrical panel, plumbing, and water heater last replaced?
- Is there a deadline driving the sale (1031 exchange, divorce, estate, relocation)? That informs how much negotiation room exists.
- Schools are A-rated — typically a magnet for longer-tenancy family renters. What's the average tenant stay here, and is there a school-zone premium baked into asking?
- What's the average days-on-market for RENTAL listings here right now (not sales)? A rising rental-DOM trend means longer vacancies and softer asking-rent achievability than the comps imply.
- What's the recent tenant-quality profile in this submarket — average credit score on applications, eviction rate, late-payment / NSF rate, and stable-employment percentage? A property-management company in the area should have these aggregated.
- How much new for-sale + rental construction is in the pipeline within 1–3 miles? Heavy new supply typically softens prices + rents 12–24 months out; constrained supply supports both.
Investment metrics
- 1% rule
- 0.93% ✗
- Cap rate
- 7.16%
- Cash-on-cash
- 3.08%
- DSCR
- 1.14
- GRM
- 9.0
CMA / ARV
- ARV (on-the-fly)
- $340,080
- Comps found
- 1
Show comp detail 1 sale within ~0.75 mi
| Address | Dist | Beds/Ba | Sqft | Sold | Price | $/sf | Match |
|---|---|---|---|---|---|---|---|
| 149 Wheatley Dr | 0.74mi | 4/2.0 | 1,750 (+12%) | 10mo | $381,340 | $218 | 36 |
Match score weights: distance 35% · size 25% · config 20% · recency 20%. Top-matched comps best support the ARV.
Projected returns pro-forma
-0.33% appreciation · 3.0% rent growth · sell at horizon
- IRR
- 0.1%
- Equity multiple
- 1.00×
- Total profit
- $328
- Equity at exit
- $73,969
- IRR
- 6.0%
- Equity multiple
- 1.62×
- Total profit
- $46,981
- Equity at exit
- $85,474
Cash invested: $75,572 (down + closing). Projections, not guarantees.
Landlord ↔ Tenant lean methodology
- Overall (STATE)
- 73 Landlord-Friendly
- State Ohio
- 73 Landlord-Friendly · R+6
- County
- — inherits STATE
- City
- — inherits STATE
ZIP-level market 43136
- Home prices YoY
- -0.1%
- Active inventory
- 26
- Price-to-rent
- 9.0×
Monthly cashflow live
- Estimated rent
- $2,511 medium interval (Pro) →
- Mortgage (P&I)
- −$1,415
- Tax from tax record
- −$262 /mo · $3,140/yr
- Insurance
- −$112
- HOA
- −$0
- Vacancy / Maint / Mgmt
- −$527
- Net cashflow
- $194
Break-even live
UW: 25.0% down · 7.5% · 30yr · 1.5% tax · 5.0% vac · 8.0% maint · 8.0% mgmt
Financing live
Cash to close
- Down payment
- $67,475
- Closing costs
- $8,097
- Reserves months
- —
- Total cash needed
- —
Loan-product check · same deal, 3 products live
Conventional
25% down · 7.5% · 30yr
- Down + closing
- —
- Monthly P&I
- —
- Monthly cashflow
- —
- DSCR
- —
- Eligible?
- —
Personal DTI + credit; lowest rate.
DSCR
20% down · 8.5% · 30yr
- Down + closing
- —
- Monthly P&I
- —
- Monthly cashflow
- —
- DSCR
- —
- Eligible?
- —
No personal income docs; deal must DSCR.
Hard money
10% down · 12.0% · 12mo
- Down + closing
- —
- Monthly P&I
- —
- Monthly cashflow
- —
- DSCR
- —
- Eligible?
- —
Short-term bridge; refi at stabilization.
Rent comps 1 comps
| Address | Beds | Baths | Sqft | Rent | $/sqft | DOM | Units | Dist |
|---|---|---|---|---|---|---|---|---|
| 891 Orwell St Lithopolis, OH | 3.0 | 2.5 | 2080 | $2,511 | $1.21 | 2d | 1 | 1.29mi |
Listing history 10 events
-
2026-06-18days on market $269,900 Active 13 DOM
-
2026-06-17days on market $269,900 Active 12 DOM
-
2026-06-16days on market $269,900 Active 11 DOM
-
2026-06-15days on market $269,900 Active 10 DOM
-
2026-06-13days on market $269,900 Active 8 DOM
-
2026-06-13days on market $269,900 Active 7 DOM
-
2026-06-09days on market $269,900 Active 4 DOM
-
2026-06-08days on market $269,900 Active 3 DOM
-
2026-06-07remarks 527-char remark
-
2026-06-07$269,900 Active 2 DOM
ⓘ Source: listings_history table (triggers on properties + properties_extension) + one-shot
backfill from property_details.listing_events for pre-trigger history.
Tax reassessment forecast OH · Partial reset (capped growth)
- Current annual tax
- $3,140 · $262/mo
- Projected year-2 tax
- $3,675 · $306/mo
- Expected delta
- +$535/yr (+$45/mo · 17.1%)
ⓘ Screening estimate from a state-policy table — verify with the county assessor before closing.
Climate risk First Street
- Flood 1/10 Low FEMA zone X (unshaded) · 0% chance over 30 yrs
- Wildfire 1/10 Low
- Heat 3/10 Moderate 6 d/yr ≥98°F today · 16 d/yr by 30 yrs out
- Wind 2/10 Low
- Air quality 2/10 Low 1 unhealthy d/yr today · 1 by 30 yrs out
Nearby sold comps map
Loading sold comps map…
Walkable amenities ~0.75 mi
Loading nearby amenities…
Taxation est. · year 1
- Rental income
- $30,132
- − Mortgage interest
- −$15,119
- − Property taxes
- −$3,140
- − Insurance
- −$1,350
- − Repairs & maintenance
- −$2,411
- − Management
- −$2,411
- − Depreciation
- −$7,852
- Taxable loss
- −$2,149
- Est. tax savings @ 24.0%
- +$516
- After-tax cash flow
- $2,846/yr
For passive investors: Depreciation is non-cash, so a rental often shows a tax loss while cash-flowing — sheltering income. Rental losses are passive: they offset passive income freely, and up to $25,000/yr can offset ordinary (W-2) income if you actively participate and your MAGI is under $100k (phasing out to $0 by $150k); unused losses carry forward. On sale, claimed depreciation is recaptured at up to 25%, and gains may owe capital-gains tax (a 1031 exchange can defer both). Figures are a year-1 estimate at your 24.0% rate — not tax advice; consult a CPA.
Schools (NCES district)
- District
- Bloom-Carroll Local
- NCES district ID
- 3904686
- Math proficiency
- 58% ▼ -15.00%
- Reading proficiency
- 71% ▼ -5.00%
- Median HH income
- $76,614
- Composite
- 57.3/100
- National rank
- #1089
- State rank
- #179 of 656 in OH
Livability — Lithopolis
- Score
- 76/100
- State rank
- #232
- US rank
- #3655
Category grades
Schools grade is shown separately in the Schools card above.
Census & demographics
- Census place
- Lithopolis, OH
- County
- Fairfield · 186,676 people
- Metro
- Columbus, OH
- Population (ZIP)
- 2,270
- Household income
- $109,297
- Rent vs Own
- Severe rent burden
- 7.1
Population outlook (Fairfield County) Hauer SSP2
- Today (2025)
- 162,442 people
- By 2030
- 166,796 · +2.7%
- By 2040
- 172,835 · +6.4%
- By 2050
- 174,822 · +7.6%
- By 2075
- 174,938 · +7.7%
- By 2100
- 160,988 · -0.9%
Race, ethnicity, and origin ACS 2023
- Neighborhood character
- Predominantly White (80%)
- Race & ethnicity
- White 80% Hispanic / Latino 11% Two or more races 9% Black 3% Asian 1%
- Hispanic origin (detail)
- Mexican 5%
- Common ancestry
- Slovak 4% Romanian 2% Italian 2%
- Foreign-born
- 3% · Canada
- Languages at home
- 94% English-only · Spanish 4% Other Asian/Pacific 1%
Political lean MEDSL · Fairfield
- 2024 margin
- Strong R (+24.1) · D 37.5% · R 61.6%
- 2008→2024 swing
- -6.9pp toward R · 2008: -17.1pp · 2024: -24.1pp
- All cycles
- 2024: R+24.1 2020: R+23.5 2016: R+27.0 2012: R+16.1 2008: R+17.1
Not yet ingested
- Civics
- —
Market trends
- HPI YoY
- ▼ -0.33%
- Current HPI
- 216.9937
- Rent YoY
- —
- Metro
- —
- State GDP YoY
- ▲ 1.98%
- F500 in state
- 48
Industry mix (Fortune 500 HQ in OH)
| Industry | F500 HQs | Revenue |
|---|---|---|
| Insurance | 3 | $145B |
|
||
| Industrial Machinery | 3 | $49B |
|
||
| Financial Services | 3 | $24B |
|
||
| Consumer Goods | 2 | $93B |
|
||
| Aerospace / Defense | 2 | $47B |
|
||
| Utilities | 2 | $33B |
|
||
Price history
+68.8% since first listed8 events — show timeline
- 2026-06-05 Listed $269,900 CBRMLS
- 2018-09-17 Sold (Public Records) $145,000 Public Records
- 2018-09-07 Sold (MLS) $145,000 CBRMLS
- 2018-08-29 Contingent — CBRMLS
- 2018-08-18 Price Changed $154,900 CBRMLS
- 2018-08-04 Relisted — CBRMLS
- 2018-07-23 Contingent — CBRMLS
- 2018-07-20 Listed $159,900 CBRMLS
Property tax history
+7.3%/yrLatest (2025): $3,140 · +35.5% YoY. Source: county tax records.
Cash-flow waterfall
monthlySold comps — $/sqft
last 12 mo · ≤1 miLoading sold comps…