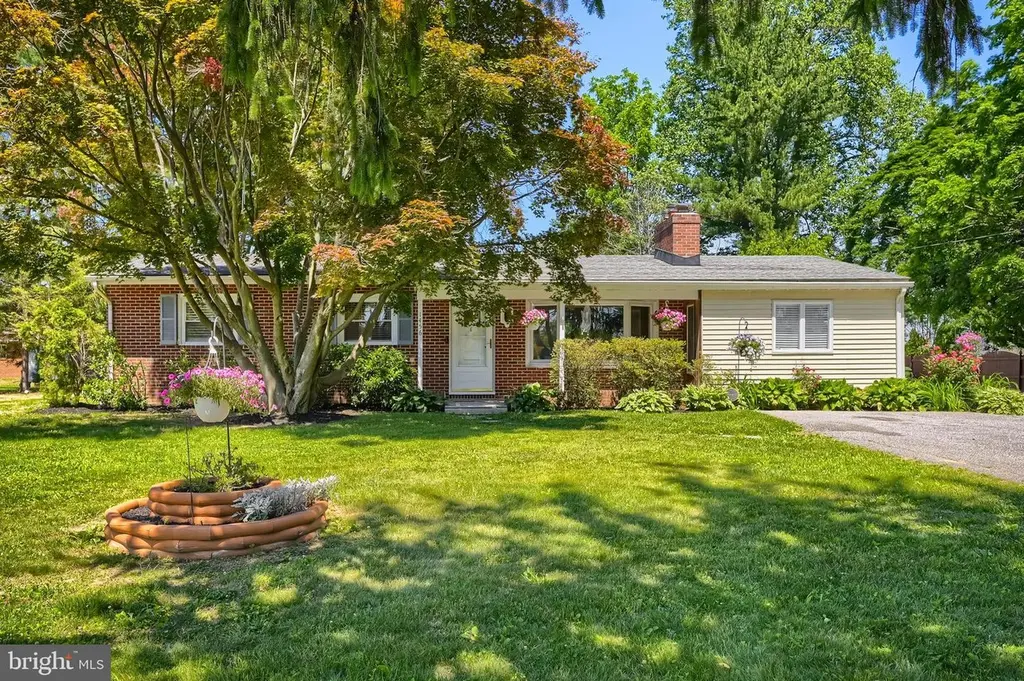
1456 Deer Park Rd · Eldersburg, MD
Flood risk 1/10 · Minimal
- FEMA flood zone
- X (unshaded)
- Chance of flooding over 30 yrs
- 0.0%
- Est. flood insurance / yr
- $473 – $860
Fire risk 3/10 · Minor
- Est. fire insurance / yr
- $755 – $1,403
Heat risk 5/10 · Moderate
- Hot days now (above 104°F)
- 7 days/yr
- Hot days in 30 yrs
- 15 days/yr
Wind risk 4/10 · Minor
- Chance of severe wind over 30 yrs
- 13.0%
Air-quality risk 3/10 · Minor
- Unhealthy air days now
- 2 days/yr
- Unhealthy air days in 30 yrs
- 3 days/yr
Risk factors via First Street. Map © Google.
Why this score? — see what drove the F grade
The composite is a weighted blend of 9 inputs, each scored 0–100. Each bar is that input's sub-score; the figure is the points it added to the 100-point composite (weight × sub-score).
- ARV discount +15.0/15.0
- Cash flow +4.8/30.0
- Livability +3.8/5.0
- Schools +3.7/10.0
- Rent growth +2.5/5.0
- Condition / age +2.5/5.0
- 1% rule +0.0/10.0
- DSCR +0.0/10.0
- Appreciation +0.0/10.0
$475,000
🖨 Deal sheet 📄 Offer letter ✓ Due diligence
Listing remarks
* * * Open House - Saturday June 20th 11:00 - 12:30 * * * Welcome home to this gorgeous 4-bedroom, 2-bath rancher nestled in the sought-after community of Carroll Heights in Carroll County. From the moment you step through the front door, you'll be greeted by a beautifully updated living room featuring a large bow window that fills the space with natural light, elegant crown molding, a cozy fireplace, and new luxury vinyl plank flooring. The spacious eat-in kitchen/dining area is the heart of the home, offering table space, granite countertops, newer white cabinetry, stainless steel appliances, and hardwood flooring. Just off the kitchen, the separate dining room showcases beautiful
Key facts
- Separate dining room
- Huge family room
- Built-in hutch
Tags
Property features AI
Exterior
- Parking: Detached garage (2 spaces) with front and side entry; Asphalt driveway with approximately 12 driveway spaces; Total of 14 garage and parking spaces
- Security: Storm doors
- Utilities: Well water; Septic system; Electric service
- Home design: Detached structure; Architectural shingle roof; Bay/Bow and double-hung windows; Block foundation
- Construction: Brick construction; Block foundation; Built (year source: assessor)
- Exterior features: Patio(s); Porch(es); Awning(s); Exterior lighting; Flood lights; Above-ground personal pool
Interior
- Kitchen: Built-in microwave; Dishwasher; Disposal; Icemaker; Electric oven/range; Refrigerator; Stainless steel appliances
- Bedrooms: Four main-level bedrooms; Room list includes Living Room, Dining Room, Bedroom 1, Bedroom 2, Bedroom 3, Bedroom 4, Bonus Room
- Flooring: Carpet; Ceramic tile; Hardwood; Luxury vinyl plank
- Bathrooms: Two full bathrooms (one on main level, one on lower level)
- Heating & cooling: Forced air heating; Heat pump(s); Electric heating and hot water; Central air conditioning; Ceiling fans
- Interior features: Attic; Tub with shower; Breakfast area; Built-ins; Ceiling fans; Chair railings; Combination kitchen/dining; Crown moldings; Dining area; Family room off kitchen; Formal dining room; Eat-in kitchen; Gourmet kitchen; Recessed lighting; Window treatments; Wood floors
- Laundry & utility: Washer and dryer included; Laundry located in basement; Water heater
Neighborhood map
What this means for you Summary
Snapshot
- This is a 4-bed/2.0-bath single-family listed at $475k.
Deal economics
- At list price, monthly cash flow is $-1k ($-14k/yr) — negative.
- To cash-flow at today's rent, offer at most $271k (43.0% below list).
- To meet the 1% rule (rent ≥ 1% of price), the offer needs to be $227k (52.2% below list).
- Recommended offer: $227k (52.2% below list) — sets the bar for 1% rule.
- Cap rate 3.4% vs local median 2.2% in Eldersburg — top-decile yield for the area; either an underpriced asset or a hidden risk that comps aren't pricing in. Stress-test before assuming the spread holds.
Location & tenants
- Location reads 75/100 on livability (#103 in MD, #3,957 nationally) — a middle-class / working-renter tenant base. Strengths: employment A+, housing A+, health & safety A+; Watch: commute F, cost of living F.
- Carroll County Public Schools (suburban): math 32% / reading 47% proficiency, ranked #2 of 24 in MD (top 8%) — families likely to look elsewhere, expect single-tenant / working-renter base with shorter leases; only 16% free/reduced lunch — higher-income household profile.
- Market conditions: 36 active listings in the ZIP; 156 units permitted in Carroll County in 2024 (12 in 5+ unit buildings).
Forward outlook
- Local home prices are declining (-3.0%/yr); year-one equity from $3k of loan paydown is wiped out by about $14k of value loss. Plan a longer hold.
- Carroll County population projected to shrink 7% by 2050 — rents likely to lag national; underwrite the cash flow, not the appreciation.
Negotiation context
- Only 8 days on market — expect competitive offers; lowballing is unlikely to land.
- 3 sale attempts since 19y ago with the ask held roughly flat each time — persistent listings suggest the price (not the market) is what's stuck; bring a comps-based counter.
- Current owner paid $375k; 27% above their basis — modest negotiation headroom, anchor on the comps not their cost.
Risks & watch-outs
- Climate carrying-cost: extreme-heat days projected 7→15/yr by 2055 (HVAC capex compounding) — expect insurance premiums to compound above CPI over the hold.
Questions for the listing agent
- What do current leases actually rent for vs. the listed asking? Can we see a recent rent roll and the last 12 months of T-12 income?
- Built in 1963 — when were the roof, HVAC, electrical panel, plumbing, and water heater last replaced?
- Is there a deadline driving the sale (1031 exchange, divorce, estate, relocation)? That informs how much negotiation room exists.
- Schools are B-rated — typically a magnet for longer-tenancy family renters. What's the average tenant stay here, and is there a school-zone premium baked into asking?
- The area grade is low — what's the realistic commute time and amenity access for the typical tenant pool here? Any planned neighborhood developments (good or bad) we should know about?
- What's the average days-on-market for RENTAL listings here right now (not sales)? A rising rental-DOM trend means longer vacancies and softer asking-rent achievability than the comps imply.
- What's the recent tenant-quality profile in this submarket — average credit score on applications, eviction rate, late-payment / NSF rate, and stable-employment percentage? A property-management company in the area should have these aggregated.
- How much new for-sale + rental construction is in the pipeline within 1–3 miles? Heavy new supply typically softens prices + rents 12–24 months out; constrained supply supports both.
Investment metrics
- 1% rule
- 0.48% ✗
- Cap rate
- 3.37%
- Cash-on-cash
- -10.44%
- DSCR
- 0.54
- GRM
- 17.4
CMA / ARV
- ARV (on-the-fly)
- $576,472
- Comps found
- 4
Show comp detail 4 sales within ~0.75 mi
| Address | Dist | Beds/Ba | Sqft | Sold | Price | $/sf | Match |
|---|---|---|---|---|---|---|---|
| 2602 Jeffrey Lori Dr | 0.38mi | 3/3.0 (-1) | 2,192 (-8%) | 12mo | $505,000 | $230 | 49 |
| 2612 Jeffrey Lori Dr | 0.44mi | 3/2.0 (-1) | 2,117 (-12%) | 9mo | $510,000 | $241 | 48 |
| 3175 Wheatfield Rd | 0.52mi | 5/3.0 (+1) | 2,647 (+11%) | 3mo | $705,000 | $266 | 47 |
| 1714 Antler Ln | 0.73mi | 3/2.0 (-1) | 2,304 (-4%) | 17mo | $436,000 | $189 | 41 |
Match score weights: distance 35% · size 25% · config 20% · recency 20%. Top-matched comps best support the ARV.
Projected returns pro-forma
-3.0% appreciation · 3.0% rent growth · sell at horizon
- IRR
- -35.2%
- Equity multiple
- -0.13×
- Total profit
- $-150,816
- Equity at exit
- $70,824
- IRR
- -47.3%
- Equity multiple
- -0.71×
- Total profit
- $-226,887
- Equity at exit
- $41,069
Cash invested: $133,000 (down + closing). Projections, not guarantees.
Landlord ↔ Tenant lean methodology
- Overall (STATE)
- 27 Tenant-Leaning
- State Maryland
- 27 Tenant-Leaning · D+14
- County
- — inherits STATE
- City
- — inherits STATE
ZIP-level market 21048
- Active inventory
- 36
- Price-to-rent
- 17.4×
Monthly cashflow live
- Estimated rent
- $2,270 medium interval (Pro) →
- Mortgage (P&I)
- −$2,491
- Tax from tax record
- −$261 /mo · $3,132/yr
- Insurance
- −$198
- HOA
- −$0
- Vacancy / Maint / Mgmt
- −$477
- Net cashflow
- $-1,157
Break-even live
UW: 25.0% down · 7.5% · 30yr · 1.5% tax · 5.0% vac · 8.0% maint · 8.0% mgmt
Financing live
Cash to close
- Down payment
- $118,750
- Closing costs
- $14,250
- Reserves months
- —
- Total cash needed
- —
Loan-product check · same deal, 3 products live
Conventional
25% down · 7.5% · 30yr
- Down + closing
- —
- Monthly P&I
- —
- Monthly cashflow
- —
- DSCR
- —
- Eligible?
- —
Personal DTI + credit; lowest rate.
DSCR
20% down · 8.5% · 30yr
- Down + closing
- —
- Monthly P&I
- —
- Monthly cashflow
- —
- DSCR
- —
- Eligible?
- —
No personal income docs; deal must DSCR.
Hard money
10% down · 12.0% · 12mo
- Down + closing
- —
- Monthly P&I
- —
- Monthly cashflow
- —
- DSCR
- —
- Eligible?
- —
Short-term bridge; refi at stabilization.
Listing history 9 events
-
2026-06-18days on market $475,000 Active 8 DOM
-
2026-06-17days on market $475,000 Active 7 DOM
-
2026-06-16days on market $475,000 Active 6 DOM
-
2026-06-15status $475,000 Active 5 DOM
-
2026-06-10status $475,000 Pending 5 DOM
-
2026-06-09days on market $475,000 Active 5 DOM
-
2026-06-08days on market $475,000 Active 4 DOM
-
2026-06-07remarks 699-char remark
-
2026-06-07$475,000 Active 3 DOM
ⓘ Source: listings_history table (triggers on properties + properties_extension) + one-shot
backfill from property_details.listing_events for pre-trigger history.
Tax reassessment forecast MD · Partial reset (capped growth)
- Current annual tax
- $3,132 · $261/mo
- Projected year-2 tax
- $4,155 · $346/mo
- Expected delta
- +$1,023/yr (+$85/mo · 32.6%)
ⓘ Screening estimate from a state-policy table — verify with the county assessor before closing.
Climate risk First Street
- Flood 1/10 Low FEMA zone X (unshaded) · 0% chance over 30 yrs
- Wildfire 3/10 Moderate
- Heat 5/10 Major 7 d/yr ≥104°F today · 15 d/yr by 30 yrs out
- Wind 4/10 Moderate 13% chance of damaging wind over 30 yrs
- Air quality 3/10 Moderate 2 unhealthy d/yr today · 3 by 30 yrs out
Nearby sold comps map
Loading sold comps map…
Walkable amenities ~0.75 mi
Loading nearby amenities…
Taxation est. · year 1
- Rental income
- $27,237
- − Mortgage interest
- −$26,607
- − Property taxes
- −$3,132
- − Insurance
- −$2,375
- − Repairs & maintenance
- −$2,179
- − Management
- −$2,179
- − Depreciation
- −$13,818
- Taxable loss
- −$23,053
- Est. tax savings @ 24.0%
- +$5,533
- After-tax cash flow
- $-8,348/yr
For passive investors: Depreciation is non-cash, so a rental often shows a tax loss while cash-flowing — sheltering income. Rental losses are passive: they offset passive income freely, and up to $25,000/yr can offset ordinary (W-2) income if you actively participate and your MAGI is under $100k (phasing out to $0 by $150k); unused losses carry forward. On sale, claimed depreciation is recaptured at up to 25%, and gains may owe capital-gains tax (a 1031 exchange can defer both). Figures are a year-1 estimate at your 24.0% rate — not tax advice; consult a CPA.
Schools (NCES district)
- District
- Carroll County Public Schools
- NCES district ID
- 2400210
- Math proficiency
- 32% ▼ -25.00%
- Reading proficiency
- 47% ▼ -16.00%
- Median HH income
- $84,594
- Composite
- 37.33/100
- National rank
- #4441
- State rank
- #2 of 24 in MD
Livability — Eldersburg
- Score
- 75/100
- State rank
- #103
- US rank
- #3957
Category grades
Schools grade is shown separately in the Schools card above.
Census & demographics
- City population
- 37,813
- Population (ZIP)
- 10,002
Population outlook (Carroll County) Hauer SSP2
- Today (2025)
- 169,677 people
- By 2030
- 169,605 · +-0.0%
- By 2040
- 166,205 · -2.0%
- By 2050
- 158,312 · -6.7%
- By 2075
- 143,013 · -15.7%
- By 2100
- 122,431 · -27.8%
Race, ethnicity, and origin ACS 2023
- Neighborhood character
- Predominantly White (86%)
- Race & ethnicity
- White 86% Asian 5% Two or more races 4% Black 4% Hispanic / Latino 3%
- Common ancestry
- Romanian 5% Slovak 4% Italian 3%
- Foreign-born
- 6% · Canada, China, Philippines
- Languages at home
- 94% English-only · Other Indo-European 1% Spanish 1% Other Asian/Pacific 1%
Political lean MEDSL · Carroll
- 2024 margin
- Strong R (+24.9) · D 36.2% · R 61.2% · Other 2.6%
- 2008→2024 swing
- +6.2pp toward D · 2008: -31.2pp · 2024: -24.9pp
- All cycles
- 2024: R+24.9 2020: R+23.7 2016: R+36.9 2012: R+34.0 2008: R+31.2
Not yet ingested
- Civics
- —
Market trends
- HPI YoY
- ▼ -204.28%
- Current HPI
- 276.108
- Rent YoY
- —
- Metro
- —
- State GDP YoY
- ▲ 2.97%
- F500 in state
- 12
Industry mix (Fortune 500 HQ in MD)
| Industry | F500 HQs | Revenue |
|---|---|---|
| Aerospace / Defense | 1 | $71B |
|
||
| Utilities | 1 | $25B |
|
||
| Hotels | 1 | $24B |
|
||
| Consumer Goods | 1 | $7B |
|
||
| Real Estate | 1 | $6B |
|
||
| Chemicals | 1 | $2B |
|
||
Price history
+111.1% since first listed7 events — show timeline
- 2026-06-04 Listed $475,000 BRIGHT MLS
- 2020-08-07 Sold (Public Records) $375,000 Public Records
- 2008-05-07 Delisted — MRIS
- 2007-11-20 Listed — MRIS
- 2007-10-30 Delisted — MRIS
- 2007-06-01 Listed — MRIS
- 2006-10-31 Sold (Public Records) $225,000 Public Records
Property tax history
+0.5%/yrLatest (2025): $3,132 · +5.4% YoY. Source: county tax records.
Cash-flow waterfall
monthlySold comps — $/sqft
last 12 mo · ≤1 miLoading sold comps…