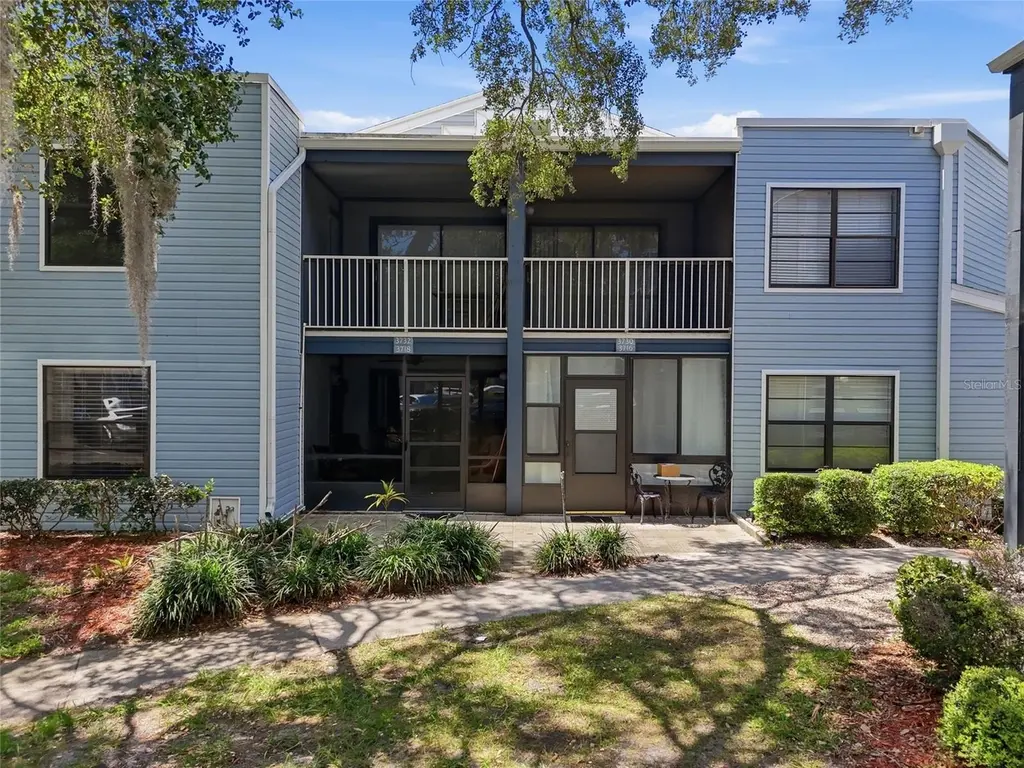
3940 Atrium Dr Unit L7 · Orlando, FL
Flood risk No data
- FEMA flood zone
- —
- Chance of flooding over 30 yrs
- —
- Est. flood insurance / yr
- —
Fire risk No data
- Est. fire insurance / yr
- —
Heat risk No data
- Hot days now (above threshold)
- —
- Hot days in 30 yrs
- —
Wind risk No data
- Chance of severe wind over 30 yrs
- —
Air-quality risk No data
- Unhealthy air days now
- —
- Unhealthy air days in 30 yrs
- —
Risk factors via First Street. Map © Google.
Why this score? — see what drove the D grade
The composite is a weighted blend of 9 inputs, each scored 0–100. Each bar is that input's sub-score; the figure is the points it added to the 100-point composite (weight × sub-score).
- Cash flow +13.0/30.0
- ARV discount +7.5/15.0
- 1% rule +6.2/10.0
- Livability +4.3/5.0
- Schools +4.1/10.0
- DSCR +3.9/10.0
- Condition / age +2.5/5.0
- Rent growth +2.3/5.0
- Appreciation +0.0/10.0
$155,000
🖨 Deal sheet (PDF) 📄 Offer letter ✓ Due diligence
Listing remarks
Southpointe IN VENTURA COUNTRY CLUB! GATED GOLF COURSE COMMUNITY! This FIRST FLOOR 2-bedroom, 2-bath condo offers comfort, style, and convenience. The well-appointed kitchen features ample cabinetry, appliances, and updated granite countertops with a seamless flow into the dining and living areas. Additional upgrades include updated bathroom countertops and sinks, laminate flooring throughout, and NO CARPET! The primary suite offers a relaxing retreat with generous closet space and a private bath, while the additional bedroom provides flexibility for guests, a home office, or growing needs. Enjoy added privacy from the screened-in room overlooking a peaceful, private rear setting with no i
Key facts
- Private rear setting
- Screened-in room
- $464 HOA
Tags
Property features AI
Finance
- Other: Homestead exemption: yes; Property subtype: Residential - Condominium; Zoning: PD/AN; Community features: golf carts OK
- Financial info: Total monthly fees: $464; Total annual fees: $5,568; Lease restrictions apply
- HOA & community: Monthly HOA fee: $189; Monthly condo fee: $275; HOA required; Association amenities include clubhouse, fitness center, pool, spa/hot tub, tennis courts, basketball court, shuffleboard court, playground, park, trails, golf, racquetball, sidewalks, street lights, management, maintenance of grounds and structure, pest control, sewer, trash, water, insurance, reserves; Pets allowed (maximum 40 lbs)
Exterior
- Parking: Golf carts allowed (community); Vehicle restrictions (per association)
- Security: Gated community; Security gate; Smoke detectors
- Utilities: Public water; Public sewer; Electricity connected; Underground utilities; BB/HS internet available; Water connected; Boats allowed under 5 hp (lake access)
- Home design: Condominium; Two-story building; Faces northeast
- Construction: Other construction materials; Shingle roof; Slab foundation; Built as part of building number 35
- Exterior features: Covered patio; Patio; Rear porch; Screened porch; Sidewalk; Sliding doors; Mature landscaping; Trees/landscaped; Conservation area nearby; Near golf course; Paved roads
Interior
- Kitchen: Dishwasher; Range; Microwave; Refrigerator
- Bedrooms: 2 bedrooms
- Flooring: Ceramic tile; Laminate
- Bathrooms: 2 full bathrooms
- Heating & cooling: Electric heating; Central air
- Interior features: Ceiling fans; Living room/dining room combo; Thermostat; Walk-in closet(s); Blinds
- Laundry & utility: Washer; Dryer; Inside laundry closet
Neighborhood map
What this means for you Summary
Snapshot
- This is a 2-bed/2.0-bath condo listed at $155k.
Deal economics
- At list price, monthly cash flow is $-10 ($-116/yr) — negative.
- To cash-flow at today's rent, offer at most $153k (1.1% below list).
- Meets the 1% rule at list price ($2k rent vs $155k).
- Recommended offer: $153k (1.5% below list) — sets the bar for market timing.
- Cap rate 6.2% vs local median 3.0% in Orlando — top-decile yield for the area; either an underpriced asset or a hidden risk that comps aren't pricing in. Stress-test before assuming the spread holds.
Location & tenants
- Location reads 86/100 on livability (#12 in FL, #360 nationally) — a professional / high-income tenant draw. Strengths: amenities A+, commute A+, housing A+.
- Orange (suburban): math 46% / reading 51% proficiency, ranked #43 of 73 in FL (top 59%) — families likely to look elsewhere, expect single-tenant / working-renter base with shorter leases.
- Zoned schools: Ventura Elementary (math 26% / reading 34%, grade F, #1,882 of 2,144 statewide, top 88%, 596 students, 66% FRL); Roberto Clemente Middle (math 31% / reading 36%, grade F, #428 of 571 statewide, top 76%, 951 students, 63% FRL); Colonial High (math 16% / reading 33%, grade F, #505 of 667 statewide, top 79%, 3,442 students, 62% FRL).
- Zoned-school proficiency averages 29% at this address vs 48% district-wide (-19 pts) — the specific schools serving this property underperform the Orange average; the district grade overstates school quality for this exact location.
- Market conditions: Rents soft (-0.7%/yr); 379 active listings in the ZIP; 40 comparable units currently listed for rent nearby; rentals at typical pace (median 17d on market — plan ~3-4 weeks tenant-placement turnaround); 8,053 units permitted in Orange County in 2024 (3,133 in 5+ unit buildings).
- This rent runs 37% of the median local income ($57k/yr) — at the standard rent-burdened threshold; future hikes will face affordability resistance.
Forward outlook
- Local home prices are declining (-3.0%/yr); year-one equity from $1k of loan paydown is wiped out by about $5k of value loss. Plan a longer hold.
- Orange County population projected at +52% by 2050 — long-run rental-demand tailwind backs the buy-and-hold thesis.
Negotiation context
- It's been on market 30 days — a 2% lower offer ($153k) is reasonable based on typical stale-listing flexibility.
- 2 sale attempts with the ask held roughly flat each time — persistent listings suggest the price (not the market) is what's stuck; bring a comps-based counter.
- Current owner paid $92k; list at $155k implies a 68% gain — meaningful room to come down on a strong offer.
Risks & watch-outs
- Watch-outs: HOA is 27% of rent.
Questions for the listing agent
- What do current leases actually rent for vs. the listed asking? Can we see a recent rent roll and the last 12 months of T-12 income?
- What does the HOA fee cover, when was the last increase, and are there any pending special assessments or reserve-fund shortfalls?
- Any open or pending special assessments — roof, HVAC, plumbing, elevator, façade? What's the per-unit balance and payoff schedule, and is the seller paying it off at close or rolling it to the buyer?
- Is there a deadline driving the sale (1031 exchange, divorce, estate, relocation)? That informs how much negotiation room exists.
- Schools are B-rated — typically a magnet for longer-tenancy family renters. What's the average tenant stay here, and is there a school-zone premium baked into asking?
- The area grade is low — what's the realistic commute time and amenity access for the typical tenant pool here? Any planned neighborhood developments (good or bad) we should know about?
- What's the average days-on-market for RENTAL listings here right now (not sales)? A rising rental-DOM trend means longer vacancies and softer asking-rent achievability than the comps imply.
- What's the recent tenant-quality profile in this submarket — average credit score on applications, eviction rate, late-payment / NSF rate, and stable-employment percentage? A property-management company in the area should have these aggregated.
- How much new apartment / multifamily construction is in the pipeline within 1–3 miles? Heavy new supply (>2% of stock underway) typically softens rents 12–24 months out; light construction supports rent growth.
Investment metrics
- 1% rule
- 1.12% ✓
- Cap rate
- 6.22%
- Cash-on-cash
- -0.27%
- DSCR
- 0.99
- GRM
- 7.4
CMA / ARV
No comps found within radius.
Projected returns pro-forma
-3.0% appreciation · 0.0% rent growth · sell at horizon
- IRR
- -21.0%
- Equity multiple
- 0.29×
- Total profit
- $-30,612
- Equity at exit
- $23,111
- IRR
- -27.5%
- Equity multiple
- -0.07×
- Total profit
- $-46,265
- Equity at exit
- $13,402
Cash invested: $43,400 (down + closing). Projections, not guarantees.
Landlord ↔ Tenant lean methodology
- Overall (STATE)
- 87 Strongly Landlord-Friendly
- State Florida
- 87 Strongly Landlord-Friendly · R+3
- County
- — inherits STATE
- City
- — inherits STATE
ZIP-level market 32822
- Home prices YoY
- -21.1%
- Rents YoY
- -0.7%
- Active inventory
- 379
- Price-to-rent
- 7.4×
Monthly cashflow live
- Estimated rent
- $1,740 high interval (Pro) →
- Mortgage (P&I)
- −$813
- Tax from tax record
- −$43 /mo · $513/yr
- Insurance
- −$65
- HOA
- −$464
- Vacancy / Maint / Mgmt
- −$365
- Net cashflow
- $-10
Break-even live
Sensitivity live
| Price | -10% $78 | -5% $34 | +0% $-10 | +5% $-54 | +10% $-97 |
|---|---|---|---|---|---|
| Rent | -10% $-147 | -5% $-78 | +0% $-10 | +5% $59 | +10% $128 |
| Rate | -1.0pp $68 | -0.5pp $30 | base $-10 | +0.5pp $-50 | +1.0pp $-91 |
UW: 25.0% down · 7.5% · 30yr · 1.5% tax · 5.0% vac · 8.0% maint · 8.0% mgmt
Financing live
Cash to close
- Down payment
- $38,750
- Closing costs
- $4,650
- Reserves months
- —
- Total cash needed
- —
Loan-product check · same deal, 3 products live
Conventional
25% down · 7.5% · 30yr
- Down + closing
- —
- Monthly P&I
- —
- Monthly cashflow
- —
- DSCR
- —
- Eligible?
- —
Personal DTI + credit; lowest rate.
DSCR
20% down · 8.5% · 30yr
- Down + closing
- —
- Monthly P&I
- —
- Monthly cashflow
- —
- DSCR
- —
- Eligible?
- —
No personal income docs; deal must DSCR.
Hard money
10% down · 12.0% · 12mo
- Down + closing
- —
- Monthly P&I
- —
- Monthly cashflow
- —
- DSCR
- —
- Eligible?
- —
Short-term bridge; refi at stabilization.
Rent comps 40 comps
| Address | Beds | Baths | Sqft | Rent | $/sqft | DOM | Units | Dist |
|---|---|---|---|---|---|---|---|---|
| 4004 Atrium Dr Orlando, FL | 2.0 | 2.0 | 820 | $1,495 | $1.82 | 25d | 1 | 0.02mi |
| 3841 Atrium Dr Unit 1564828P Orlando, FL | 2.0 | 2.0 | 818 | $2,505 | $3.06 | 4d | 1 | 0.04mi |
| 3841 Atrium Dr Unit 1271266P Orlando, FL | 2.0 | 2.0 | 818 | $2,468 | $3.02 | 14d | 1 | 0.04mi |
| 3766 Southpointe Dr Unit U5 Orlando, FL | 2.0 | 2.0 | 820 | $2,049 | $2.50 | 9d | 1 | 0.07mi |
| 3524 Southpointe Dr Bldg 2 Orlando, FL | 2.0 | 2.0 | 820 | $1,575 | $1.92 | 23d | 1 | 0.11mi |
| 3638 Southpointe Dr Unit 1 Orlando, FL | 2.0 | 2.0 | 820 | $1,600 | $1.95 | 25d | 1 | 0.12mi |
| 3960 Southpointe Dr #533 Orlando, FL | 2.0 | 2.0 | 1045 | $1,800 | $1.72 | 9d | 1 | 0.12mi |
| 3912 Atrium Dr Unit L7 Orlando, FL | 2.0 | 2.0 | 820 | $1,700 | $2.07 | 22d | 1 | 0.12mi |
| 3642 Southpointe Dr Orlando, FL | 2.0 | 2.0 | 840 | $2,200 | $2.62 | 0d | 1 | 0.16mi |
| 3655 Atrium Dr Unit 2 Orlando, FL | 2.0 | 2.0 | 820 | $1,695 | $2.07 | 16d | 1 | 0.16mi |
| 6154 Burnside Cir Orlando, FL | 2.0 | 2.0 | 914 | $1,750 | $1.91 | 0d | 1 | 0.24mi |
| 4124 Pershing Pointe Pl Orlando, FL | 2.0 | 2.0 | 1006 | $1,425 | $1.42 | 4d | 1 | 0.31mi |
| 6084 Willowpointe Cir Unit 1501435P Orlando, FL | 2.0 | 2.0 | 904 | $3,413 | $3.78 | 0d | 1 | 0.32mi |
| 4136 Pershing Pointe Pl #4 Orlando, FL | 2.0 | 2.0 | 1006 | $1,600 | $1.59 | 0d | 1 | 0.33mi |
| 4148 Pershing Pointe Pl Unit PA4148-1 Orlando, FL | 2.0 | 2.0 | 1006 | $1,275 | $1.27 | 25d | 1 | 0.34mi |
| 4148 Pershing Pointe Pl #1 Orlando, FL | 2.0 | 2.0 | 1006 | $1,275 | $1.27 | 16d | 1 | 0.34mi |
| 4148 Pershing Pointe Pl #1 Orlando, FL | 2.0 | 2.0 | 1006 | $1,275 | $1.27 | 16d | 1 | 0.34mi |
| 4155 S Semoran Blvd #3 Orlando, FL | 1.0 | 1.5 | 765 | $1,300 | $1.70 | 23d | 1 | 0.37mi |
| 4240 Pershing Pointe Pl #2 Orlando, FL | 2.0 | 2.0 | 1006 | $1,500 | $1.49 | 12d | 1 | 0.38mi |
| 4252 Pershing Pointe Pl #4 Orlando, FL | 2.0 | 2.0 | 1006 | $1,650 | $1.64 | 25d | 1 | 0.39mi |
| 4269 S Semoran Blvd #2 Orlando, FL | 2.0 | 2.0 | 1125 | $1,595 | $1.42 | 25d | 1 | 0.40mi |
| 4314 Pershing Pointe Pl #7 Orlando, FL | 2.0 | 2.0 | 1006 | $1,500 | $1.49 | 23d | 1 | 0.43mi |
| 4113 S Semoran Blvd Orlando, FL | 1.0 | 1.5 | 765 | $1,245 | $1.63 | 25d | 1 | 0.45mi |
| 4113 S Semoran Blvd Orlando, FL | 1.0 | 1.5 | 765 | $1,222 | $1.60 | 9d | 2 | 0.45mi |
| 4151 S Semoran Blvd #11 Orlando, FL | 1.0 | 1.0 | 838 | $1,200 | $1.43 | 22d | 1 | 0.46mi |
| 3239 Candle Ridge Dr Orlando, FL | 2.0 | 2.0 | 914 | $2,100 | $2.30 | 25d | 1 | 0.46mi |
| 3233 Candle Ridge Dr #101 Orlando, FL | 2.0 | 2.0 | 914 | $1,600 | $1.75 | 9d | 1 | 0.46mi |
| 4149 S Semoran Blvd Orlando, FL | 1.0 | 1.5 | 772 | $1,238 | $1.60 | 22d | 2 | 0.48mi |
| 3217 Westridge Blvd Orlando, FL | 2.0 | 2.0 | 914 | $1,800 | $1.97 | 16d | 1 | 0.49mi |
| 5757 5 Flags Blvd Orlando, FL | 1.0–2.0 | 1.0–2.0 | 660 | $1,499 | $2.27 | 12d | 9 | 0.49mi |
| 4572 Commander Dr Orlando, FL | 1.0 | 1.0 | 735 | $1,212 | $1.65 | 4d | 1 | 0.53mi |
| 5974 Lake Pointe Village Cir Orlando, FL | 2.0 | 2.0 | 1058 | $1,735 | $1.64 | 23d | 1 | 0.53mi |
| 5975 Lake Pointe Village Cir Orlando, FL | 2.0–3.0 | 2.0–2.5 | 1236 | $1,735 | $1.40 | 0d | 13 | 0.55mi |
| 4548 Commander Dr Orlando, FL | 2.0 | 1.0 | 934 | $1,500 | $1.61 | 25d | 1 | 0.56mi |
| 4560 Commander Dr Orlando, FL | 1.0 | 1.0 | 735 | $1,250 | $1.70 | 25d | 1 | 0.56mi |
| 4536 Commander Dr #1517 Orlando, FL | 2.0 | 2.0 | 1054 | $1,595 | $1.51 | 16d | 1 | 0.58mi |
| 4630 Commander Dr Orlando, FL | 1.0–2.0 | 1.0–2.0 | 894 | $1,750 | $1.96 | 12d | 3 | 0.60mi |
| 3049 Jon Jon Ct Orlando, FL | 3.0 | 2.0 | 1050 | $1,995 | $1.90 | 25d | 1 | 0.61mi |
| 4512 Commander Dr #1736 Orlando, FL | 2.0 | 1.0 | 934 | $1,350 | $1.45 | 23d | 1 | 0.62mi |
| 4532 Commander Dr #2131 Orlando, FL | 2.0 | 2.0 | 1054 | $1,450 | $1.38 | 5d | 1 | 0.63mi |
HOA detail condo
- Monthly dues
- $464 · $5,568/yr
- Likely covers
- security
- Assessments
- None detected in remarks — confirm with the listing agent.
Listing history 22 events
-
2026-06-21days on market $155,000 Active 30 DOM
-
2026-06-18days on market $155,000 Active 27 DOM
-
2026-06-17days on market $155,000 Active 26 DOM
-
2026-06-16days on market $155,000 Active 25 DOM
-
2026-06-15days on market $155,000 Active 24 DOM
-
2026-06-13days on market $155,000 Active 22 DOM
-
2026-06-13days on market $155,000 Active 21 DOM
-
2026-06-09days on market $155,000 Active 18 DOM
-
2026-06-08days on market $155,000 Active 17 DOM
-
2026-06-07days on market $155,000 Active 16 DOM
-
2026-06-04days on market $155,000 Active 13 DOM
-
2026-06-03days on market $155,000 Active 12 DOM
-
2026-06-02days on market $155,000 Active 11 DOM
-
2026-06-01days on market $155,000 Active 10 DOM
-
2026-05-31days on market $155,000 Active 9 DOM
-
2026-05-22$155,000 Active
-
2026-01-11$159,900 Active
-
2018-01-08soldstatus $92,000
-
2005-10-31soldstatus $145,000
-
2004-05-28soldstatus $75,000
-
1999-12-02soldstatus $44,500
-
1991-01-01soldstatus $53,000
ⓘ Source: listings_history table (triggers on properties + properties_extension) + one-shot
backfill from property_details.listing_events for pre-trigger history.
Tax reassessment forecast FL · Resets to sale price
- Current annual tax
- $513 · $43/mo
- Projected year-2 tax
- $1,286 · $107/mo
- Expected delta
- +$773/yr (+$64/mo · 150.7%)
ⓘ Screening estimate from a state-policy table — verify with the county assessor before closing.
Nearby sold comps map
Loading sold comps map…
Walkable amenities ~0.75 mi
Loading nearby amenities…
Taxation est. · year 1
- Rental income
- $20,879
- − Mortgage interest
- −$8,682
- − Property taxes
- −$513
- − Insurance
- −$775
- − Repairs & maintenance
- −$1,670
- − Management
- −$1,670
- − HOA
- −$5,568
- − Depreciation
- −$4,509
- Taxable loss
- −$2,509
- Est. tax savings @ 24.0%
- +$602
- After-tax cash flow
- $486/yr
For passive investors: Depreciation is non-cash, so a rental often shows a tax loss while cash-flowing — sheltering income. Rental losses are passive: they offset passive income freely, and up to $25,000/yr can offset ordinary (W-2) income if you actively participate and your MAGI is under $100k (phasing out to $0 by $150k); unused losses carry forward. On sale, claimed depreciation is recaptured at up to 25%, and gains may owe capital-gains tax (a 1031 exchange can defer both). Figures are a year-1 estimate at your 24.0% rate — not tax advice; consult a CPA.
Schools (NCES district)
- District
- Orange
- NCES district ID
- 1201440
- Math proficiency
- 46% ▼ -9.00%
- Reading proficiency
- 51% ▼ -2.00%
- Median HH income
- $49,350
- Composite
- 41.47/100
- National rank
- #3461
- State rank
- #43 of 73 in FL
Livability — Orlando
- Score
- 86/100
- State rank
- #12
- US rank
- #360
Category grades
Schools grade is shown separately in the Schools card above.
Census & demographics
- Census place
- Orlando, FL
- County
- Orange County · 1,471,359 people
- City population
- 964,969
- Metro
- Orlando-Kissimmee-Sanford, FL
- Population (ZIP)
- 67,081
- Household income
- $56,540
- Rent vs Own
- Severe rent burden
- 4246.0
Population outlook (Orange County) Hauer SSP2
- Today (2025)
- 1,618,226 people
- By 2030
- 1,787,404 · +10.5%
- By 2040
- 2,125,621 · +31.4%
- By 2050
- 2,454,016 · +51.6%
- By 2075
- 3,173,711 · +96.1%
- By 2100
- 3,607,781 · +122.9%
Race, ethnicity, and origin ACS 2023
- Neighborhood character
- Predominantly Hispanic (68%)
- Race & ethnicity
- Hispanic / Latino 68% Two or more races 36% White 17% Black 10% Asian 2%
- Hispanic origin (detail)
- Mexican 2% Puerto Rican 38% Cuban 5% Dominican 5%
- Common ancestry
- Lithuanian 1% Romanian 1% Slovak 1%
- Foreign-born
- 27% · Canada, Jamaica, China
- Languages at home
- 36% English-only · Spanish 60% French/Haitian/Cajun 1% Arabic 1%
Political lean MEDSL · Orange
- 2024 margin
- D (+13.6) · D 56.1% · R 42.5% · Other 1.3%
- 2008→2024 swing
- -5.0pp toward R · 2008: 18.6pp · 2024: 13.6pp
- All cycles
- 2024: D+13.6 2020: D+23.1 2016: D+24.6 2012: D+18.2 2008: D+18.6
Not yet ingested
- Civics
- —
Market trends
- HPI YoY
- ▼ -95.17%
- Current HPI
- 355.5775
- Rent YoY
- ▼ -0.68%
- Metro
- Orlando-Kissimmee-Sanford, FL
- State GDP YoY
- ▲ 3.28%
- F500 in state
- 36
Industry mix (Fortune 500 HQ in FL)
| Industry | F500 HQs | Revenue |
|---|---|---|
| Industrial Technology | 2 | $29B |
|
||
| Insurance | 2 | $17B |
|
||
| Retail | 1 | $60B |
|
||
| Technology Distribution | 1 | $58B |
|
||
| Homebuilding | 1 | $35B |
|
||
| Technology Manufacturing | 1 | $35B |
|
||
Price history
+192.5% since first listed7 events — show timeline
- 2026-05-22 Listed $155,000 Stellar MLS as Distributed by MLS Grid
- 2026-01-11 Listed $159,900 Stellar MLS as Distributed by MLS Grid
- 2018-01-08 Sold (Public Records) $92,000 Public Records
- 2005-10-31 Sold (Public Records) $145,000 Public Records
- 2004-05-28 Sold (Public Records) $75,000 Public Records
- 1999-12-02 Sold (Public Records) $44,500 Public Records
- 1991-01-01 Sold (Public Records) $53,000 Public Records
Property tax history
-3.1%/yrLatest (2025): $513 · +7.4% YoY. Source: county tax records.
Cash-flow waterfall
monthlySold comps — $/sqft
last 12 mo · ≤1 miLoading sold comps…