 Multi-family
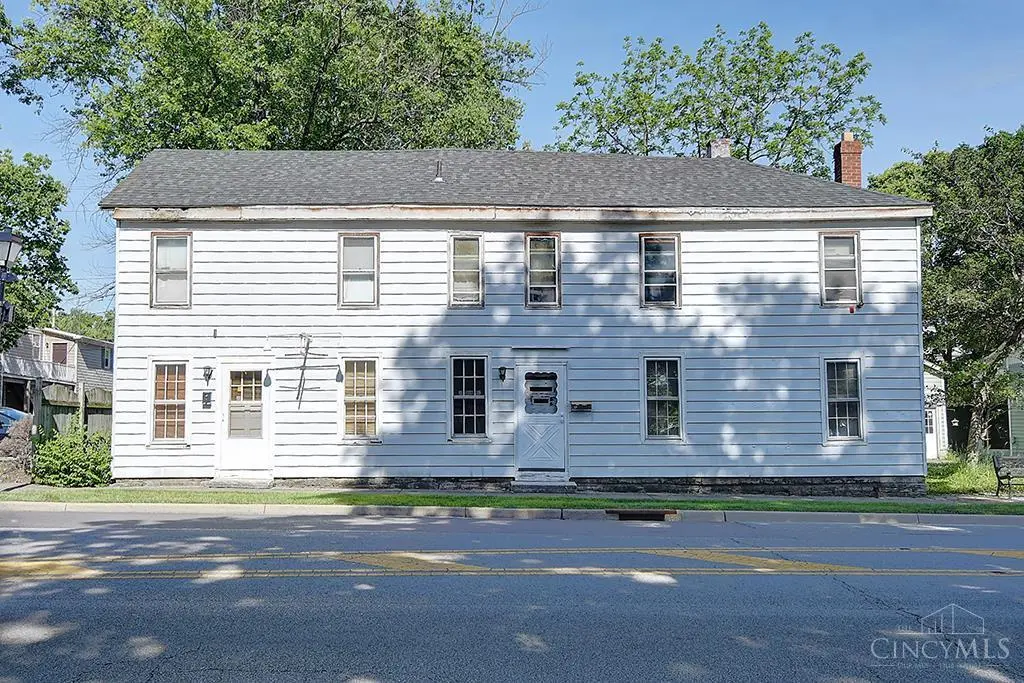
40 S Main St · Springboro, OH
Flood risk No data
- FEMA flood zone
- —
- Chance of flooding over 30 yrs
- —
- Est. flood insurance / yr
- —
Fire risk No data
- Est. fire insurance / yr
- —
Heat risk No data
- Hot days now (above threshold)
- —
- Hot days in 30 yrs
- —
Wind risk No data
- Chance of severe wind over 30 yrs
- —
Air-quality risk No data
- Unhealthy air days now
- —
- Unhealthy air days in 30 yrs
- —
Risk factors via First Street. Map © Google.
Why this score? — see what drove the B grade
The composite is a weighted blend of 9 inputs, each scored 0–100. Each bar is that input's sub-score; the figure is the points it added to the 100-point composite (weight × sub-score).
- Cash flow +30.0/30.0
- DSCR +10.0/10.0
- 1% rule +8.6/10.0
- ARV discount +7.5/15.0
- Schools +7.1/10.0
- Livability +4.0/5.0
- Rent growth +2.5/5.0
- Condition / age +2.5/5.0
- Appreciation +0.0/10.0
$300,000
🖨 Deal sheet 📄 Offer letter ✓ Due diligence
Multi-family units
County records classify this as Multi-Family (2-4 Unit). Listing-text estimate: 1 unit. estimate disagrees with records
Listing remarks MLS
Unique investment opportunity in the heart of Springboro downtown district! Formerly operated as a hotel, this property is currently configured and used as a multifamily investment property with excellent income and expansion potential. The property currently features two functioning units with the possibility for four additional units, offering a rare opportunity for investors looking to maximize value and future cash flow. Situated in a highly desirable location near downtown amenities, shops, restaurants, and entertainment, this property offers endless possibilities for redevelopment, renovation, or long-term investment. One unit was recently vacated, providing added flexibility for future plans. Offered at $300,000.
Key facts
- Downtown amenities
- Functioning units
- Additional units
Tags
Property features AI
Finance
- Other: Total buildings on site: 1
- Financial info: Semi-annual taxes reported
Exterior
- Parking: Public parking
- Utilities: Public water; Public sewer; Natural gas
- Home design: Duplex; Two-story; Slab foundation
- Construction: Shingle roof; Other construction materials
- Exterior features: Aluminum windows; Lot roughly 0.17 acres
Interior
- Bedrooms: Unit 1: 2 bedrooms; Two 2-bedroom units total
- Bathrooms: Unit 1: 1 full bathroom
- Heating & cooling: Forced air heating
- Interior features: Duplex structure; Two levels
Neighborhood map
What this means for you Summary
Snapshot
- This is a 3-bed/2.5-bath multifamily listed at $300k.
Deal economics
- At list price, monthly cash flow is $1k ($16k/yr) — positive.
- The deal already cash-flows at list — no discount required.
- Meets the 1% rule at list price ($4k rent vs $300k).
- Recommended offer: $296k (1.5% below list) — sets the bar for market timing.
- Cap rate 11.8% vs local median 3.0% in Springboro — top-decile yield for the area; either an underpriced asset or a hidden risk that comps aren't pricing in. Stress-test before assuming the spread holds.
Location & tenants
- Location reads 81/100 on livability (#93 in OH, #1,395 nationally) — a professional / high-income tenant draw. Strengths: schools A+, crime A+, employment A+; Watch: health & safety C-, amenities F, commute F.
- Springboro Community City (rural): math 77% / reading 79% proficiency, ranked #42 of 656 in OH (top 6%) — strong family-tenant draw, lease renewals of 3-5y typical; only 7% free/reduced lunch — higher-income household profile.
- Market conditions: 214 active listings in the ZIP; 1 comparable units currently listed for rent nearby; high-income renter base; 1,224 units permitted in Warren County in 2024 (474 in 5+ unit buildings).
- This rent runs 37% of the median local income ($131k/yr) — at the standard rent-burdened threshold; future hikes will face affordability resistance.
Forward outlook
- Local home prices are declining (-3.0%/yr); year-one equity from $2k of loan paydown is wiped out by about $9k of value loss. Plan a longer hold.
- Warren County population projected at +16% by 2050 — long-run rental-demand tailwind backs the buy-and-hold thesis.
- At projected returns (-3.0% appreciation + 3.0% rent growth), your $84k cash investment doubles in ~7 years — after that, you're playing with house money.
Negotiation context
- It's been on market 20 days — a 2% lower offer ($296k) is reasonable based on typical stale-listing flexibility.
- 3 sale attempts with the ask held roughly flat each time — persistent listings suggest the price (not the market) is what's stuck; bring a comps-based counter.
Risks & watch-outs
- Watch-outs: built in 1837 — expect roof / HVAC / electrical / plumbing capex.
Questions for the listing agent
- Built in 1837 — when were the roof, HVAC, electrical panel, plumbing, and water heater last replaced?
- Is there a deadline driving the sale (1031 exchange, divorce, estate, relocation)? That informs how much negotiation room exists.
- Schools are A-rated — typically a magnet for longer-tenancy family renters. What's the average tenant stay here, and is there a school-zone premium baked into asking?
- What's the average days-on-market for RENTAL listings here right now (not sales)? A rising rental-DOM trend means longer vacancies and softer asking-rent achievability than the comps imply.
- What's the recent tenant-quality profile in this submarket — average credit score on applications, eviction rate, late-payment / NSF rate, and stable-employment percentage? A property-management company in the area should have these aggregated.
- How much new apartment / multifamily construction is in the pipeline within 1–3 miles? Heavy new supply (>2% of stock underway) typically softens rents 12–24 months out; light construction supports rent growth.
Investment metrics
- 1% rule
- 1.36% ✓
- Cap rate
- 11.79%
- Cash-on-cash
- 19.62%
- DSCR
- 1.87
- GRM
- 6.1
CMA / ARV
No comps found within radius.
Projected returns pro-forma
-3.0% appreciation · 3.0% rent growth · sell at horizon
- IRR
- 11.6%
- Equity multiple
- 1.46×
- Total profit
- $38,807
- Equity at exit
- $44,731
- IRR
- 20.6%
- Equity multiple
- 2.74×
- Total profit
- $146,151
- Equity at exit
- $25,939
Cash invested: $84,000 (down + closing). Projections, not guarantees.
Landlord ↔ Tenant lean methodology
- Overall (STATE)
- 73 Landlord-Friendly
- State Ohio
- 73 Landlord-Friendly · R+6
- County
- — inherits STATE
- City
- — inherits STATE
ZIP-level market 45066
- Active inventory
- 214
- Price-to-rent
- 12.2×
Monthly cashflow live
- Estimated rent
- $4,082 medium interval (Pro) →
- Mortgage (P&I)
- −$1,573
- Tax from tax record
- −$153 /mo · $1,834/yr
- Insurance
- −$125
- HOA
- −$0
- Vacancy / Maint / Mgmt
- −$857
- Net cashflow
- $1,374
Break-even live
2-unit breakdown (identical units grouped — click to expand)
| Units | Beds | Baths | Est. rent |
|---|---|---|---|
| 2× units | 2 | 1 | $4,082 |
| #1 | 2 | 1 | $2,041 |
| #2 | 2 | 1 | $2,041 |
| Total (2 units) | $4,082 | ||
UW: 25.0% down · 7.5% · 30yr · 1.5% tax · 5.0% vac · 8.0% maint · 8.0% mgmt
Financing live
Cash to close
- Down payment
- $75,000
- Closing costs
- $9,000
- Reserves months
- —
- Total cash needed
- —
Loan-product check · same deal, 3 products live
Conventional
25% down · 7.5% · 30yr
- Down + closing
- —
- Monthly P&I
- —
- Monthly cashflow
- —
- DSCR
- —
- Eligible?
- —
Personal DTI + credit; lowest rate.
DSCR
20% down · 8.5% · 30yr
- Down + closing
- —
- Monthly P&I
- —
- Monthly cashflow
- —
- DSCR
- —
- Eligible?
- —
No personal income docs; deal must DSCR.
Hard money
10% down · 12.0% · 12mo
- Down + closing
- —
- Monthly P&I
- —
- Monthly cashflow
- —
- DSCR
- —
- Eligible?
- —
Short-term bridge; refi at stabilization.
Rent comps 1 comps
| Address | Beds | Baths | Sqft | Rent | $/sqft | DOM | Units | Dist |
|---|---|---|---|---|---|---|---|---|
| 174 Farmridge Rd Springboro, OH | 4.0 | 3.5 | 2442 | $2,850 | $1.17 | 20d | 1 | 0.75mi |
Listing history 16 events
-
2026-06-18days on market $300,000 Active 20 DOM
-
2026-06-17days on market $300,000 Active 19 DOM
-
2026-06-16days on market $300,000 Active 18 DOM
-
2026-06-15days on market $300,000 Active 17 DOM
-
2026-06-13days on market $300,000 Active 15 DOM
-
2026-06-09days on market $300,000 Active 11 DOM
-
2026-06-08days on market $300,000 Active 10 DOM
-
2026-06-07days on market $300,000 Active 9 DOM
-
2026-06-03days on market $300,000 Active 5 DOM
-
2026-06-02days on market $300,000 Active 4 DOM
-
2026-06-01days on market $300,000 Active 3 DOM
-
2026-05-31days on market $300,000 Active 2 DOM
-
2026-05-29status Active
-
2026-05-29historical
-
2026-05-28$300,000 Active
Show marketing remark (729 chars)
Unique investment opportunity in the heart of Springboro downtown district! Formerly operated as a hotel, this property is currently configured and used as a multifamily investment property with excellent income and expansion potential. The property currently features two functioning units with the possibility for four additional units, offering a rare opportunity for investors looking to maximize value and future cash flow. Situated in a highly desirable location near downtown amenities, shops, restaurants, and entertainment, this property offers endless possibilities for redevelopment, renovation, or long-term investment. One unit was recently vacated, providing added flexibility for future plans. Offered at $300,000.
-
2026-05-28$300,000 Active 729-char remark
Show marketing remark (729 chars)
Unique investment opportunity in the heart of Springboro downtown district! Formerly operated as a hotel, this property is currently configured and used as a multifamily investment property with excellent income and expansion potential. The property currently features two functioning units with the possibility for four additional units, offering a rare opportunity for investors looking to maximize value and future cash flow. Situated in a highly desirable location near downtown amenities, shops, restaurants, and entertainment, this property offers endless possibilities for redevelopment, renovation, or long-term investment. One unit was recently vacated, providing added flexibility for future plans. Offered at $300,000.
ⓘ Source: listings_history table (triggers on properties + properties_extension) + one-shot
backfill from property_details.listing_events for pre-trigger history.
Tax reassessment forecast OH · Partial reset (capped growth)
- Current annual tax
- $1,834 · $153/mo
- Projected year-2 tax
- $3,257 · $271/mo
- Expected delta
- +$1,423/yr (+$119/mo · 77.6%)
ⓘ Screening estimate from a state-policy table — verify with the county assessor before closing.
Nearby sold comps map
Loading sold comps map…
Walkable amenities ~0.75 mi
Loading nearby amenities…
Taxation est. · year 1
- Rental income
- $48,984
- − Mortgage interest
- −$16,805
- − Property taxes
- −$1,834
- − Insurance
- −$1,500
- − Repairs & maintenance
- −$3,919
- − Management
- −$3,919
- − Depreciation
- −$8,727
- Taxable income
- $12,281
- Est. tax owed @ 24.0%
- −$2,947
- After-tax cash flow
- $13,537/yr
For passive investors: Depreciation is non-cash, so a rental often shows a tax loss while cash-flowing — sheltering income. Rental losses are passive: they offset passive income freely, and up to $25,000/yr can offset ordinary (W-2) income if you actively participate and your MAGI is under $100k (phasing out to $0 by $150k); unused losses carry forward. On sale, claimed depreciation is recaptured at up to 25%, and gains may owe capital-gains tax (a 1031 exchange can defer both). Figures are a year-1 estimate at your 24.0% rate — not tax advice; consult a CPA.
Schools (NCES district)
- District
- Springboro Community City
- NCES district ID
- 3905042
- Math proficiency
- 77% ▼ -6.00%
- Reading proficiency
- 79% ▼ -3.00%
- Median HH income
- $101,069
- Composite
- 70.88/100
- National rank
- #247
- State rank
- #42 of 656 in OH
Livability — Springboro
- Score
- 81/100
- State rank
- #93
- US rank
- #1395
Category grades
Schools grade is shown separately in the Schools card above.
Census & demographics
- Census place
- Springboro, OH
- County
- Warren County · 196,906 people
- City population
- 27,545
- Metro
- Cincinnati, OH-KY-IN
- Population (ZIP)
- 27,545
- Household income
- $131,250
- Rent vs Own
- Severe rent burden
- 139.0
Population outlook (Warren County) Hauer SSP2
- Today (2025)
- 248,603 people
- By 2030
- 259,345 · +4.3%
- By 2040
- 277,666 · +11.7%
- By 2050
- 289,599 · +16.5%
- By 2075
- 311,681 · +25.4%
- By 2100
- 302,738 · +21.8%
Race, ethnicity, and origin ACS 2023
- Neighborhood character
- Predominantly White (86%)
- Race & ethnicity
- White 86% Hispanic / Latino 4% Two or more races 4% Asian 3% Black 2%
- Common ancestry
- Romanian 5% Slovak 3% Lithuanian 2%
- Foreign-born
- 6% · Canada, China
- Languages at home
- 93% English-only · Other Asian/Pacific 2% Spanish 2% Other Indo-European 1%
Political lean MEDSL · Warren
- 2024 margin
- Solid R (+31.5) · D 33.8% · R 65.3%
- 2008→2024 swing
- +4.5pp toward D · 2008: -36.1pp · 2024: -31.5pp
- All cycles
- 2024: R+31.5 2020: R+30.8 2016: R+37.6 2012: R+39.5 2008: R+36.1
Not yet ingested
- Civics
- —
Market trends
- HPI YoY
- ▼ -125.08%
- Current HPI
- 221.4007
- Rent YoY
- —
- Metro
- Cincinnati, OH-KY-IN
- State GDP YoY
- ▲ 1.98%
- F500 in state
- 48
Industry mix (Fortune 500 HQ in OH)
| Industry | F500 HQs | Revenue |
|---|---|---|
| Insurance | 3 | $145B |
|
||
| Industrial Machinery | 3 | $49B |
|
||
| Financial Services | 3 | $24B |
|
||
| Consumer Goods | 2 | $93B |
|
||
| Aerospace / Defense | 2 | $47B |
|
||
| Utilities | 2 | $33B |
|
||
Price history
+0.0% since first listed4 events — show timeline
- 2026-05-29 Relisted — Cincy MLS
- 2026-05-29 Listing Removed — Cincy MLS
- 2026-05-28 Listed $300,000 Dayton MLS
- 2026-05-28 Listed $300,000 Cincy MLS
Property tax history
+2.7%/yrLatest (2025): $1,834 · +1.2% YoY. Source: county tax records.
Cash-flow waterfall
monthlySold comps — $/sqft
last 12 mo · ≤1 miLoading sold comps…