 🔨 Auction
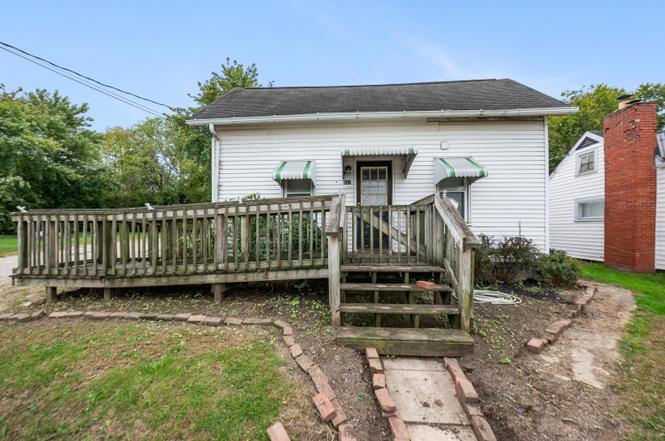
551 E Main St · Circleville, OH
Flood risk 1/10 · Minimal
- FEMA flood zone
- X (unshaded)
- Chance of flooding over 30 yrs
- 0.0%
- Est. flood insurance / yr
- $507 – $1,088
Fire risk 1/10 · Minimal
- Est. fire insurance / yr
- $713 – $1,323
Heat risk 4/10 · Minor
- Hot days now (above 100°F)
- 7 days/yr
- Hot days in 30 yrs
- 18 days/yr
Wind risk 2/10 · Minimal
- Chance of severe wind over 30 yrs
- 1.0%
Air-quality risk 2/10 · Minimal
- Unhealthy air days now
- 1 days/yr
- Unhealthy air days in 30 yrs
- 2 days/yr
Risk factors via First Street. Map © Google.
Why this score? — see what drove the D- grade
The composite is a weighted blend of 9 inputs, each scored 0–100. Each bar is that input's sub-score; the figure is the points it added to the 100-point composite (weight × sub-score).
- Cash flow +12.7/30.0
- ARV discount +7.5/15.0
- DSCR +3.8/10.0
- Livability +3.6/5.0
- Schools +3.5/10.0
- 1% rule +2.8/10.0
- Rent growth +2.5/5.0
- Condition / age +2.5/5.0
- Appreciation +0.0/10.0
$35,000
🖨 Deal sheet 📄 Offer letter ✓ Due diligence
Listing remarks
Online AUCTION, the RESERVE (Minimum Bid) is $35,000. Bidding takes place on the auction website. Go to auction website to submit bids. The auction begins to ends at 7:00 PM, Thursday, April 30th, 2026. BUYERS MUST SIGN ACKNOWLEDGEMENT OF TERMS to bid. Agents, please see 'A2A' for auction terms and conditions. Welcome to 551 E Main Street in Circleville. This early 1900s, 1.5-story home sits on a large 1/4 acre lot near the heart of town, close to shops, dining, and community amenities. With 1 bedroom, 1 full bath, and approximately 886 sq ft of main living space, plus an approximate 350 sq ft of lower level, this home delivers flexibility & functionality. There is a large fenced yard
Key facts
- Large fenced yard
- Handicap ramp
- Walk-up attic
Tags
Property features AI
Finance
- Other: Property may have commercial, multi-family, or other potential uses
- HOA & community: Sidewalks in the community
Exterior
- Utilities: Public water; Public sewer
- Home design: Single family residence; One-and-a-half stories; Built in 1900; No shared/common walls
- Construction: Block foundation
- Exterior features: Fenced yard; Shed on property
Interior
- Bedrooms: 1 main-level bedroom
- Flooring: Wood flooring; Laminate flooring; Carpet
- Bathrooms: 1 full bathroom
- Heating & cooling: Forced air heating; Central air; Window AC units
- Interior features: Partial basement; Insulated windows
Neighborhood map
What this means for you Summary
Snapshot
- This is a 1-bed/1.0-bath single-family listed at $35k.
Deal economics
- At list price, monthly cash flow is $-17 ($-208/yr) — negative.
- The deal already cash-flows at list — no discount required.
- Meets the 1% rule at list price ($1k rent vs $35k).
- Recommended offer: $31k (12.0% below list) — sets the bar for market timing.
- Cap rate 6.2% vs local median 2.9% in Circleville — top-decile yield for the area; either an underpriced asset or a hidden risk that comps aren't pricing in. Stress-test before assuming the spread holds.
Location & tenants
- Location reads 71/100 on livability (#437 in OH) — a middle-class / working-renter tenant base. Strengths: cost of living A+, housing A+, health & safety A-; Watch: amenities F, commute F, employment F.
- Circleville City (town): math 37% / reading 47% proficiency, ranked #533 of 656 in OH (top 81%) — families likely to look elsewhere, expect single-tenant / working-renter base with shorter leases.
- Market conditions: 121 active listings in the ZIP; 2 comparable units currently listed for rent nearby; 312 units permitted in Pickaway County in 2024 (0 in 5+ unit buildings).
Forward outlook
- Local home prices are declining (-3.0%/yr); year-one equity from $1k of loan paydown is wiped out by about $4k of value loss. Plan a longer hold.
- Pickaway County population projected at +3% by 2050 — modest demand growth; plan on rents tracking national, not racing it.
Negotiation context
- It's been on market 192 days — a 12% lower offer ($31k) is reasonable based on typical stale-listing flexibility.
- 2 sale attempts since 19y ago; this cycle's ask has dropped $85k (71%) from the opening price — seller is motivated, your offer sets the floor, not the list.
Risks & watch-outs
- Watch-outs: property tax is 2.9% of price; built in 1900 — expect roof / HVAC / electrical / plumbing capex.
Questions for the listing agent
- What do current leases actually rent for vs. the listed asking? Can we see a recent rent roll and the last 12 months of T-12 income?
- It's been on market 192 days. Have you received any prior offers? Is the seller open to a 12% concession, seller financing, or rate buy-down credit?
- Built in 1900 — when were the roof, HVAC, electrical panel, plumbing, and water heater last replaced?
- Property tax is high relative to price — has the assessment been appealed recently, and will the sale trigger a re-assessment?
- Why hasn't it sold? Are there any deal-killer items the seller is aware of (foundation, flood, title, zoning, code violations)?
- Is there a deadline driving the sale (1031 exchange, divorce, estate, relocation)? That informs how much negotiation room exists.
- The area grade is low — what's the realistic commute time and amenity access for the typical tenant pool here? Any planned neighborhood developments (good or bad) we should know about?
- What's the average days-on-market for RENTAL listings here right now (not sales)? A rising rental-DOM trend means longer vacancies and softer asking-rent achievability than the comps imply.
- What's the recent tenant-quality profile in this submarket — average credit score on applications, eviction rate, late-payment / NSF rate, and stable-employment percentage? A property-management company in the area should have these aggregated.
- How much new for-sale + rental construction is in the pipeline within 1–3 miles? Heavy new supply typically softens prices + rents 12–24 months out; constrained supply supports both.
Investment metrics
- 1% rule
- 0.78% ✗
- Cap rate
- 6.15%
- Cash-on-cash
- -0.50%
- DSCR
- 0.98
- GRM
- 10.8
CMA / ARV
- ARV (on-the-fly)
- $147,962
- Comps found
- 12
Show comp detail 12 sales within ~0.75 mi
| Address | Dist | Beds/Ba | Sqft | Sold | Price | $/sf | Match |
|---|---|---|---|---|---|---|---|
| 551 E Main St | 0.00mi | 1/1.0 | 886 (0%) | 1mo | $77,825 | $88 | 99 |
| 134 Fairview Blvd | 0.41mi | 2/1.0 (+1) | 864 (-2%) | 2mo | $140,000 | $162 | 70 |
| 419 Faye Ave | 0.29mi | 2/1.0 (+1) | 900 (+2%) | 19mo | $179,900 | $200 | 63 |
| 549 E Union St | 0.23mi | 2/1.0 (+1) | 802 (-10%) | 8mo | $165,000 | $206 | 62 |
| 194 Nicholas Dr | 0.43mi | 2/1.0 (+1) | 900 (+2%) | 15mo | $150,000 | $167 | 59 |
| 518 E Union St | 0.27mi | 2/1.0 (+1) | 972 (+10%) | 9mo | $105,000 | $108 | 59 |
| 349 Barnes Ave | 0.64mi | 2/1.0 (+1) | 920 (+4%) | 1mo | $203,600 | $221 | 58 |
| 382 E Franklin St | 0.31mi | 2/1.0 (+1) | 785 (-11%) | 6mo | $135,000 | $172 | 56 |
| 539 E Mound St | 0.19mi | 2/1.0 (+1) | 950 (+7%) | 22mo | $122,000 | $128 | 56 |
| 457 Half Ave | 0.42mi | 2/1.0 (+1) | 1,008 (+14%) | 1mo | $134,000 | $133 | 52 |
| 614 Renick Ave | 0.37mi | 2/1.0 (+1) | 768 (-13%) | 7mo | $170,000 | $221 | 50 |
| 327 Watt St | 0.43mi | 2/1.0 (+1) | 960 (+8%) | 21mo | $95,000 | $99 | 43 |
Match score weights: distance 35% · size 25% · config 20% · recency 20%. Top-matched comps best support the ARV.
Projected returns pro-forma
-3.0% appreciation · 3.0% rent growth · sell at horizon
- IRR
- -17.2%
- Equity multiple
- 0.39×
- Total profit
- $-25,123
- Equity at exit
- $22,062
- IRR
- -9.2%
- Equity multiple
- 0.43×
- Total profit
- $-23,474
- Equity at exit
- $12,793
Cash invested: $41,429 (down + closing). Projections, not guarantees.
Landlord ↔ Tenant lean methodology
- Overall (STATE)
- 73 Landlord-Friendly
- State Ohio
- 73 Landlord-Friendly · R+6
- County
- — inherits STATE
- City
- — inherits STATE
ZIP-level market 43113
- Active inventory
- 121
- Price-to-rent
- 2.5×
Monthly cashflow live
- Estimated rent
- $1,147 medium interval (Pro) →
- Mortgage (P&I)
- −$776
- Tax from tax record
- −$86 /mo · $1,028/yr
- Insurance
- −$62
- HOA
- −$0
- Vacancy / Maint / Mgmt
- −$241
- Net cashflow
- $-17
Break-even live
UW: 25.0% down · 7.5% · 30yr · 1.5% tax · 5.0% vac · 8.0% maint · 8.0% mgmt
Financing live
Cash to close
- Down payment
- $36,990
- Closing costs
- $4,439
- Reserves months
- —
- Total cash needed
- —
Loan-product check · same deal, 3 products live
Conventional
25% down · 7.5% · 30yr
- Down + closing
- —
- Monthly P&I
- —
- Monthly cashflow
- —
- DSCR
- —
- Eligible?
- —
Personal DTI + credit; lowest rate.
DSCR
20% down · 8.5% · 30yr
- Down + closing
- —
- Monthly P&I
- —
- Monthly cashflow
- —
- DSCR
- —
- Eligible?
- —
No personal income docs; deal must DSCR.
Hard money
10% down · 12.0% · 12mo
- Down + closing
- —
- Monthly P&I
- —
- Monthly cashflow
- —
- DSCR
- —
- Eligible?
- —
Short-term bridge; refi at stabilization.
Rent comps 2 comps
| Address | Beds | Baths | Sqft | Rent | $/sqft | DOM | Units | Dist |
|---|---|---|---|---|---|---|---|---|
| 504 S Court St Circleville, OH | 2.0 | 1.0 | 1000 | $1,225 | $1.23 | 23d | 1 | 0.80mi |
| 522 Nicholas Sq Circleville, OH | 1.0 | 1.0 | 680 | $1,049 | $1.54 | 1d | 1 | 0.87mi |
Listing history 7 events
-
2026-05-01status Pending
-
2026-03-25price $35,000
-
2025-11-18price $109,000
-
2025-10-21$119,900 Active
-
2019-02-28soldstatus $50,000
-
2007-10-12historical
-
2007-04-13$69,500
ⓘ Source: listings_history table (triggers on properties + properties_extension) + one-shot
backfill from property_details.listing_events for pre-trigger history.
Tax reassessment forecast OH · Partial reset (capped growth)
- Current annual tax
- $1,028 · $86/mo
- Projected year-2 tax
- $1,028 · $86/mo
- Expected delta
- $0/yr ($0/mo · 0.0%)
ⓘ Screening estimate from a state-policy table — verify with the county assessor before closing.
Climate risk First Street
- Flood 1/10 Low FEMA zone X (unshaded) · 0% chance over 30 yrs
- Wildfire 1/10 Low
- Heat 4/10 Moderate 7 d/yr ≥100°F today · 18 d/yr by 30 yrs out
- Wind 2/10 Low 100% chance of damaging wind over 30 yrs
- Air quality 2/10 Low 1 unhealthy d/yr today · 2 by 30 yrs out
Nearby sold comps map
Loading sold comps map…
Walkable amenities ~0.75 mi
Loading nearby amenities…
Taxation est. · year 1
- Rental income
- $13,761
- − Mortgage interest
- −$8,288
- − Property taxes
- −$1,028
- − Insurance
- −$740
- − Repairs & maintenance
- −$1,101
- − Management
- −$1,101
- − Depreciation
- −$4,304
- Taxable loss
- −$2,801
- Est. tax savings @ 24.0%
- +$672
- After-tax cash flow
- $464/yr
For passive investors: Depreciation is non-cash, so a rental often shows a tax loss while cash-flowing — sheltering income. Rental losses are passive: they offset passive income freely, and up to $25,000/yr can offset ordinary (W-2) income if you actively participate and your MAGI is under $100k (phasing out to $0 by $150k); unused losses carry forward. On sale, claimed depreciation is recaptured at up to 25%, and gains may owe capital-gains tax (a 1031 exchange can defer both). Figures are a year-1 estimate at your 24.0% rate — not tax advice; consult a CPA.
Schools (NCES district)
- District
- Circleville City
- NCES district ID
- 3904376
- Math proficiency
- 37% ▼ -19.00%
- Reading proficiency
- 47% ▼ -11.00%
- Median HH income
- $39,318
- Composite
- 35.09/100
- National rank
- #5021
- State rank
- #533 of 656 in OH
Livability — Circleville
- Score
- 71/100
- State rank
- #437
- US rank
- #7237
Category grades
Schools grade is shown separately in the Schools card above.
Census & demographics
- Census place
- Circleville, OH
- County
- Pickaway · 57,589 people
- Metro
- Columbus, OH
- Population (ZIP)
- 24,314
- Household income
- $63,715
- Rent vs Own
- Severe rent burden
- 7.4
Population outlook (Pickaway County) Hauer SSP2
- Today (2025)
- 59,488 people
- By 2030
- 60,400 · +1.5%
- By 2040
- 61,498 · +3.4%
- By 2050
- 61,478 · +3.3%
- By 2075
- 59,696 · +0.3%
- By 2100
- 51,458 · -13.5%
Race, ethnicity, and origin ACS 2023
- Neighborhood character
- Predominantly White (94%)
- Race & ethnicity
- White 94% Two or more races 4% Black 1%
- Common ancestry
- Slovak 2% Romanian 2% Iranian 1%
- Foreign-born
- 0%
Political lean MEDSL · Pickaway
- 2024 margin
- Solid R (+48.5) · D 25.3% · R 73.8%
- 2008→2024 swing
- -26.8pp toward R · 2008: -21.7pp · 2024: -48.5pp
- All cycles
- 2024: R+48.5 2020: R+47.0 2016: R+42.6 2012: R+18.7 2008: R+21.7
Not yet ingested
- Civics
- —
Market trends
- HPI YoY
- ▼ -136.77%
- Current HPI
- 241.5556
- Rent YoY
- —
- Metro
- —
- State GDP YoY
- ▲ 1.98%
- F500 in state
- 48
Industry mix (Fortune 500 HQ in OH)
| Industry | F500 HQs | Revenue |
|---|---|---|
| Insurance | 3 | $145B |
|
||
| Industrial Machinery | 3 | $49B |
|
||
| Financial Services | 3 | $24B |
|
||
| Consumer Goods | 2 | $93B |
|
||
| Aerospace / Defense | 2 | $47B |
|
||
| Utilities | 2 | $33B |
|
||
Price history
-49.6% since first listed7 events — show timeline
- 2026-05-01 Pending — CBRMLS
- 2026-03-25 Price Changed $35,000 CBRMLS
- 2025-11-18 Price Changed $109,000 CBRMLS
- 2025-10-21 Listed $119,900 CBRMLS
- 2019-02-28 Sold (Public Records) $50,000 Public Records
- 2007-10-12 Listing Removed — CBRMLS
- 2007-04-13 Listed $69,500 CBRMLS
Property tax history
+0.2%/yrLatest (2025): $1,028 · +0.5% YoY. Source: county tax records.
Cash-flow waterfall
monthlySold comps — $/sqft
last 12 mo · ≤1 miLoading sold comps…