 🏗️ New Construction
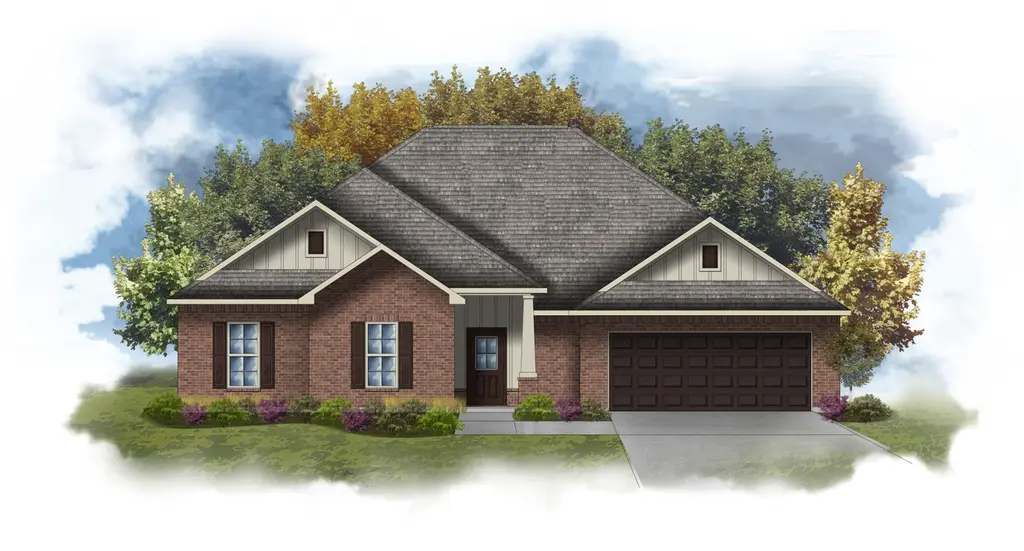
Crosby III H Plan · Huntsville, AL
Flood risk 1/10 · Minimal
- FEMA flood zone
- X (unshaded)
- Chance of flooding over 30 yrs
- 0.0%
- Est. flood insurance / yr
- $507 – $1,088
Fire risk 2/10 · Minimal
- Est. fire insurance / yr
- $916 – $1,700
Heat risk 5/10 · Moderate
- Hot days now (above 105°F)
- 8 days/yr
- Hot days in 30 yrs
- 25 days/yr
Wind risk 4/10 · Minor
- Chance of severe wind over 30 yrs
- 16.0%
Air-quality risk 1/10 · Minimal
- Unhealthy air days now
- 0 days/yr
- Unhealthy air days in 30 yrs
- 0 days/yr
Risk factors via First Street. Map © Google.
Why this score? — see what drove the D grade
The composite is a weighted blend of 9 inputs, each scored 0–100. Each bar is that input's sub-score; the figure is the points it added to the 100-point composite (weight × sub-score).
- Appreciation +10.0/10.0
- Cash flow +9.6/30.0
- ARV discount +7.5/15.0
- Livability +4.1/5.0
- Schools +3.7/10.0
- 1% rule +2.9/10.0
- DSCR +2.7/10.0
- Rent growth +2.5/5.0
- Condition / age +1.0/5.0
$453,990
🖨 Deal sheet 📄 Offer letter ✓ Due diligence
Listing remarks MLS
Introducing the Crosby III H by DSLD Homes, a thoughtfully designed, energy-efficient home that blends modern comfort with stylish living. With 2,641 square feet of living space and a total area of 3,420 square feet, this home offers ample room for growing families and those who love to entertain. The open floor plan creates a seamless transition between the kitchen, living, and dining areas, perfect for both family gatherings and hosting guests. Featuring four spacious bedrooms and two bathrooms, the layout provides plenty of space for comfort and privacy. The luxurious primary suite is a true retreat, featuring a double master vanity, garden tub, separate master shower, and a walk-in master closet, making it the perfect space for relaxation and unwinding. The brick and siding exterior gives the home a timeless, low-maintenance finish with enduring curb appeal. Inside, thoughtful details such as a boot bench in the mud room and a pocket office offer extra convenience and organization for busy households. Enjoy the added brightness of recessed lighting in the kitchen and living areas, creating a warm, inviting atmosphere. The two-car garage provides convenient parking and storage space, while the covered rear patio extends your living area outdoors, perfect for relaxing or entertaining. Designed with energy-efficient materials and systems, the Crosby III H helps you reduce utility costs while enhancing comfort year-round.
Key facts
- Open floor plan
- Double master vanity
- Garden tub
Tags
Neighborhood map
What this means for you Summary
Snapshot
- This is a 4-bed/2.0-bath single-family listed at $454k. Condition is rated poor.
Deal economics
- At list price, monthly cash flow is $-327 ($-4k/yr) — negative.
- To cash-flow at today's rent, offer at most $429k (5.5% below list).
- To meet the 1% rule (rent ≥ 1% of price), the offer needs to be $375k (17.3% below list).
- Recommended offer: $375k (17.3% below list) — sets the bar for 1% rule.
- Cap rate 5.5% vs local median 3.8% in Huntsville — top-decile yield for the area; either an underpriced asset or a hidden risk that comps aren't pricing in. Stress-test before assuming the spread holds.
Location & tenants
- Location reads 82/100 on livability (#3 in AL, #1,082 nationally) — a professional / high-income tenant draw. Strengths: commute A+, cost of living A+, housing A+; Watch: crime F.
- Madison County (rural): math 27% / reading 56% proficiency, ranked #19 of 129 in AL (top 15%) — families likely to look elsewhere, expect single-tenant / working-renter base with shorter leases.
- Market conditions: 184 active listings in the ZIP; 2 comparable units currently listed for rent nearby; 4,709 units permitted in Madison County in 2024 (1,186 in 5+ unit buildings).
Forward outlook
- In year one you build about $51k of equity ($3k loan paydown + $48k appreciation (10.0% local appreciation)).
- Madison County population projected at +18% by 2050 — long-run rental-demand tailwind backs the buy-and-hold thesis.
- By year 2, paydown + projected appreciation supports a ~$82k cash-out refi (75% LTV) — recoverable capital for the next deal without selling this one.
Negotiation context
- It's been on market 374 days — a 12% lower offer ($400k) is reasonable based on typical stale-listing flexibility.
Risks & watch-outs
- Climate carrying-cost: extreme-heat days projected 8→25/yr by 2055 (HVAC capex compounding) — expect insurance premiums to compound above CPI over the hold.
Questions for the listing agent
- What do current leases actually rent for vs. the listed asking? Can we see a recent rent roll and the last 12 months of T-12 income?
- It's been on market 374 days. Have you received any prior offers? Is the seller open to a 17% concession, seller financing, or rate buy-down credit?
- Have any recent inspections been done? Can we get a copy of the seller's disclosures and any deferred-maintenance estimates?
- Why hasn't it sold? Are there any deal-killer items the seller is aware of (foundation, flood, title, zoning, code violations)?
- Is there a deadline driving the sale (1031 exchange, divorce, estate, relocation)? That informs how much negotiation room exists.
- Crime grade is F in this area — have there been break-ins, vandalism, or insurance claims at this property in the last 3 years? What carrier currently insures it and at what premium?
- The area grade is low — what's the realistic commute time and amenity access for the typical tenant pool here? Any planned neighborhood developments (good or bad) we should know about?
- What's the average days-on-market for RENTAL listings here right now (not sales)? A rising rental-DOM trend means longer vacancies and softer asking-rent achievability than the comps imply.
- What's the recent tenant-quality profile in this submarket — average credit score on applications, eviction rate, late-payment / NSF rate, and stable-employment percentage? A property-management company in the area should have these aggregated.
- How much new for-sale + rental construction is in the pipeline within 1–3 miles? Heavy new supply typically softens prices + rents 12–24 months out; constrained supply supports both.
Investment metrics
- 1% rule
- 0.79% ✗
- Cap rate
- 5.47%
- Cash-on-cash
- -2.94%
- DSCR
- 0.87
- GRM
- 10.6
CMA / ARV
- ARV (median comp)
- $476,438
- List price
- $453,990
- Delta
- -4.71%
- Verdict
- FAIR
- Comps
- 20 within 1.0 mi
Show comp detail 12 sales within ~0.75 mi
| Address | Dist | Beds/Ba | Sqft | Sold | Price | $/sf | Match |
|---|---|---|---|---|---|---|---|
| 7102 Springwell Ct SE | 0.09mi | 4/2.0 | 2,641 (0%) | 1mo | $462,298 | $175 | 95 |
| 7118 Springwell Ct SE | 0.13mi | 4/2.0 | 2,636 (-0%) | 1mo | $461,712 | $175 | 93 |
| 7115 Springwell Ct SE | 0.13mi | 4/2.0 | 2,641 (0%) | 3mo | $490,411 | $186 | 92 |
| 7110 Springwell Ct SE | 0.13mi | 4/2.5 | 2,544 (-4%) | 2mo | $460,571 | $181 | 85 |
| 7107 Springwell Ct SE | 0.13mi | 4/2.5 | 2,544 (-4%) | 5mo | $470,909 | $185 | 82 |
| 7112 Springwell Ct SE | 0.13mi | 4/2.0 | 2,314 (-12%) | 1mo | $435,990 | $188 | 73 |
| 7106 Springwell Ct SE | 0.07mi | 4/2.0 | 2,314 (-12%) | 5mo | $444,985 | $192 | 72 |
| 7109 Springwell Ct SE | 0.13mi | 4/2.0 | 2,314 (-12%) | 4mo | $458,628 | $198 | 70 |
| 7014 Huddersfield Ln SE | 0.20mi | 4/3.0 | 2,903 (+10%) | 3mo | $531,381 | $183 | 68 |
| 7104 Springwell Ct SE | 0.09mi | 4/3.0 | 3,022 (+14%) | 2mo | $503,912 | $167 | 66 |
| 8883 Mountain Preserve Blvd SE | 0.13mi | 4/3.0 | 3,013 (+14%) | 3mo | $537,495 | $178 | 64 |
| 9018 Mountain Preserve Blvd | 0.38mi | 4/2.0 | 2,314 (-12%) | 2mo | $390,000 | $169 | 60 |
Match score weights: distance 35% · size 25% · config 20% · recency 20%. Top-matched comps best support the ARV.
Projected returns pro-forma
10.0% appreciation · 3.0% rent growth · sell at horizon
- IRR
- 22.2%
- Equity multiple
- 2.79×
- Total profit
- $238,720
- Equity at exit
- $429,213
- IRR
- 19.9%
- Equity multiple
- 6.39×
- Total profit
- $719,475
- Equity at exit
- $925,614
Cash invested: $133,403 (down + closing). Projections, not guarantees.
Landlord ↔ Tenant lean methodology
- Overall (STATE)
- 90 Strongly Landlord-Friendly
- State Alabama
- 90 Strongly Landlord-Friendly · R+15
- County
- — inherits STATE
- City
- — inherits STATE
ZIP-level market 35748
- Home prices YoY
- 4.0%
- Active inventory
- 184
- Price-to-rent
- 10.1×
Monthly cashflow live
- Estimated rent
- $3,754 medium interval (Pro) →
- Mortgage (P&I)
- −$2,498
- Tax est. 1.5%
- −$596 /mo · $7,147/yr
- Insurance
- −$199
- HOA
- −$0
- Vacancy / Maint / Mgmt
- −$788
- Net cashflow
- $-327
Break-even live
UW: 25.0% down · 7.5% · 30yr · 1.5% tax · 5.0% vac · 8.0% maint · 8.0% mgmt
Financing live
Cash to close
- Down payment
- $119,109
- Closing costs
- $14,293
- Reserves months
- —
- Total cash needed
- —
Loan-product check · same deal, 3 products live
Conventional
25% down · 7.5% · 30yr
- Down + closing
- —
- Monthly P&I
- —
- Monthly cashflow
- —
- DSCR
- —
- Eligible?
- —
Personal DTI + credit; lowest rate.
DSCR
20% down · 8.5% · 30yr
- Down + closing
- —
- Monthly P&I
- —
- Monthly cashflow
- —
- DSCR
- —
- Eligible?
- —
No personal income docs; deal must DSCR.
Hard money
10% down · 12.0% · 12mo
- Down + closing
- —
- Monthly P&I
- —
- Monthly cashflow
- —
- DSCR
- —
- Eligible?
- —
Short-term bridge; refi at stabilization.
Rent comps 2 comps
| Address | Beds | Baths | Sqft | Rent | $/sqft | DOM | Units | Dist |
|---|---|---|---|---|---|---|---|---|
| 8889 Mountain Preserve Blvd SE Gurley, AL | 4.0 | 3.5 | 3350 | $4,000 | $1.19 | 44d | 1 | 0.13mi |
| 9041 Mountain Preserve Blvd SE Gurley, AL | 3.0 | 2.0 | 1833 | $2,700 | $1.47 | 14d | 1 | 0.48mi |
Listing history 16 events
-
2026-06-18days on market $453,990 Active 374 DOM
-
2026-06-17days on market $453,990 Active 373 DOM
-
2026-06-16days on market $453,990 Active 372 DOM
-
2026-06-15days on market $453,990 Active 371 DOM
-
2026-06-14days on market $453,990 Active 369 DOM
-
2026-06-10days on market $453,990 Active 366 DOM
-
2026-06-09days on market $453,990 Active 365 DOM
-
2026-06-08days on market $453,990 Active 364 DOM
-
2026-06-07days on market $453,990 Active 363 DOM
-
2026-06-03days on market $453,990 Active 359 DOM
-
2026-06-02days on market $453,990 Active 358 DOM
-
2026-06-01days on market $453,990 Active 357 DOM
-
2026-05-31days on market $453,990 Active 356 DOM
-
2026-05-30days on market $453,990 Active 355 DOM
-
2025-07-01price $453,990 1445-char remark
Show marketing remark (1445 chars)
Introducing the Crosby III H by DSLD Homes, a thoughtfully designed, energy-efficient home that blends modern comfort with stylish living. With 2,641 square feet of living space and a total area of 3,420 square feet, this home offers ample room for growing families and those who love to entertain. The open floor plan creates a seamless transition between the kitchen, living, and dining areas, perfect for both family gatherings and hosting guests. Featuring four spacious bedrooms and two bathrooms, the layout provides plenty of space for comfort and privacy. The luxurious primary suite is a true retreat, featuring a double master vanity, garden tub, separate master shower, and a walk-in master closet, making it the perfect space for relaxation and unwinding. The brick and siding exterior gives the home a timeless, low-maintenance finish with enduring curb appeal. Inside, thoughtful details such as a boot bench in the mud room and a pocket office offer extra convenience and organization for busy households. Enjoy the added brightness of recessed lighting in the kitchen and living areas, creating a warm, inviting atmosphere. The two-car garage provides convenient parking and storage space, while the covered rear patio extends your living area outdoors, perfect for relaxing or entertaining. Designed with energy-efficient materials and systems, the Crosby III H helps you reduce utility costs while enhancing comfort year-round.
-
2025-06-09$450,990 Active 1445-char remark
Show marketing remark (1445 chars)
Introducing the Crosby III H by DSLD Homes, a thoughtfully designed, energy-efficient home that blends modern comfort with stylish living. With 2,641 square feet of living space and a total area of 3,420 square feet, this home offers ample room for growing families and those who love to entertain. The open floor plan creates a seamless transition between the kitchen, living, and dining areas, perfect for both family gatherings and hosting guests. Featuring four spacious bedrooms and two bathrooms, the layout provides plenty of space for comfort and privacy. The luxurious primary suite is a true retreat, featuring a double master vanity, garden tub, separate master shower, and a walk-in master closet, making it the perfect space for relaxation and unwinding. The brick and siding exterior gives the home a timeless, low-maintenance finish with enduring curb appeal. Inside, thoughtful details such as a boot bench in the mud room and a pocket office offer extra convenience and organization for busy households. Enjoy the added brightness of recessed lighting in the kitchen and living areas, creating a warm, inviting atmosphere. The two-car garage provides convenient parking and storage space, while the covered rear patio extends your living area outdoors, perfect for relaxing or entertaining. Designed with energy-efficient materials and systems, the Crosby III H helps you reduce utility costs while enhancing comfort year-round.
ⓘ Source: listings_history table (triggers on properties + properties_extension) + one-shot
backfill from property_details.listing_events for pre-trigger history.
Climate risk First Street
- Flood 1/10 Low FEMA zone X (unshaded) · 0% chance over 30 yrs
- Wildfire 2/10 Low
- Heat 5/10 Major 8 d/yr ≥105°F today · 25 d/yr by 30 yrs out
- Wind 4/10 Moderate 16% chance of damaging wind over 30 yrs
- Air quality 1/10 Low 0 unhealthy d/yr today · 0 by 30 yrs out
Nearby sold comps map
Loading sold comps map…
Walkable amenities ~0.75 mi
Loading nearby amenities…
Taxation est. · year 1
- Rental income
- $45,049
- − Mortgage interest
- −$26,688
- − Property taxes
- −$7,147
- − Insurance
- −$2,382
- − Repairs & maintenance
- −$3,604
- − Management
- −$3,604
- − Depreciation
- −$13,860
- Taxable loss
- −$12,236
- Est. tax savings @ 24.0%
- +$2,937
- After-tax cash flow
- $-986/yr
For passive investors: Depreciation is non-cash, so a rental often shows a tax loss while cash-flowing — sheltering income. Rental losses are passive: they offset passive income freely, and up to $25,000/yr can offset ordinary (W-2) income if you actively participate and your MAGI is under $100k (phasing out to $0 by $150k); unused losses carry forward. On sale, claimed depreciation is recaptured at up to 25%, and gains may owe capital-gains tax (a 1031 exchange can defer both). Figures are a year-1 estimate at your 24.0% rate — not tax advice; consult a CPA.
Condition & rehab AI · 2 photos
This home requires extensive repairs and maintenance, including major work on the exterior siding, roof, and landscaping. Immediate updates are needed to improve its condition and value.
Repairs flagged
- Major exterior siding — Peeling and damaged
- Major roof — Missing shingles and general wear
- Major landscaping — Overgrown and unkempt
Value-add opportunities
- Both repair and replace exterior siding — Improves curb appeal and structural integrity
- Both repair and replace roof — Essential for structural integrity and water resistance
- Both landscaping and yard work — Enhances curb appeal and property value
- Both paint interior and exterior — Enhances appearance and value
- Both repair and replace windows — Improves energy efficiency and curb appeal
Renovation cost estimate screening
| Repair item | Severity | Est. cost |
|---|---|---|
| exterior siding · Peeling and damaged | Major | $15,000–50,000 |
| roof · Missing shingles and general wear | Major | $15,000–50,000 |
| landscaping · Overgrown and unkempt | Major | $15,000–50,000 |
| Total estimated repair cost · 3 items | $45,000–150,000 |
Value-add ROI direction
- Both repair and replace exterior siding — Improves curb appeal and structural integrity ↑
- Both repair and replace roof — Essential for structural integrity and water resistance ↑
- Both landscaping and yard work — Enhances curb appeal and property value ↑
- Both paint interior and exterior — Enhances appearance and value ↑
- Both repair and replace windows — Improves energy efficiency and curb appeal ↑
ⓘ Cost ranges are severity-bucket heuristics (US national rule-of-thumb). Get contractor quotes + a written scope before underwriting a rehab budget.
Schools (NCES district)
- District
- Madison County
- NCES district ID
- 0102220
- Math proficiency
- 27% ▼ -32.00%
- Reading proficiency
- 56% ▼ -1.00%
- Median HH income
- $66,058
- Composite
- 37.15/100
- National rank
- #4483
- State rank
- #19 of 129 in AL
Livability — Huntsville
- Score
- 82/100
- State rank
- #3
- US rank
- #1082
Category grades
Schools grade is shown separately in the Schools card above.
Census & demographics
- Census place
- Huntsville, AL
- City population
- 220,435
- Population (ZIP)
- 7,311
Population outlook (Madison County) Hauer SSP2
- Today (2025)
- 392,086 people
- By 2030
- 409,788 · +4.5%
- By 2040
- 440,557 · +12.4%
- By 2050
- 460,990 · +17.6%
- By 2075
- 502,872 · +28.3%
- By 2100
- 513,623 · +31.0%
Race, ethnicity, and origin ACS 2023
- Neighborhood character
- Predominantly White (92%)
- Race & ethnicity
- White 92% Two or more races 3% Black 3%
- Common ancestry
- Lithuanian 5% Slovak 4% Italian 1%
- Foreign-born
- 1%
- Languages at home
- 97% English-only · French/Haitian/Cajun 1% Other Indo-European 1% Tagalog/Filipino 1%
Political lean MEDSL · Madison
- 2024 margin
- Lean R (+9.0) · D 44.7% · R 53.7% · Other 1.6%
- 2008→2024 swing
- +6.0pp toward D · 2008: -14.9pp · 2024: -9.0pp
- All cycles
- 2024: R+9.0 2020: R+8.0 2016: R+16.8 2012: R+18.7 2008: R+14.9
Not yet ingested
- Civics
- —
Market trends
- HPI YoY
- ▲ 13.02%
- Current HPI
- 337.7613
- Rent YoY
- —
- Metro
- —
- State GDP YoY
- ▲ 2.94%
- F500 in state
- 4
Industry mix (Fortune 500 HQ in AL)
| Industry | F500 HQs | Revenue |
|---|---|---|
| Financial Services | 1 | $8B |
|
||
| Healthcare | 1 | $5B |
|
||
Price history
+0.7% since first listed2 events — show timeline
- 2025-07-01 Price Changed $453,990 Zillow
- 2025-06-09 Listed $450,990 Zillow
Cash-flow waterfall
monthlySold comps — $/sqft
last 12 mo · ≤1 miLoading sold comps…