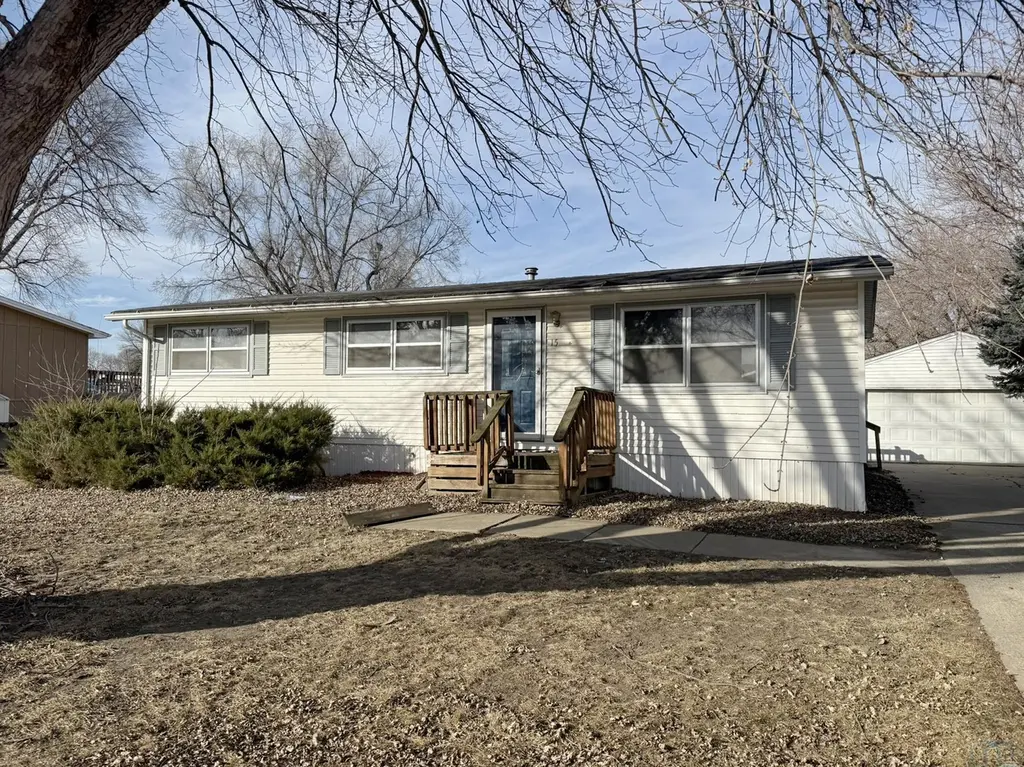
15 Alcoma Dr · North Sioux City, SD
Flood risk 1/10 · Minimal
- FEMA flood zone
- X (unshaded)
- Chance of flooding over 30 yrs
- 0.0%
- Est. flood insurance / yr
- $473 – $860
Fire risk 4/10 · Minor
- Est. fire insurance / yr
- $1,342 – $2,492
Heat risk 3/10 · Minor
- Hot days now (above 102°F)
- 7 days/yr
- Hot days in 30 yrs
- 15 days/yr
Wind risk 2/10 · Minimal
- Chance of severe wind over 30 yrs
- —
Air-quality risk 2/10 · Minimal
- Unhealthy air days now
- 1 days/yr
- Unhealthy air days in 30 yrs
- 1 days/yr
Risk factors via First Street. Map © Google.
Why this score? — see what drove the B- grade
The composite is a weighted blend of 9 inputs, each scored 0–100. Each bar is that input's sub-score; the figure is the points it added to the 100-point composite (weight × sub-score).
- Cash flow +29.3/30.0
- DSCR +10.0/10.0
- 1% rule +8.1/10.0
- ARV discount +7.5/15.0
- Schools +4.6/10.0
- Livability +3.6/5.0
- Rent growth +2.5/5.0
- Condition / age +2.5/5.0
- Appreciation +0.0/10.0
$79,900
🖨 Deal sheet 📄 Offer letter ✓ Due diligence
Key facts
- Large deck
- Fenced back yard
- Single level living
Tags
Neighborhood map
What this means for you Summary
Snapshot
- This is a 3-bed/2.0-bath other listed at $80k.
Deal economics
- At list price, monthly cash flow is $281 ($3k/yr) — positive.
- The deal already cash-flows at list — no discount required.
- Meets the 1% rule at list price ($1k rent vs $80k).
- Recommended offer: $78k (3.0% below list) — sets the bar for market timing.
Location & tenants
- Location reads 71/100 on livability (#59 in SD) — a middle-class / working-renter tenant base. Strengths: cost of living A+, housing A+, crime B+; Watch: health & safety D, amenities F, commute F.
- Dakota Valley School District 61-8 (suburban): math 45% / reading 59% proficiency, ranked #16 of 59 in SD (top 27%) — acceptable for families but not a draw, mixed tenant base, ~2y average lease; only 12% free/reduced lunch — higher-income household profile.
- Zoned schools: Dakota Valley Elementary - 02 (math 67% / reading 67%, grade B+, #32 of 253 statewide, top 14%, 365 students, 11% FRL); Dakota Valley Middle School - 03 (math 39% / reading 60%, grade C, #55 of 143 statewide, top 46%, 342 students, 10% FRL); Dakota Valley High School - 01 (math 52% / reading 72%, grade B-, #28 of 151 statewide, top 19%, 448 students, 8% FRL) — zoned schools at 9% FRL track the district average.
- Market conditions: 88 active listings in the ZIP; 1 comparable units currently listed for rent nearby; 46 units permitted in Union County in 2024 (8 in 5+ unit buildings).
Forward outlook
- Local home prices are declining (-3.0%/yr); year-one equity from $552 of loan paydown is wiped out by about $2k of value loss. Plan a longer hold.
- Union County population projected at +17% by 2050 — long-run rental-demand tailwind backs the buy-and-hold thesis.
- At projected returns (-3.0% appreciation + 3.0% rent growth), your $22k cash investment doubles in ~8 years — after that, you're playing with house money.
Negotiation context
- It's been on market 44 days — a 3% lower offer ($78k) is reasonable based on typical stale-listing flexibility.
Questions for the listing agent
- It's been on market 44 days. Have you received any prior offers? Is the seller open to a 3% concession, seller financing, or rate buy-down credit?
- Built in 1975 — when were the roof, HVAC, electrical panel, plumbing, and water heater last replaced?
- Is there a deadline driving the sale (1031 exchange, divorce, estate, relocation)? That informs how much negotiation room exists.
- What's the average days-on-market for RENTAL listings here right now (not sales)? A rising rental-DOM trend means longer vacancies and softer asking-rent achievability than the comps imply.
- What's the recent tenant-quality profile in this submarket — average credit score on applications, eviction rate, late-payment / NSF rate, and stable-employment percentage? A property-management company in the area should have these aggregated.
- How much new for-sale + rental construction is in the pipeline within 1–3 miles? Heavy new supply typically softens prices + rents 12–24 months out; constrained supply supports both.
Investment metrics
- 1% rule
- 1.31% ✓
- Cap rate
- 10.51%
- Cash-on-cash
- 15.06%
- DSCR
- 1.67
- GRM
- 6.4
CMA / ARV
No comps found within radius.
Projected returns pro-forma
-3.0% appreciation · 3.0% rent growth · sell at horizon
- IRR
- 5.7%
- Equity multiple
- 1.22×
- Total profit
- $4,946
- Equity at exit
- $11,913
- IRR
- 15.1%
- Equity multiple
- 2.22×
- Total profit
- $27,381
- Equity at exit
- $6,908
Cash invested: $22,372 (down + closing). Projections, not guarantees.
Landlord ↔ Tenant lean methodology
- Overall (STATE)
- 83 Strongly Landlord-Friendly
- State South Dakota
- 83 Strongly Landlord-Friendly · R+16
- County
- — inherits STATE
- City
- — inherits STATE
ZIP-level market 57049
- Home prices YoY
- -27.9%
- Active inventory
- 88
- Price-to-rent
- 6.4×
Monthly cashflow live
- Estimated rent
- $1,048 medium interval (Pro) →
- Mortgage (P&I)
- −$419
- Tax from tax record
- −$94 /mo · $1,134/yr
- Insurance
- −$33
- HOA
- −$0
- Vacancy / Maint / Mgmt
- −$220
- Net cashflow
- $281
Break-even live
UW: 25.0% down · 7.5% · 30yr · 1.5% tax · 5.0% vac · 8.0% maint · 8.0% mgmt
Financing live
Cash to close
- Down payment
- $19,975
- Closing costs
- $2,397
- Reserves months
- —
- Total cash needed
- —
Loan-product check · same deal, 3 products live
Conventional
25% down · 7.5% · 30yr
- Down + closing
- —
- Monthly P&I
- —
- Monthly cashflow
- —
- DSCR
- —
- Eligible?
- —
Personal DTI + credit; lowest rate.
DSCR
20% down · 8.5% · 30yr
- Down + closing
- —
- Monthly P&I
- —
- Monthly cashflow
- —
- DSCR
- —
- Eligible?
- —
No personal income docs; deal must DSCR.
Hard money
10% down · 12.0% · 12mo
- Down + closing
- —
- Monthly P&I
- —
- Monthly cashflow
- —
- DSCR
- —
- Eligible?
- —
Short-term bridge; refi at stabilization.
Rent comps 1 comps
| Address | Beds | Baths | Sqft | Rent | $/sqft | DOM | Units | Dist |
|---|---|---|---|---|---|---|---|---|
| 340 Streeter Dr North Sioux City, SD | 2.0 | 1.0 | 750 | $1,048 | $1.40 | 43d | 3 | 0.28mi |
Listing history 13 events
-
2026-06-18days on market $79,900 Active 44 DOM
-
2026-06-17days on market $79,900 Active 43 DOM
-
2026-06-16days on market $79,900 Active 42 DOM
-
2026-06-15days on market $79,900 Active 41 DOM
-
2026-06-13days on market $79,900 Active 39 DOM
-
2026-06-12days on market $79,900 Active 38 DOM
-
2026-06-09days on market $79,900 Active 35 DOM
-
2026-06-08pricestatusdays on market $79,900 Active 34 DOM
-
2026-04-24status Pending
-
2026-03-23$84,900 Active
-
1999-09-03soldstatus $70,000
-
1996-03-09soldstatus $75,750
-
1993-01-05soldstatus $46,250
ⓘ Source: listings_history table (triggers on properties + properties_extension) + one-shot
backfill from property_details.listing_events for pre-trigger history.
Tax reassessment forecast SD · Resets to sale price
- Current annual tax
- $1,134 · $94/mo
- Projected year-2 tax
- $1,134 · $94/mo
- Expected delta
- $0/yr ($0/mo · 0.0%)
ⓘ Screening estimate from a state-policy table — verify with the county assessor before closing.
Climate risk First Street
- Flood 1/10 Low FEMA zone X (unshaded) · 0% chance over 30 yrs
- Wildfire 4/10 Moderate
- Heat 3/10 Moderate 7 d/yr ≥102°F today · 15 d/yr by 30 yrs out
- Wind 2/10 Low
- Air quality 2/10 Low 1 unhealthy d/yr today · 1 by 30 yrs out
Nearby sold comps map
Loading sold comps map…
Walkable amenities ~0.75 mi
Loading nearby amenities…
Taxation est. · year 1
- Rental income
- $12,570
- − Mortgage interest
- −$4,476
- − Property taxes
- −$1,134
- − Insurance
- −$400
- − Repairs & maintenance
- −$1,006
- − Management
- −$1,006
- − Depreciation
- −$2,324
- Taxable income
- $2,225
- Est. tax owed @ 24.0%
- −$534
- After-tax cash flow
- $2,835/yr
For passive investors: Depreciation is non-cash, so a rental often shows a tax loss while cash-flowing — sheltering income. Rental losses are passive: they offset passive income freely, and up to $25,000/yr can offset ordinary (W-2) income if you actively participate and your MAGI is under $100k (phasing out to $0 by $150k); unused losses carry forward. On sale, claimed depreciation is recaptured at up to 25%, and gains may owe capital-gains tax (a 1031 exchange can defer both). Figures are a year-1 estimate at your 24.0% rate — not tax advice; consult a CPA.
Schools (NCES district)
- District
- Dakota Valley School District 61-8
- NCES district ID
- 4636990
- Math proficiency
- 45% ▼ -8.00%
- Reading proficiency
- 59% ▼ -1.00%
- Median HH income
- $71,366
- Composite
- 46.43/100
- National rank
- #2451
- State rank
- #16 of 59 in SD
Livability — North Sioux City
- Score
- 71/100
- State rank
- #59
- US rank
- #7085
Category grades
Schools grade is shown separately in the Schools card above.
Census & demographics
- Census place
- North Sioux City, SD
- Population (ZIP)
- 7,814
Population outlook (Union County) Hauer SSP2
- Today (2025)
- 16,155 people
- By 2030
- 16,737 · +3.6%
- By 2040
- 17,804 · +10.2%
- By 2050
- 18,877 · +16.8%
- By 2075
- 23,022 · +42.5%
- By 2100
- 29,133 · +80.3%
Race, ethnicity, and origin ACS 2023
- Neighborhood character
- Predominantly White (84%)
- Race & ethnicity
- White 84% Hispanic / Latino 7% Two or more races 7% Asian 3% Black 1% Native American 1%
- Hispanic origin (detail)
- Mexican 5%
- Common ancestry
- Iranian 4% Portuguese 4% Lithuanian 4%
- Foreign-born
- 4% · Canada, China
- Languages at home
- 94% English-only · Spanish 3% Russian/Polish/Slavic 1% Other Indo-European 1%
Political lean MEDSL · Union
- 2024 margin
- Solid R (+40.7) · D 28.7% · R 69.4% · Other 1.9%
- 2008→2024 swing
- -26.8pp toward R · 2008: -13.8pp · 2024: -40.7pp
- All cycles
- 2024: R+40.7 2020: R+36.4 2016: R+38.8 2012: R+25.2 2008: R+13.8
Not yet ingested
- Civics
- —
Market trends
- HPI YoY
- ▼ -68.14%
- Current HPI
- 175.7612
- Rent YoY
- —
- Metro
- —
- State GDP YoY
- ▲ 0.70%
- F500 in state
- 2
Industry mix (Fortune 500 HQ in SD)
| Industry | F500 HQs | Revenue |
|---|---|---|
| Utilities | 1 | $1B |
|
||
Price history
+83.6% since first listed5 events — show timeline
- 2026-04-24 Pending — NWIA
- 2026-03-23 Listed $84,900 NWIA
- 1999-09-03 Sold (Public Records) $70,000 Public Records
- 1996-03-09 Sold (Public Records) $75,750 Public Records
- 1993-01-05 Sold (Public Records) $46,250 Public Records
Property tax history
-4.4%/yrLatest (2025): $1,134 · +19.6% YoY. Source: county tax records.
Cash-flow waterfall
monthlySold comps — $/sqft
last 12 mo · ≤1 miLoading sold comps…