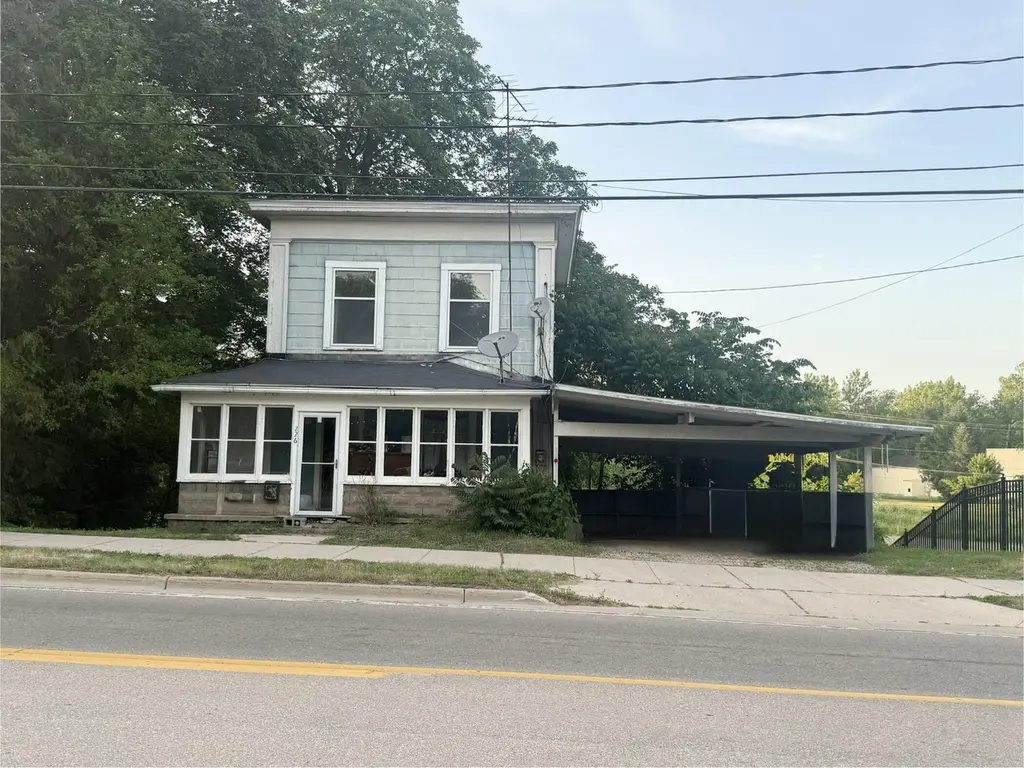
226 Monroe St · Allegan, MI
Flood risk 10/10 · Severe
- FEMA flood zone
- X (unshaded)
- Chance of flooding over 30 yrs
- 0.99%
- Est. flood insurance / yr
- $473 – $860
Fire risk 1/10 · Minimal
- Est. fire insurance / yr
- $784 – $1,456
Heat risk 2/10 · Minimal
- Hot days now (above 97°F)
- 7 days/yr
- Hot days in 30 yrs
- 16 days/yr
Wind risk 2/10 · Minimal
- Chance of severe wind over 30 yrs
- —
Air-quality risk 3/10 · Minor
- Unhealthy air days now
- 2 days/yr
- Unhealthy air days in 30 yrs
- 3 days/yr
Risk factors via First Street. Map © Google.
Why this score? — see what drove the B+ grade
The composite is a weighted blend of 9 inputs, each scored 0–100. Each bar is that input's sub-score; the figure is the points it added to the 100-point composite (weight × sub-score).
- Cash flow +30.0/30.0
- ARV discount +15.0/15.0
- DSCR +10.0/10.0
- 1% rule +9.6/10.0
- Livability +3.5/5.0
- Schools +2.7/10.0
- Rent growth +2.5/5.0
- Condition / age +2.5/5.0
- Appreciation +0.0/10.0
$145,000
🖨 Deal sheet 📄 Offer letter ✓ Due diligence
Listing remarks MLS
This charming 3-bedroom, 1-bath home is packed with character and ready for its next chapter. It features original wood floors just waiting to be brought back to their original glory. While it needs some work, the price is right--making it a fantastic opportunity for first-time buyers looking to build equity or investors searching for a great rental property. Best of all, it's nestled right next to a scenic city park and just a short walk from everything downtown Allegan has to offer--shops, dining, entertainment, and river access with a kayak launch less than a mile away. Prime location, endless potential--this one won't last long!
Key facts
- Kayak launch
- Scenic city park
- Original wood floors
Tags
Property features AI
Exterior
- Parking: Carport (no attached garage)
- Utilities: Natural gas available and connected; Electricity available
- Home design: Traditional single-family residence; Built in 1940
- Construction: Shingle siding; Shingle roof
- Exterior features: Sidewalk; Paved road access; Public water
Interior
- Kitchen: Range; Refrigerator
- Bathrooms: 1 full bathroom
- Heating & cooling: Forced air heating
- Interior features: Eat-in kitchen; Storm and screen window features; Full basement; 7 total rooms
- Laundry & utility: Dedicated laundry room
Neighborhood map
What this means for you Summary
Snapshot
- This is a 3-bed/2.0-bath single-family listed at $145k.
Deal economics
- At list price, monthly cash flow is $615 ($7k/yr) — positive.
- The deal already cash-flows at list — no discount required.
- Meets the 1% rule at list price ($2k rent vs $145k).
- Cap rate 11.8% vs local median 4.6% in Allegan — top-decile yield for the area; either an underpriced asset or a hidden risk that comps aren't pricing in. Stress-test before assuming the spread holds.
Location & tenants
- Location reads 70/100 on livability (#318 in MI) — a middle-class / working-renter tenant base. Strengths: crime A+, cost of living A+, housing A+; Watch: schools D+, employment D+, amenities F.
- Allegan Public Schools (town): math 26% / reading 37% proficiency, ranked #338 of 540 in MI (top 63%) — families likely to look elsewhere, expect single-tenant / working-renter base with shorter leases.
- Market conditions: 183 active listings in the ZIP; 7 comparable units currently listed for rent nearby; rentals lingering (median 44d on market — plan ~5-8 weeks vacancy on turnover, expect pricing pressure); 57% of comp listings sitting > 30 days — soft ceiling on asking rent; 419 units permitted in Allegan County in 2024 (0 in 5+ unit buildings).
Forward outlook
- Local home prices are declining (-3.0%/yr); year-one equity from $1k of loan paydown is wiped out by about $4k of value loss. Plan a longer hold.
- At projected returns (-3.0% appreciation + 3.0% rent growth), your $41k cash investment doubles in ~7 years — after that, you're playing with house money.
Negotiation context
- Only 4 days on market — expect competitive offers; lowballing is unlikely to land.
- 14 sale attempts since 32y ago with the ask held roughly flat each time — persistent listings suggest the price (not the market) is what's stuck; bring a comps-based counter.
Risks & watch-outs
- Watch-outs: flood insurance adds $56/mo; built in 1940 — expect roof / HVAC / electrical / plumbing capex.
- Climate carrying-cost: severe flood risk — expect insurance premiums to compound above CPI over the hold.
Questions for the listing agent
- Built in 1940 — when were the roof, HVAC, electrical panel, plumbing, and water heater last replaced?
- What's the actual annual flood-insurance premium (NFIP or private), and is the property in a SFHA with mandatory coverage?
- Is there a deadline driving the sale (1031 exchange, divorce, estate, relocation)? That informs how much negotiation room exists.
- Schools are D-rated, which usually means shorter tenancies and higher turnover. Who's the typical renter profile here, and what's been the actual vacancy rate?
- What's the average days-on-market for RENTAL listings here right now (not sales)? A rising rental-DOM trend means longer vacancies and softer asking-rent achievability than the comps imply.
- What's the recent tenant-quality profile in this submarket — average credit score on applications, eviction rate, late-payment / NSF rate, and stable-employment percentage? A property-management company in the area should have these aggregated.
- How much new for-sale + rental construction is in the pipeline within 1–3 miles? Heavy new supply typically softens prices + rents 12–24 months out; constrained supply supports both.
Investment metrics
- 1% rule
- 1.46% ✓
- Cap rate
- 11.85%
- Cash-on-cash
- 19.83%
- DSCR
- 1.88
- GRM
- 5.7
CMA / ARV
- ARV (on-the-fly)
- $222,180
- Comps found
- 12
Show comp detail 12 sales within ~0.75 mi
| Address | Dist | Beds/Ba | Sqft | Sold | Price | $/sf | Match |
|---|---|---|---|---|---|---|---|
| 231 Monroe St | 0.03mi | 3/2.0 | 1,648 (+2%) | 9mo | $250,000 | $152 | 87 |
| 412 Hastings St | 0.26mi | 3/1.5 | 1,664 (+3%) | 1mo | $244,000 | $147 | 80 |
| 319 Pine St | 0.32mi | 3/1.5 | 1,596 (-1%) | 7mo | $215,000 | $135 | 76 |
| 223 North St | 0.28mi | 3/1.5 | 1,512 (-6%) | 2mo | $158,000 | $104 | 73 |
| 608 Trowbridge St | 0.34mi | 3/2.0 | 1,536 (-5%) | 11mo | $225,000 | $146 | 67 |
| 211 Western Ave | 0.49mi | 4/1.5 (+1) | 1,591 (-1%) | 1mo | $220,000 | $138 | 67 |
| 215 James St | 0.52mi | 3/1.0 | 1,591 (-1%) | 7mo | $195,000 | $123 | 64 |
| 123 Terrace St | 0.43mi | 3/1.0 | 1,528 (-5%) | 5mo | $200,000 | $131 | 63 |
| 225 Ida St | 0.62mi | 4/2.0 (+1) | 1,620 (+1%) | 7mo | $225,000 | $139 | 59 |
| 557 Ely St | 0.67mi | 3/1.0 | 1,658 (+3%) | 2mo | $226,000 | $136 | 58 |
| 345 Grand St | 0.43mi | 3/1.5 | 1,807 (+12%) | 10mo | $299,900 | $166 | 49 |
| 120 Knapp St | 0.71mi | 4/2.0 (+1) | 1,710 (+6%) | 8mo | $221,500 | $130 | 45 |
Match score weights: distance 35% · size 25% · config 20% · recency 20%. Top-matched comps best support the ARV.
Projected returns pro-forma
-3.0% appreciation · 3.0% rent growth · sell at horizon
- IRR
- 9.8%
- Equity multiple
- 1.39×
- Total profit
- $15,762
- Equity at exit
- $21,620
- IRR
- 19.0%
- Equity multiple
- 2.59×
- Total profit
- $64,460
- Equity at exit
- $12,537
Cash invested: $40,600 (down + closing). Projections, not guarantees.
Landlord ↔ Tenant lean methodology
- Overall (STATE)
- 62 Landlord-Friendly
- State Michigan
- 62 Landlord-Friendly · EVEN
- County
- — inherits STATE
- City
- — inherits STATE
ZIP-level market 49010
- Home prices YoY
- -34.3%
- Active inventory
- 183
- Price-to-rent
- 5.7×
Monthly cashflow live
- Estimated rent
- $2,118 high interval (Pro) →
- Mortgage (P&I)
- −$760
- Tax est. 1.5%
- −$181 /mo · $2,175/yr
- Insurance
- −$60
- Flood insurance flood zone
- −$56 /mo · $666/yr
- HOA
- −$0
- Vacancy / Maint / Mgmt
- −$445
- Net cashflow
- $615
Break-even live
UW: 25.0% down · 7.5% · 30yr · 1.5% tax · 5.0% vac · 8.0% maint · 8.0% mgmt
Financing live
Cash to close
- Down payment
- $36,250
- Closing costs
- $4,350
- Reserves months
- —
- Total cash needed
- —
Loan-product check · same deal, 3 products live
Conventional
25% down · 7.5% · 30yr
- Down + closing
- —
- Monthly P&I
- —
- Monthly cashflow
- —
- DSCR
- —
- Eligible?
- —
Personal DTI + credit; lowest rate.
DSCR
20% down · 8.5% · 30yr
- Down + closing
- —
- Monthly P&I
- —
- Monthly cashflow
- —
- DSCR
- —
- Eligible?
- —
No personal income docs; deal must DSCR.
Hard money
10% down · 12.0% · 12mo
- Down + closing
- —
- Monthly P&I
- —
- Monthly cashflow
- —
- DSCR
- —
- Eligible?
- —
Short-term bridge; refi at stabilization.
Rent comps 7 comps
| Address | Beds | Baths | Sqft | Rent | $/sqft | DOM | Units | Dist |
|---|---|---|---|---|---|---|---|---|
| 201 Monroe St Unit 1 Allegan, MI | 3.0 | 2.0 | 1700 | $2,000 | $1.18 | 20d | 1 | 0.08mi |
| 364 Sherman St Allegan, MI | 3.0 | 2.5 | 1800 | $2,495 | $1.39 | 20d | 1 | 0.78mi |
| 364 Sherman St Allegan, MI | 3.0 | 2.5 | 1800 | $2,795 | $1.55 | 43d | 1 | 0.78mi |
| 366 Sherman St Allegan, MI | 4.0 | 2.5 | 1910 | $2,295 | $1.20 | 43d | 1 | 0.78mi |
| 366 Sherman St Allegan, MI | 4.0 | 2.5 | 1910 | $2,195 | $1.15 | 20d | 1 | 0.78mi |
| 3228 Babylon Rd Allegan, MI | 2.0 | 1.0 | 1200 | $1,750 | $1.46 | 43d | 1 | 1.25mi |
| 3240 Babylon Rd Allegan, MI | 4.0 | 1.0 | 1700 | $1,900 | $1.12 | 43d | 1 | 1.30mi |
Listing history 5 events
-
2026-06-12statusdays on market $145,000 Pending 4 DOM
-
2026-06-09days on market $145,000 Active 3 DOM
-
2026-06-08days on market $145,000 Active 2 DOM
-
2026-06-07remarks 640-char remark
-
2026-06-07$145,000 Active 1 DOM
ⓘ Source: listings_history table (triggers on properties + properties_extension) + one-shot
backfill from property_details.listing_events for pre-trigger history.
Climate risk First Street
- Flood 10/10 Extreme FEMA zone X (unshaded) · 99% chance over 30 yrs
- Wildfire 1/10 Low
- Heat 2/10 Low 7 d/yr ≥97°F today · 16 d/yr by 30 yrs out
- Wind 2/10 Low
- Air quality 3/10 Moderate 2 unhealthy d/yr today · 3 by 30 yrs out
Nearby sold comps map
Loading sold comps map…
Walkable amenities ~0.75 mi
Loading nearby amenities…
Taxation est. · year 1
- Rental income
- $25,412
- − Mortgage interest
- −$8,122
- − Property taxes
- −$2,175
- − Insurance
- −$1,392
- − Repairs & maintenance
- −$2,033
- − Management
- −$2,033
- − Depreciation
- −$4,218
- Taxable income
- $5,439
- Est. tax owed @ 24.0%
- −$1,305
- After-tax cash flow
- $6,079/yr
For passive investors: Depreciation is non-cash, so a rental often shows a tax loss while cash-flowing — sheltering income. Rental losses are passive: they offset passive income freely, and up to $25,000/yr can offset ordinary (W-2) income if you actively participate and your MAGI is under $100k (phasing out to $0 by $150k); unused losses carry forward. On sale, claimed depreciation is recaptured at up to 25%, and gains may owe capital-gains tax (a 1031 exchange can defer both). Figures are a year-1 estimate at your 24.0% rate — not tax advice; consult a CPA.
Schools (NCES district)
- District
- Allegan Public Schools
- NCES district ID
- 2602220
- Math proficiency
- 26% ▼ -8.00%
- Reading proficiency
- 37% ▼ -7.00%
- Median HH income
- $48,602
- Composite
- 27.27/100
- National rank
- #7008
- State rank
- #338 of 540 in MI
Livability — Allegan
- Score
- 70/100
- State rank
- #318
- US rank
- #7767
Category grades
Schools grade is shown separately in the Schools card above.
Census & demographics
- Census place
- Allegan, MI
- Population (ZIP)
- 18,394
Population outlook (Allegan County) Hauer SSP2
- Today (2025)
- 120,251 people
- By 2030
- 122,204 · +1.6%
- By 2040
- 123,979 · +3.1%
- By 2050
- 122,340 · +1.7%
- By 2075
- 116,088 · -3.5%
- By 2100
- 98,461 · -18.1%
Race, ethnicity, and origin ACS 2023
- Neighborhood character
- Predominantly White (87%)
- Race & ethnicity
- White 87% Two or more races 8% Hispanic / Latino 5% Black 1%
- Common ancestry
- Iranian 10% Romanian 4% Italian 2%
- Foreign-born
- 2% · Canada, China
- Languages at home
- 98% English-only · Spanish 2%
Political lean MEDSL · Allegan
- 2024 margin
- Strong R (+27.2) · D 35.7% · R 62.9% · Other 1.5%
- 2008→2024 swing
- -16.5pp toward R · 2008: -10.7pp · 2024: -27.2pp
- All cycles
- 2024: R+27.2 2020: R+25.2 2016: R+28.8 2012: R+19.2 2008: R+10.7
Not yet ingested
- Civics
- —
Market trends
- HPI YoY
- ▼ -136.08%
- Current HPI
- 260.4976
- Rent YoY
- —
- Metro
- —
- State GDP YoY
- ▲ 1.37%
- F500 in state
- 28
Industry mix (Fortune 500 HQ in MI)
| Industry | F500 HQs | Revenue |
|---|---|---|
| Automotive Parts | 3 | $48B |
|
||
| Automotive | 2 | $372B |
|
||
| Chemicals | 1 | $45B |
|
||
| Automotive Retail | 1 | $29B |
|
||
| Healthcare / Medical Devices | 1 | $23B |
|
||
| Automotive Technology | 1 | $20B |
|
||
Price history
+291.9% since first listed30 events — show timeline
- 2026-06-06 Listed $145,000 REALCOMP
- 2026-06-06 Listed $145,000 SW Michigan MLS
- 2026-06-06 Listed $145,000 MiRealSource-MiMLS
- 2025-06-30 Sold (Public Records) $148,000 Public Records
- 2025-06-25 Sold (MLS) $148,000 MiRealSource-MiMLS
- 2025-06-25 Sold (MLS) $148,000 SW Michigan MLS
- 2025-06-25 Sold (MLS) $148,000 REALCOMP
- 2025-06-03 Pending — MiRealSource-MiMLS
- 2025-06-03 Pending — REALCOMP
- 2025-06-03 Pending — SW Michigan MLS
- 2025-05-30 Listed $135,000 REALCOMP
- 2025-05-29 Listed $135,000 MiRealSource-MiMLS
- 2025-05-29 Listed $135,000 SW Michigan MLS
- 2014-09-15 Listing Removed — SW Michigan MLS
- 2014-09-15 Listing Removed — SW Michigan MLS
- 2008-07-24 Sold (Public Records) $53,500 Public Records
- 2008-07-15 Sold (MLS) $53,500 REALCOMP
- 2008-07-15 Sold (MLS) $53,500 SW Michigan MLS
- 2008-04-21 Listed $59,900 REALCOMP
- 2008-04-21 Listed $59,900 SW Michigan MLS
- 2008-04-09 Listing Removed — REALCOMP
- 2007-10-09 Listed $59,900 REALCOMP
- 2007-10-09 Listed $59,900 SW Michigan MLS
- 1998-04-04 Listing Removed — REALCOMP
- 1998-02-04 Listed $67,000 REALCOMP
- 1998-02-04 Listed $67,000 SW Michigan MLS
- 1994-05-13 Sold (MLS) $37,000 REALCOMP
- 1994-05-13 Sold (MLS) $37,000 SW Michigan MLS
- 1994-05-09 Listed $37,000 REALCOMP
- 1994-05-09 Listed $37,000 SW Michigan MLS
Cash-flow waterfall
monthlySold comps — $/sqft
last 12 mo · ≤1 miLoading sold comps…