619 Sea Gull Dr W · Micco, FL
Flood risk 1/10 · Minimal
- FEMA flood zone
- X (unshaded)
- Chance of flooding over 30 yrs
- 0.0%
- Est. flood insurance / yr
- $507 – $1,088
Fire risk 5/10 · Moderate
- Est. fire insurance / yr
- $947 – $1,759
Heat risk 10/10 · Severe
- Hot days now (above 105°F)
- 7 days/yr
- Hot days in 30 yrs
- 24 days/yr
Wind risk 10/10 · Severe
- Chance of severe wind over 30 yrs
- 99.0%
Air-quality risk 1/10 · Minimal
- Unhealthy air days now
- 0 days/yr
- Unhealthy air days in 30 yrs
- 0 days/yr
Risk factors via First Street. Map © Google.
Why this score? — see what drove the C- grade
The composite is a weighted blend of 9 inputs, each scored 0–100. Each bar is that input's sub-score; the figure is the points it added to the 100-point composite (weight × sub-score).
- Cash flow +19.0/30.0
- ARV discount +7.5/15.0
- DSCR +6.0/10.0
- 1% rule +5.4/10.0
- Schools +4.7/10.0
- Livability +3.2/5.0
- Rent growth +2.5/5.0
- Condition / age +2.5/5.0
- Appreciation +0.0/10.0
$149,000
🖨 Deal sheet (PDF) 📄 Offer letter ✓ Due diligence
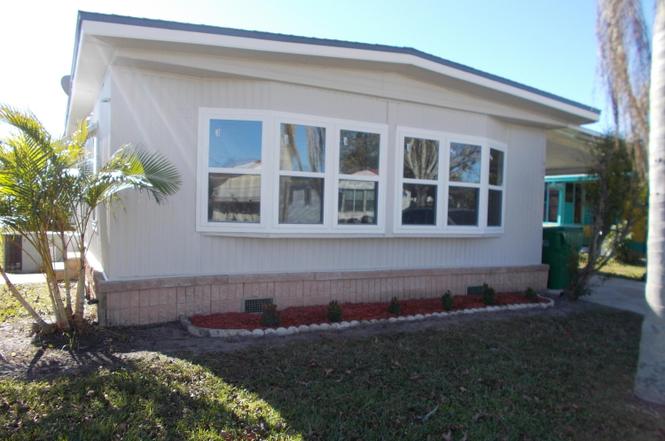
Listing remarks
Beautiful location within easy walking distance to main clubhouse and pool area Home has had a complete remodel with new kitchen cabinets, new flooring, new bathroom fixtures, newer appliances , freshly painted throughout
Key facts
- New flooring
- Newer appliances
- Freshly painted
Tags
Neighborhood map
What this means for you Summary
Snapshot
- This is a 2-bed/2.0-bath manufactured listed at $149k.
Deal economics
- At list price, monthly cash flow is $157 ($2k/yr) — positive.
- The deal already cash-flows at list — no discount required.
- Meets the 1% rule at list price ($2k rent vs $149k).
- Recommended offer: $131k (12.0% below list) — sets the bar for market timing.
Location & tenants
- Location reads 65/100 on livability (#633 in FL) — a middle-class / working-renter tenant base. Strengths: cost of living A+, housing A+; Watch: employment D, amenities F, commute F.
- Brevard (suburban): math 53% / reading 57% proficiency, ranked #19 of 73 in FL (top 26%) — acceptable for families but not a draw, mixed tenant base, ~2y average lease.
- Zoned schools: Sunrise Elementary School (math 52% / reading 57%, grade C, #892 of 2,144 statewide, top 44%, 759 students, 58% FRL); Bayside High School (math 27% / reading 40%, grade F, #400 of 667 statewide, top 61%, 1,854 students, 51% FRL).
- Market conditions: 185 active listings in the ZIP; 8 comparable units currently listed for rent nearby; rentals at typical pace (median 24d on market — plan ~3-4 weeks tenant-placement turnaround); 4,602 units permitted in Brevard County in 2024 (702 in 5+ unit buildings).
Forward outlook
- Local home prices are declining (-3.0%/yr); year-one equity from $1k of loan paydown is wiped out by about $4k of value loss. Plan a longer hold.
- Brevard County population projected at +15% by 2050 — modest demand growth; plan on rents tracking national, not racing it.
Negotiation context
- It's been on market 353 days — a 12% lower offer ($131k) is reasonable based on typical stale-listing flexibility.
- 4 sale attempts; this cycle's ask has dropped $12k (8%) from the opening price — seller is motivated, your offer sets the floor, not the list.
Risks & watch-outs
- Climate carrying-cost: severe wind risk, 99% chance of damaging wind over 30y; moderate wildfire risk; extreme-heat days projected 7→24/yr by 2055 (HVAC capex compounding) — expect insurance premiums to compound above CPI over the hold.
Questions for the listing agent
- It's been on market 353 days. Have you received any prior offers? Is the seller open to a 12% concession, seller financing, or rate buy-down credit?
- Why hasn't it sold? Are there any deal-killer items the seller is aware of (foundation, flood, title, zoning, code violations)?
- Is there a deadline driving the sale (1031 exchange, divorce, estate, relocation)? That informs how much negotiation room exists.
- Schools are F-rated, which usually means shorter tenancies and higher turnover. Who's the typical renter profile here, and what's been the actual vacancy rate?
- What's the average days-on-market for RENTAL listings here right now (not sales)? A rising rental-DOM trend means longer vacancies and softer asking-rent achievability than the comps imply.
- What's the recent tenant-quality profile in this submarket — average credit score on applications, eviction rate, late-payment / NSF rate, and stable-employment percentage? A property-management company in the area should have these aggregated.
- How much new for-sale + rental construction is in the pipeline within 1–3 miles? Heavy new supply typically softens prices + rents 12–24 months out; constrained supply supports both.
Investment metrics
- 1% rule
- 1.04% ✓
- Cap rate
- 7.56%
- Cash-on-cash
- 4.51%
- DSCR
- 1.20
- GRM
- 8.1
CMA / ARV
No comps found within radius.
Projected returns pro-forma
-3.0% appreciation · 3.0% rent growth · sell at horizon
- IRR
- -9.2%
- Equity multiple
- 0.66×
- Total profit
- $-14,120
- Equity at exit
- $22,216
- IRR
- 0.3%
- Equity multiple
- 1.02×
- Total profit
- $732
- Equity at exit
- $12,883
Cash invested: $41,720 (down + closing). Projections, not guarantees.
Landlord ↔ Tenant lean methodology
- Overall (STATE)
- 87 Strongly Landlord-Friendly
- State Florida
- 87 Strongly Landlord-Friendly · R+3
- County
- — inherits STATE
- City
- — inherits STATE
ZIP-level market 32976
- Home prices YoY
- -18.6%
- Active inventory
- 185
- Price-to-rent
- 8.1×
Monthly cashflow live
- Estimated rent
- $1,542 high interval (Pro) →
- Mortgage (P&I)
- −$781
- Tax from tax record
- −$218 /mo · $2,618/yr
- Insurance
- −$62
- HOA
- −$0
- Vacancy / Maint / Mgmt
- −$324
- Net cashflow
- $157
Break-even live
Sensitivity live
| Price | -10% $241 | -5% $199 | +0% $157 | +5% $115 | +10% $72 |
|---|---|---|---|---|---|
| Rent | -10% $35 | -5% $96 | +0% $157 | +5% $218 | +10% $279 |
| Rate | -1.0pp $232 | -0.5pp $195 | base $157 | +0.5pp $118 | +1.0pp $79 |
UW: 25.0% down · 7.5% · 30yr · 1.5% tax · 5.0% vac · 8.0% maint · 8.0% mgmt
Financing live
Cash to close
- Down payment
- $37,250
- Closing costs
- $4,470
- Reserves months
- —
- Total cash needed
- —
Loan-product check · same deal, 3 products live
Conventional
25% down · 7.5% · 30yr
- Down + closing
- —
- Monthly P&I
- —
- Monthly cashflow
- —
- DSCR
- —
- Eligible?
- —
Personal DTI + credit; lowest rate.
DSCR
20% down · 8.5% · 30yr
- Down + closing
- —
- Monthly P&I
- —
- Monthly cashflow
- —
- DSCR
- —
- Eligible?
- —
No personal income docs; deal must DSCR.
Hard money
10% down · 12.0% · 12mo
- Down + closing
- —
- Monthly P&I
- —
- Monthly cashflow
- —
- DSCR
- —
- Eligible?
- —
Short-term bridge; refi at stabilization.
Rent comps 8 comps
| Address | Beds | Baths | Sqft | Rent | $/sqft | DOM | Units | Dist |
|---|---|---|---|---|---|---|---|---|
| 629 W Marlin Cir Unit NA Sebastian, FL | 2.0 | 2.0 | 1104 | $1,400 | $1.27 | 14d | 1 | 0.28mi |
| 410 Osprey Dr Sebastian, FL | 2.0 | 1.5 | 672 | $1,350 | $2.01 | 24d | 1 | 0.44mi |
| 7629 Chasta Rd Sebastian, FL | 2.0 | 2.0 | 958 | $1,600 | $1.67 | 24d | 1 | 0.52mi |
| 914 Pecan Cir Sebastian, FL | 2.0 | 1.0 | 1000 | $1,600 | $1.60 | 24d | 1 | 0.55mi |
| 7597 Cedar Bark Rd Sebastian, FL | 2.0 | 2.0 | 902 | $1,700 | $1.88 | 24d | 1 | 0.56mi |
| 706 Hyacinth Cir Sebastian, FL | 2.0 | 2.0 | 1062 | $1,750 | $1.65 | 24d | 1 | 0.78mi |
| 1207 Marigold Dr Sebastian, FL | 2.0 | 2.0 | 1104 | $1,500 | $1.36 | 24d | 1 | 0.83mi |
| 8520 US Highway 1 #10 Sebastian, FL | 2.0 | 2.0 | 1091 | $1,800 | $1.65 | 24d | 1 | 1.17mi |
Listing history 14 events
-
2026-05-06soldstatus $145,000
-
2026-04-03status Pending
-
2026-04-01status Active
-
2026-03-31historical
-
2026-01-05price $149,000
-
2026-01-05status Active
-
2026-01-05price $149
-
2025-12-31historical
-
2025-08-01status Active
-
2025-07-31historical
-
2025-04-07$161,500 Active
-
2018-12-21soldstatus $59,000
-
1994-04-08soldstatus $37,900
-
1983-07-01soldstatus $7,000
ⓘ Source: listings_history table (triggers on properties + properties_extension) + one-shot
backfill from property_details.listing_events for pre-trigger history.
Tax reassessment forecast FL · Resets to sale price
- Current annual tax
- $2,618 · $218/mo
- Projected year-2 tax
- $2,618 · $218/mo
- Expected delta
- $0/yr ($0/mo · 0.0%)
ⓘ Screening estimate from a state-policy table — verify with the county assessor before closing.
Climate risk First Street
- Flood 1/10 Low FEMA zone X (unshaded) · 0% chance over 30 yrs
- Wildfire 5/10 Major
- Heat 10/10 Extreme 7 d/yr ≥105°F today · 24 d/yr by 30 yrs out
- Wind 10/10 Extreme 99% chance of damaging wind over 30 yrs
- Air quality 1/10 Low 0 unhealthy d/yr today · 0 by 30 yrs out
Nearby sold comps map
Loading sold comps map…
Walkable amenities ~0.75 mi
Loading nearby amenities…
Taxation est. · year 1
- Rental income
- $18,506
- − Mortgage interest
- −$8,346
- − Property taxes
- −$2,618
- − Insurance
- −$745
- − Repairs & maintenance
- −$1,480
- − Management
- −$1,480
- − Depreciation
- −$4,335
- Taxable loss
- −$498
- Est. tax savings @ 24.0%
- +$120
- After-tax cash flow
- $2,000/yr
For passive investors: Depreciation is non-cash, so a rental often shows a tax loss while cash-flowing — sheltering income. Rental losses are passive: they offset passive income freely, and up to $25,000/yr can offset ordinary (W-2) income if you actively participate and your MAGI is under $100k (phasing out to $0 by $150k); unused losses carry forward. On sale, claimed depreciation is recaptured at up to 25%, and gains may owe capital-gains tax (a 1031 exchange can defer both). Figures are a year-1 estimate at your 24.0% rate — not tax advice; consult a CPA.
Schools (NCES district)
- District
- Brevard
- NCES district ID
- 1200150
- Math proficiency
- 53% ▼ -9.00%
- Reading proficiency
- 57% ▼ -4.00%
- Median HH income
- $49,426
- Composite
- 46.86/100
- National rank
- #2370
- State rank
- #19 of 73 in FL
Livability — Micco
- Score
- 65/100
- State rank
- #633
- US rank
- #12408
Category grades
Schools grade is shown separately in the Schools card above.
Census & demographics
- Census place
- Micco, FL
- Population (ZIP)
- 9,237
Population outlook (Brevard County) Hauer SSP2
- Today (2025)
- 623,254 people
- By 2030
- 648,420 · +4.0%
- By 2040
- 690,009 · +10.7%
- By 2050
- 715,669 · +14.8%
- By 2075
- 775,744 · +24.5%
- By 2100
- 776,687 · +24.6%
Race, ethnicity, and origin ACS 2023
- Neighborhood character
- Predominantly White (93%)
- Race & ethnicity
- White 93% Hispanic / Latino 4% Two or more races 1% Asian 1%
- Common ancestry
- Lithuanian 5% Romanian 4% Iranian 2%
- Foreign-born
- 4% · Canada, Jamaica
- Languages at home
- 95% English-only · Spanish 3%
Political lean MEDSL · Brevard
- 2024 margin
- Strong R (+20.8) · D 39.1% · R 59.9% · Other 1.0%
- 2008→2024 swing
- -10.4pp toward R · 2008: -10.4pp · 2024: -20.8pp
- All cycles
- 2024: R+20.8 2020: R+16.4 2016: R+19.8 2012: R+12.7 2008: R+10.4
Not yet ingested
- Civics
- —
Market trends
- HPI YoY
- ▼ -73.57%
- Current HPI
- 321.5196
- Rent YoY
- —
- Metro
- —
- State GDP YoY
- ▲ 3.28%
- F500 in state
- 36
Industry mix (Fortune 500 HQ in FL)
| Industry | F500 HQs | Revenue |
|---|---|---|
| Industrial Technology | 2 | $29B |
|
||
| Insurance | 2 | $17B |
|
||
| Retail | 1 | $60B |
|
||
| Technology Distribution | 1 | $58B |
|
||
| Homebuilding | 1 | $35B |
|
||
| Technology Manufacturing | 1 | $35B |
|
||
Price history
+1971.4% since first listed14 events — show timeline
- 2026-05-06 Sold (Public Records) $145,000 Public Records
- 2026-04-03 Pending — SCMLS
- 2026-04-01 Relisted — SCMLS
- 2026-03-31 Listing Removed — SCMLS
- 2026-01-05 Price Changed $149,000 SCMLS
- 2026-01-05 Relisted — SCMLS
- 2026-01-05 Price Changed $149 SCMLS
- 2025-12-31 Listing Removed — SCMLS
- 2025-08-01 Relisted — SCMLS
- 2025-07-31 Listing Removed — SCMLS
- 2025-04-07 Listed $161,500 SCMLS
- 2018-12-21 Sold (Public Records) $59,000 Public Records
- 1994-04-08 Sold (Public Records) $37,900 Public Records
- 1983-07-01 Sold (Public Records) $7,000 Public Records
Property tax history
+14.0%/yrLatest (2025): $2,618 · +3.6% YoY. Source: county tax records.
Cash-flow waterfall
monthlySold comps — $/sqft
last 12 mo · ≤1 miLoading sold comps…