22026 Matera Vista Ln · Houston, TX
Flood risk No data
- FEMA flood zone
- —
- Chance of flooding over 30 yrs
- —
- Est. flood insurance / yr
- —
Fire risk No data
- Est. fire insurance / yr
- —
Heat risk No data
- Hot days now (above threshold)
- —
- Hot days in 30 yrs
- —
Wind risk No data
- Chance of severe wind over 30 yrs
- —
Air-quality risk No data
- Unhealthy air days now
- —
- Unhealthy air days in 30 yrs
- —
Risk factors via First Street. Map © Google.
Why this score? — see what drove the D- grade
The composite is a weighted blend of 9 inputs, each scored 0–100. Each bar is that input's sub-score; the figure is the points it added to the 100-point composite (weight × sub-score).
- ARV discount +10.6/15.0
- Cash flow +10.1/30.0
- Condition / age +4.0/5.0
- Livability +3.7/5.0
- 1% rule +3.4/10.0
- DSCR +2.9/10.0
- Schools +2.9/10.0
- Rent growth +2.1/5.0
- Appreciation +0.0/10.0
$299,990
🖨 Deal sheet 📄 Offer letter ✓ Due diligence
Listing remarks MLS
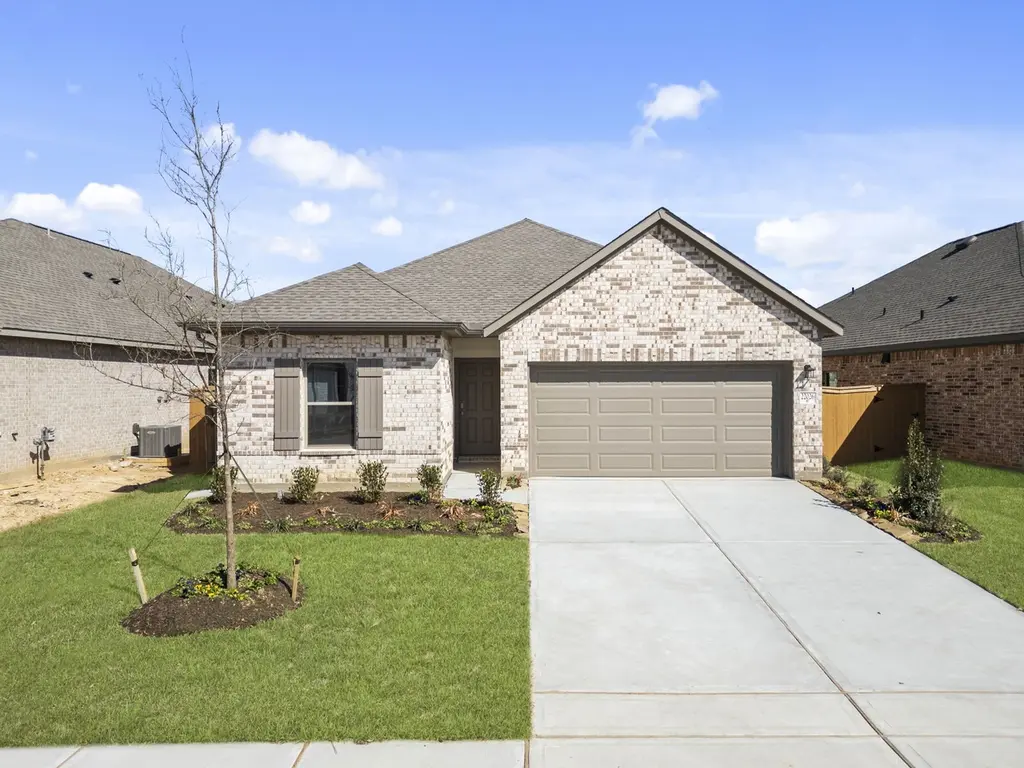
This elegant one-story home offers 4 spacious bedrooms, 2 full baths, a covered patio, and a generous backyard—all wrapped in durable brick on all sides for timeless curb appeal. The professionally curated interior design adds a polished, modern touch throughout. Located in Cypress Green, a scenic 646-acre master-planned community in Hockley, TX, residents enjoy a peaceful setting, access to highly acclaimed Waller ISD schools, and a wide range of resort-style amenities including a pool, splashpad, waterpark, sports courts, and dog park. Don’t wait—make this exceptional home yours today!
Key facts
- Access to schools
- Covered patio
- Sports courts
Tags
Neighborhood map
What this means for you Summary
Snapshot
- This is a 4-bed/2.0-bath single-family listed at $300k. Condition is rated good.
Deal economics
- At list price, monthly cash flow is $-173 ($-2k/yr) — negative.
- To cash-flow at today's rent, offer at most $275k (8.3% below list).
- To meet the 1% rule (rent ≥ 1% of price), the offer needs to be $251k (16.3% below list).
- Recommended offer: $251k (16.3% below list) — sets the bar for 1% rule.
- Cap rate 5.6% vs local median 3.2% in Houston — top-decile yield for the area; either an underpriced asset or a hidden risk that comps aren't pricing in. Stress-test before assuming the spread holds.
Location & tenants
- Location reads 74/100 on livability (#184 in TX, #4,771 nationally) — a middle-class / working-renter tenant base. Strengths: amenities A+, cost of living A+, housing A+; Watch: schools D, crime F.
- Waller ISD (rural): math 30% / reading 35% proficiency, ranked #532 of 826 in TX (top 64%) — families likely to look elsewhere, expect single-tenant / working-renter base with shorter leases.
- Market conditions: Rents soft (-1.6%/yr); 1782 active listings in the ZIP; 8 comparable units currently listed for rent nearby; rentals leasing fast (median 3d on market — plan ~1-2 weeks tenant-placement turnaround); high-income renter base; 29,883 units permitted in Harris County in 2024 (8,621 in 5+ unit buildings).
Forward outlook
- Local home prices are declining (-3.0%/yr); year-one equity from $2k of loan paydown is wiped out by about $9k of value loss. Plan a longer hold.
- Harris County population projected at +47% by 2050 — long-run rental-demand tailwind backs the buy-and-hold thesis.
Negotiation context
- It's been on market 63 days — a 6% lower offer ($282k) is reasonable based on typical stale-listing flexibility.
- 2 sale attempts; this cycle's ask has dropped $35k (10%) from the opening price — seller is motivated, your offer sets the floor, not the list.
Questions for the listing agent
- What do current leases actually rent for vs. the listed asking? Can we see a recent rent roll and the last 12 months of T-12 income?
- It's been on market 63 days. Have you received any prior offers? Is the seller open to a 16% concession, seller financing, or rate buy-down credit?
- What does the HOA fee cover, when was the last increase, and are there any pending special assessments or reserve-fund shortfalls?
- Why hasn't it sold? Are there any deal-killer items the seller is aware of (foundation, flood, title, zoning, code violations)?
- Is there a deadline driving the sale (1031 exchange, divorce, estate, relocation)? That informs how much negotiation room exists.
- Schools are D-rated, which usually means shorter tenancies and higher turnover. Who's the typical renter profile here, and what's been the actual vacancy rate?
- Crime grade is F in this area — have there been break-ins, vandalism, or insurance claims at this property in the last 3 years? What carrier currently insures it and at what premium?
- The area grade is low — what's the realistic commute time and amenity access for the typical tenant pool here? Any planned neighborhood developments (good or bad) we should know about?
- What's the average days-on-market for RENTAL listings here right now (not sales)? A rising rental-DOM trend means longer vacancies and softer asking-rent achievability than the comps imply.
- What's the recent tenant-quality profile in this submarket — average credit score on applications, eviction rate, late-payment / NSF rate, and stable-employment percentage? A property-management company in the area should have these aggregated.
- How much new for-sale + rental construction is in the pipeline within 1–3 miles? Heavy new supply typically softens prices + rents 12–24 months out; constrained supply supports both.
Investment metrics
- 1% rule
- 0.84% ✗
- Cap rate
- 5.60%
- Cash-on-cash
- -2.47%
- DSCR
- 0.89
- GRM
- 10.0
CMA / ARV
- ARV (median comp)
- $322,490
- List price
- $299,990
- Delta
- -6.98%
- Verdict
- FAIR
- Comps
- 20 within 1.0 mi
Show comp detail 12 sales within ~0.75 mi
| Address | Dist | Beds/Ba | Sqft | Sold | Price | $/sf | Match |
|---|---|---|---|---|---|---|---|
| 22026 Matera Vista Ln | 0.00mi | 4/2.0 | 1,759 (0%) | 1mo | $299,990 | $171 | 99 |
| 21639 Carbonari Dr | 0.06mi | 3/2.5 (-1) | 1,749 (-1%) | 1mo | $337,990 | $193 | 89 |
| 22102 La Scorza Dr | 0.09mi | 3/2.0 (-1) | 1,792 (+2%) | 1mo | $324,990 | $181 | 87 |
| 21643 Carbonari Dr | 0.06mi | 4/2.0 | 1,655 (-6%) | 1mo | $333,990 | $202 | 87 |
| 21623 Carbonari Dr | 0.06mi | 4/2.0 | 1,655 (-6%) | 1mo | $328,990 | $199 | 87 |
| 22214 San Lioni Dr | 0.06mi | 4/2.0 | 1,908 (+8%) | 1mo | $333,990 | $175 | 82 |
| 22002 Maddaloni View Dr | 0.06mi | 4/2.0 | 1,922 (+9%) | 1mo | $316,990 | $165 | 81 |
| 22106 La Scorza Dr | 0.08mi | 3/2.0 (-1) | 1,880 (+7%) | 0mo | $307,990 | $164 | 80 |
| 19307 Licola Ln | 0.07mi | 3/2.0 (-1) | 1,627 (-8%) | 0mo | $276,990 | $170 | 79 |
| 21927 Maddaloni View Dr | 0.06mi | 4/2.0 | 2,013 (+14%) | 1mo | $352,990 | $175 | 72 |
| 19071 Cetara Villa Dr | 0.33mi | 3/2.0 (-1) | 1,582 (-10%) | 0mo | $249,990 | $158 | 63 |
| 21002 Echo Manor Dr | 0.73mi | 3/2.0 (-1) | 1,513 (-14%) | 0mo | $262,000 | $173 | 38 |
Match score weights: distance 35% · size 25% · config 20% · recency 20%. Top-matched comps best support the ARV.
Projected returns pro-forma
-3.0% appreciation · 0.0% rent growth · sell at horizon
- IRR
- -23.9%
- Equity multiple
- 0.20×
- Total profit
- $-66,895
- Equity at exit
- $44,729
- IRR
- -31.2%
- Equity multiple
- -0.20×
- Total profit
- $-100,506
- Equity at exit
- $25,938
Cash invested: $83,997 (down + closing). Projections, not guarantees.
Landlord ↔ Tenant lean methodology
- Overall (STATE)
- 87 Strongly Landlord-Friendly
- State Texas
- 87 Strongly Landlord-Friendly · R+5
- County
- — inherits STATE
- City
- — inherits STATE
ZIP-level market 77447
- Home prices YoY
- -31.1%
- Rents YoY
- -1.6%
- Active inventory
- 1782
- Price-to-rent
- 10.0×
Monthly cashflow live
- Estimated rent
- $2,510 high interval (Pro) →
- Mortgage (P&I)
- −$1,573
- Tax est. 1.5%
- −$375 /mo · $4,500/yr
- Insurance
- −$125
- HOA
- −$83
- Vacancy / Maint / Mgmt
- −$527
- Net cashflow
- $-173
Break-even live
UW: 25.0% down · 7.5% · 30yr · 1.5% tax · 5.0% vac · 8.0% maint · 8.0% mgmt
Financing live
Cash to close
- Down payment
- $74,998
- Closing costs
- $9,000
- Reserves months
- —
- Total cash needed
- —
Loan-product check · same deal, 3 products live
Conventional
25% down · 7.5% · 30yr
- Down + closing
- —
- Monthly P&I
- —
- Monthly cashflow
- —
- DSCR
- —
- Eligible?
- —
Personal DTI + credit; lowest rate.
DSCR
20% down · 8.5% · 30yr
- Down + closing
- —
- Monthly P&I
- —
- Monthly cashflow
- —
- DSCR
- —
- Eligible?
- —
No personal income docs; deal must DSCR.
Hard money
10% down · 12.0% · 12mo
- Down + closing
- —
- Monthly P&I
- —
- Monthly cashflow
- —
- DSCR
- —
- Eligible?
- —
Short-term bridge; refi at stabilization.
Rent comps 8 comps
| Address | Beds | Baths | Sqft | Rent | $/sqft | DOM | Units | Dist |
|---|---|---|---|---|---|---|---|---|
| 22215 Scarlino Dr Hockley, TX | 3.0 | 2.0 | 2099 | $2,450 | $1.17 | 22d | 1 | 0.14mi |
| 22222 Opa Glen Dr Hockley, TX | 4.0 | 3.0 | 2609 | $2,850 | $1.09 | 43d | 1 | 0.39mi |
| 20703 Solstice Point Dr Hockley, TX | 3.0 | 2.0 | 1912 | $1,951 | $1.02 | 2d | 1 | 0.54mi |
| 22023 Lost Lantern Dr Hockley, TX | 3.0–4.0 | 2.0 | 1601 | $1,863 | $1.16 | 2d | 1 | 0.61mi |
| 20718 Round Key Dr Hockley, TX | 4.0 | 2.5 | 2133 | $1,931 | $0.91 | 5d | 1 | 0.72mi |
| 21210 Echo Manor Dr Hockley, TX | 4.0 | 2.5 | 2221 | $2,150 | $0.97 | 2d | 1 | 0.85mi |
| 20313 Evergreen Cypress Dr Hockley, TX | 2.0–5.0 | 2.0–3.5 | 2051 | $2,712 | $1.32 | 1d | 1 | 0.92mi |
| 22719 Klingamans Way Hockley, TX | 3.0 | 2.0 | 1416 | $1,689 | $1.19 | 2d | 1 | 0.99mi |
HOA detail
- Monthly dues
- $83 · $996/yr
- Likely covers
- waterpool
Listing history 7 events
-
2026-05-06status Pending 612-char remark
Show marketing remark (612 chars)
This elegant one-story home offers 4 spacious bedrooms, 2 full baths, a covered patio, and a generous backyard—all wrapped in durable brick on all sides for timeless curb appeal. The professionally curated interior design adds a polished, modern touch throughout. Located in Cypress Green, a scenic 646-acre master-planned community in Hockley, TX, residents enjoy a peaceful setting, access to highly acclaimed Waller ISD schools, and a wide range of resort-style amenities including a pool, splashpad, waterpark, sports courts, and dog park. Don’t wait—make this exceptional home yours today!
-
2026-04-29price $299,990 612-char remark
Show marketing remark (612 chars)
This elegant one-story home offers 4 spacious bedrooms, 2 full baths, a covered patio, and a generous backyard—all wrapped in durable brick on all sides for timeless curb appeal. The professionally curated interior design adds a polished, modern touch throughout. Located in Cypress Green, a scenic 646-acre master-planned community in Hockley, TX, residents enjoy a peaceful setting, access to highly acclaimed Waller ISD schools, and a wide range of resort-style amenities including a pool, splashpad, waterpark, sports courts, and dog park. Don’t wait—make this exceptional home yours today!
-
2026-03-19price $309,990 612-char remark
Show marketing remark (612 chars)
This elegant one-story home offers 4 spacious bedrooms, 2 full baths, a covered patio, and a generous backyard—all wrapped in durable brick on all sides for timeless curb appeal. The professionally curated interior design adds a polished, modern touch throughout. Located in Cypress Green, a scenic 646-acre master-planned community in Hockley, TX, residents enjoy a peaceful setting, access to highly acclaimed Waller ISD schools, and a wide range of resort-style amenities including a pool, splashpad, waterpark, sports courts, and dog park. Don’t wait—make this exceptional home yours today!
-
2026-03-04$334,990 Active 612-char remark
Show marketing remark (612 chars)
This elegant one-story home offers 4 spacious bedrooms, 2 full baths, a covered patio, and a generous backyard—all wrapped in durable brick on all sides for timeless curb appeal. The professionally curated interior design adds a polished, modern touch throughout. Located in Cypress Green, a scenic 646-acre master-planned community in Hockley, TX, residents enjoy a peaceful setting, access to highly acclaimed Waller ISD schools, and a wide range of resort-style amenities including a pool, splashpad, waterpark, sports courts, and dog park. Don’t wait—make this exceptional home yours today!
-
2026-03-04historical
Show marketing remark (612 chars)
This elegant one-story home offers 4 spacious bedrooms, 2 full baths, a covered patio, and a generous backyard—all wrapped in durable brick on all sides for timeless curb appeal. The professionally curated interior design adds a polished, modern touch throughout. Located in Cypress Green, a scenic 646-acre master-planned community in Hockley, TX, residents enjoy a peaceful setting, access to highly acclaimed Waller ISD schools, and a wide range of resort-style amenities including a pool, splashpad, waterpark, sports courts, and dog park. Don’t wait—make this exceptional home yours today!
-
2025-12-08price $334,990
-
2025-10-24$344,990 Active
ⓘ Source: listings_history table (triggers on properties + properties_extension) + one-shot
backfill from property_details.listing_events for pre-trigger history.
Nearby sold comps map
Loading sold comps map…
Walkable amenities ~0.75 mi
Loading nearby amenities…
Taxation est. · year 1
- Rental income
- $30,125
- − Mortgage interest
- −$16,804
- − Property taxes
- −$4,500
- − Insurance
- −$1,500
- − Repairs & maintenance
- −$2,410
- − Management
- −$2,410
- − HOA
- −$996
- − Depreciation
- −$8,727
- Taxable loss
- −$7,222
- Est. tax savings @ 24.0%
- +$1,733
- After-tax cash flow
- $-342/yr
For passive investors: Depreciation is non-cash, so a rental often shows a tax loss while cash-flowing — sheltering income. Rental losses are passive: they offset passive income freely, and up to $25,000/yr can offset ordinary (W-2) income if you actively participate and your MAGI is under $100k (phasing out to $0 by $150k); unused losses carry forward. On sale, claimed depreciation is recaptured at up to 25%, and gains may owe capital-gains tax (a 1031 exchange can defer both). Figures are a year-1 estimate at your 24.0% rate — not tax advice; consult a CPA.
Condition & rehab AI · 12 photos
This one-story home in Cypress Green offers a modern and well-maintained interior with a good condition exterior and landscaping. It is located in a master-planned community with resort-style amenities, making it an attractive option for both resale and rental.
Value-add opportunities
- Both Painting the exterior brick — Enhances curb appeal and can increase both resale and rental value.
- Both Landscaping improvements — Enhances curb appeal and can increase both resale and rental value.
- Both Adding smart home features — Improves convenience and can increase both resale and rental value.
- Both Upgrading appliances — Modernizes the kitchen and can increase both resale and rental value.
Renovation cost estimate screening
Value-add ROI direction
- Both Painting the exterior brick — Enhances curb appeal and can increase both resale and rental value. ↑
- Both Landscaping improvements — Enhances curb appeal and can increase both resale and rental value. ↑
- Both Adding smart home features — Improves convenience and can increase both resale and rental value. ↑
- Both Upgrading appliances — Modernizes the kitchen and can increase both resale and rental value. ↑
ⓘ Cost ranges are severity-bucket heuristics (US national rule-of-thumb). Get contractor quotes + a written scope before underwriting a rehab budget.
Schools (NCES district)
- District
- Waller ISD
- NCES district ID
- 4844430
- Math proficiency
- 30% ▼ -23.00%
- Reading proficiency
- 35% ▼ -11.00%
- Median HH income
- $58,911
- Composite
- 29.12/100
- National rank
- #6593
- State rank
- #532 of 826 in TX
Livability — Houston
- Score
- 74/100
- State rank
- #184
- US rank
- #4771
Category grades
Schools grade is shown separately in the Schools card above.
Census & demographics
- County
- Harris County · 4,702,590 people
- City population
- 3,226,434
- Metro
- Houston-The Woodlands-Sugar Land, TX
- Population (ZIP)
- 25,231
- Household income
- $116,925
- Rent vs Own
- Severe rent burden
- 265.0
Population outlook (Harris County) Hauer SSP2
- Today (2025)
- 5,571,493 people
- By 2030
- 6,089,821 · +9.3%
- By 2040
- 7,142,806 · +28.2%
- By 2050
- 8,185,864 · +46.9%
- By 2075
- 10,574,329 · +89.8%
- By 2100
- 12,109,958 · +117.4%
Race, ethnicity, and origin ACS 2023
- Neighborhood character
- Diverse neighborhood (Simpson 0.63)
- Race & ethnicity
- White 44% Hispanic / Latino 41% Two or more races 16% Black 9% Asian 1%
- Hispanic origin (detail)
- Mexican 27%
- Common ancestry
- Lithuanian 3% Slovak 1% Romanian 1%
- Foreign-born
- 15% · Canada, Jamaica, Dominican Republic
- Languages at home
- 69% English-only · Spanish 28% Other Indo-European 1% Vietnamese 1%
Political lean MEDSL · Harris
- 2024 margin
- Lean D (+5.5) · D 52.0% · R 46.4% · Other 1.6%
- 2008→2024 swing
- +3.9pp toward D · 2008: 1.6pp · 2024: 5.5pp
- All cycles
- 2024: D+5.5 2020: D+13.3 2016: D+12.4 2012: D+0.1 2008: D+1.6
Not yet ingested
- Civics
- —
Market trends
- HPI YoY
- ▼ -112.73%
- Current HPI
- 249.6969
- Rent YoY
- ▼ -1.58%
- Metro
- Houston-The Woodlands-Sugar Land, TX
- State GDP YoY
- ▲ 3.95%
- F500 in state
- 110
Industry mix (Fortune 500 HQ in TX)
| Industry | F500 HQs | Revenue |
|---|---|---|
| Energy | 16 | $1,198B |
|
||
| Technology | 5 | $198B |
|
||
| Engineering / Construction | 4 | $72B |
|
||
| Energy Services | 3 | $60B |
|
||
| Utilities | 3 | $41B |
|
||
| Healthcare | 2 | $330B |
|
||
Price history
-13.0% since first listed7 events — show timeline
- 2026-05-06 Pending — HARMLS
- 2026-04-29 Price Changed $299,990 HARMLS
- 2026-03-19 Price Changed $309,990 HARMLS
- 2026-03-04 Listing Removed — HARMLS
- 2026-03-04 Listed $334,990 HARMLS
- 2025-12-08 Price Changed $334,990 HARMLS
- 2025-10-24 Listed $344,990 HARMLS
Cash-flow waterfall
monthlySold comps — $/sqft
last 12 mo · ≤1 miLoading sold comps…