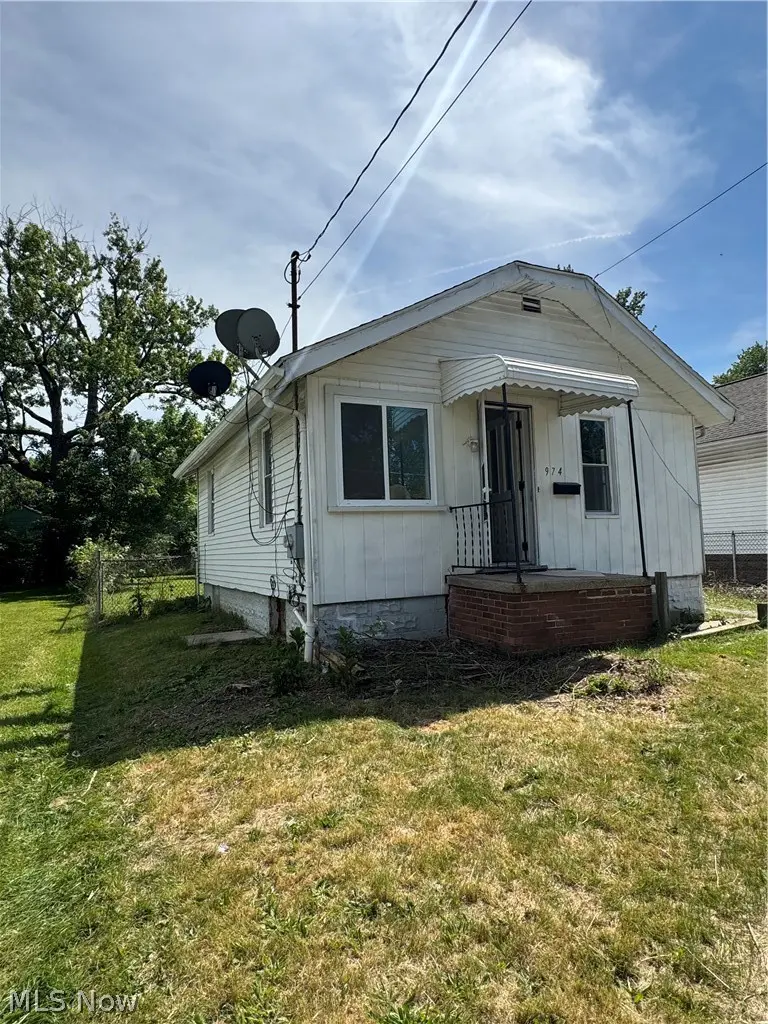
974 Wyley Ave · Akron, OH
Flood risk 1/10 · Minimal
- FEMA flood zone
- X (unshaded)
- Chance of flooding over 30 yrs
- 0.0%
- Est. flood insurance / yr
- $473 – $860
Fire risk 1/10 · Minimal
- Est. fire insurance / yr
- $713 – $1,323
Heat risk 3/10 · Minor
- Hot days now (above 96°F)
- 7 days/yr
- Hot days in 30 yrs
- 17 days/yr
Wind risk 1/10 · Minimal
- Chance of severe wind over 30 yrs
- —
Air-quality risk 2/10 · Minimal
- Unhealthy air days now
- 1 days/yr
- Unhealthy air days in 30 yrs
- 2 days/yr
Risk factors via First Street. Map © Google.
Why this score? — see what drove the C grade
The composite is a weighted blend of 9 inputs, each scored 0–100. Each bar is that input's sub-score; the figure is the points it added to the 100-point composite (weight × sub-score).
- Cash flow +27.8/30.0
- DSCR +9.8/10.0
- 1% rule +7.5/10.0
- Rent growth +4.4/5.0
- Livability +4.0/5.0
- Condition / age +2.5/5.0
- Schools +2.1/10.0
- ARV discount +0.0/15.0
- Appreciation +0.0/10.0
$69,900
🖨 Deal sheet 📄 Offer letter ✓ Due diligence
Listing remarks MLS
Ranch with Full Basement and Detached Garage. Location Convenient to Metro Bus Lines, Freeways, Downtown, Retail and Resturants. Perfect Starter or Investment. Great Winter Project! Contact Listing Agent for additional information. Seller has NO Reports or Disclosures. Property to be sold AS-IS. Buyer is responsible for researching all information, taxes, assessments, certifications, or city orders(IF ANY). * * AGENTS SEE BROKER REMARKS FOR OFFER INSTRUCTIONS. Buyer pays for all inspections and related cost.
Key facts
- Built in desk area
- Double basin sink
- Large yard
Tags
Property features AI
Finance
- Financial info: Annual tax amount listed (not included per instructions)
Exterior
- Parking: Detached asphalt paved garage; 1 garage space
- Utilities: Public water; Public sewer
- Home design: Single-story home; Aluminum and vinyl siding; Block foundation; Asphalt and fiberglass roof; Above-grade finished area approximately 610 (source: assessor)
- Construction: Built (year source: public records)
- Exterior features: Front porch; Chain link fencing; City lot (approx. 41 x 120)
Interior
- Bedrooms: 2 main-level bedrooms
- Bathrooms: 1 full bathroom on the main level
- Heating & cooling: Forced air gas heating
- Interior features: Full unfinished basement; Updated/remodeled condition; Has view
- Laundry & utility: Washer/dryer hookups in basement with electric and gas dryer hookups
Neighborhood map
What this means for you Summary
Snapshot
- This is a 2-bed/1.0-bath single-family listed at $70k.
Deal economics
- At list price, monthly cash flow is $212 ($3k/yr) — positive.
- The deal already cash-flows at list — no discount required.
- Meets the 1% rule at list price ($871 rent vs $70k).
- Cap rate 9.9% vs local median 6.6% in Akron — top-decile yield for the area; either an underpriced asset or a hidden risk that comps aren't pricing in. Stress-test before assuming the spread holds.
Location & tenants
- Location reads 81/100 on livability (#104 in OH, #1,591 nationally) — a professional / high-income tenant draw. Strengths: amenities A+, commute A+, cost of living A+; Watch: crime F, employment F.
- Akron City (urban): math 22% / reading 30% proficiency, ranked #602 of 656 in OH (top 92%) — low school quality limits family demand, transient renter base, plan for 1-2y turnover; 66% free/reduced lunch — lower-income household profile, screen leases tightly.
- Market conditions: Rents rising fast (+7.6%/yr); 69 active listings in the ZIP; 20 comparable units currently listed for rent nearby; rentals lingering (median 44d on market — plan ~5-8 weeks vacancy on turnover, expect pricing pressure); 60% of comp listings sitting > 30 days — soft ceiling on asking rent; lower-income renter base — watch delinquency; 1,114 units permitted in Summit County in 2024 (397 in 5+ unit buildings).
Forward outlook
- Local home prices are declining (-3.0%/yr); year-one equity from $483 of loan paydown is wiped out by about $2k of value loss. Plan a longer hold.
- Summit County population projected to shrink 6% by 2050 — rents likely to lag national; underwrite the cash flow, not the appreciation.
- At projected returns (-3.0% appreciation + 7.6% rent growth), your $20k cash investment doubles in ~7 years — after that, you're playing with house money.
Negotiation context
- Only 12 days on market — expect competitive offers; lowballing is unlikely to land.
- 3 sale attempts since 14y ago with the ask held roughly flat each time — persistent listings suggest the price (not the market) is what's stuck; bring a comps-based counter.
- Current owner paid $9k; list at $70k implies a 685% gain — meaningful room to come down on a strong offer.
Risks & watch-outs
- Watch-outs: built in 1928 — expect roof / HVAC / electrical / plumbing capex.
Questions for the listing agent
- Built in 1928 — when were the roof, HVAC, electrical panel, plumbing, and water heater last replaced?
- Is there a deadline driving the sale (1031 exchange, divorce, estate, relocation)? That informs how much negotiation room exists.
- Crime grade is F in this area — have there been break-ins, vandalism, or insurance claims at this property in the last 3 years? What carrier currently insures it and at what premium?
- What's the average days-on-market for RENTAL listings here right now (not sales)? A rising rental-DOM trend means longer vacancies and softer asking-rent achievability than the comps imply.
- What's the recent tenant-quality profile in this submarket — average credit score on applications, eviction rate, late-payment / NSF rate, and stable-employment percentage? A property-management company in the area should have these aggregated.
- How much new for-sale + rental construction is in the pipeline within 1–3 miles? Heavy new supply typically softens prices + rents 12–24 months out; constrained supply supports both.
Investment metrics
- 1% rule
- 1.25% ✓
- Cap rate
- 9.93%
- Cash-on-cash
- 13.00%
- DSCR
- 1.58
- GRM
- 6.7
CMA / ARV
- ARV (on-the-fly)
- $53,070
- Comps found
- 9
Show comp detail 9 sales within ~0.75 mi
| Address | Dist | Beds/Ba | Sqft | Sold | Price | $/sf | Match |
|---|---|---|---|---|---|---|---|
| 975 Concord Ave | 0.19mi | 2/1.0 | 648 (+6%) | 6mo | $35,000 | $54 | 76 |
| 864 Wyley Ave | 0.19mi | 2/1.0 | 600 (-2%) | 17mo | $90,000 | $150 | 74 |
| 654 Van Everett Ave | 0.33mi | 2/2.0 | 600 (-2%) | 8mo | $52,000 | $87 | 71 |
| 932 Cole Ave | 0.25mi | 2/1.0 | 660 (+8%) | 7mo | $52,000 | $79 | 69 |
| 713 Virginia Ave | 0.36mi | 2/1.0 | 560 (-8%) | 7mo | $69,000 | $123 | 64 |
| 676 Roscoe Ave | 0.47mi | 2/1.0 | 640 (+5%) | 13mo | $52,000 | $81 | 59 |
| 734 Corice St | 0.72mi | 1/1.0 (-1) | 592 (-3%) | 2mo | $70,000 | $118 | 55 |
| 897 Reed Ave | 0.36mi | 2/1.5 | 700 (+15%) | 17mo | $76,000 | $109 | 42 |
| 1135 Coventry St | 0.63mi | 1/1.0 (-1) | 658 (+8%) | 13mo | $50,000 | $76 | 42 |
Match score weights: distance 35% · size 25% · config 20% · recency 20%. Top-matched comps best support the ARV.
Projected returns pro-forma
-3.0% appreciation · 7.63% rent growth · sell at horizon
- IRR
- 8.0%
- Equity multiple
- 1.33×
- Total profit
- $6,438
- Equity at exit
- $10,422
- IRR
- 20.9%
- Equity multiple
- 3.16×
- Total profit
- $42,217
- Equity at exit
- $6,044
Cash invested: $19,572 (down + closing). Projections, not guarantees.
Landlord ↔ Tenant lean methodology
- Overall (STATE)
- 73 Landlord-Friendly
- State Ohio
- 73 Landlord-Friendly · R+6
- County
- — inherits STATE
- City
- — inherits STATE
ZIP-level market 44306
- Rents YoY
- 7.6%
- Active inventory
- 69
- Price-to-rent
- 6.7×
Monthly cashflow live
- Estimated rent
- $871 high interval (Pro) →
- Mortgage (P&I)
- −$367
- Tax from tax record
- −$80 /mo · $964/yr
- Insurance
- −$29
- HOA
- −$0
- Vacancy / Maint / Mgmt
- −$183
- Net cashflow
- $212
Break-even live
UW: 25.0% down · 7.5% · 30yr · 1.5% tax · 5.0% vac · 8.0% maint · 8.0% mgmt
Financing live
Cash to close
- Down payment
- $17,475
- Closing costs
- $2,097
- Reserves months
- —
- Total cash needed
- —
Loan-product check · same deal, 3 products live
Conventional
25% down · 7.5% · 30yr
- Down + closing
- —
- Monthly P&I
- —
- Monthly cashflow
- —
- DSCR
- —
- Eligible?
- —
Personal DTI + credit; lowest rate.
DSCR
20% down · 8.5% · 30yr
- Down + closing
- —
- Monthly P&I
- —
- Monthly cashflow
- —
- DSCR
- —
- Eligible?
- —
No personal income docs; deal must DSCR.
Hard money
10% down · 12.0% · 12mo
- Down + closing
- —
- Monthly P&I
- —
- Monthly cashflow
- —
- DSCR
- —
- Eligible?
- —
Short-term bridge; refi at stabilization.
Rent comps 20 comps
| Address | Beds | Baths | Sqft | Rent | $/sqft | DOM | Units | Dist |
|---|---|---|---|---|---|---|---|---|
| 958 Hunt St #2 Akron, OH | 1.0 | 1.0 | 700 | $600 | $0.86 | 43d | 1 | 0.13mi |
| 972 Concord Ave Akron, OH | 2.0 | 1.0 | 720 | $1,173 | $1.63 | 43d | 1 | 0.18mi |
| 1017 Neville Ave Akron, OH | 2.0 | 1.0 | 600 | $675 | $1.12 | 43d | 1 | 0.30mi |
| 1055 Neville Ave Akron, OH | 2.0 | 1.0 | 600 | $700 | $1.17 | 43d | 1 | 0.33mi |
| 778 Ravenswood St Akron, OH | 2.0 | 1.0 | 616 | $1,150 | $1.87 | 23d | 1 | 0.45mi |
| 668 Roscoe Ave Akron, OH | 2.0 | 1.0 | 720 | $875 | $1.22 | 43d | 1 | 0.50mi |
| 978 Kelly Ave Akron, OH | 1.0 | 1.0 | 500 | $875 | $1.75 | 23d | 1 | 0.61mi |
| 978 Kelly Ave Akron, OH | 1.0 | 1.0 | 500 | $900 | $1.80 | 43d | 1 | 0.61mi |
| 551 Baltimore Ave Unit 551 Akron, OH | 2.0 | 1.0 | 588 | $850 | $1.45 | 43d | 1 | 0.72mi |
| 548 Winans Ave Akron, OH | 1.0 | 1.0 | 700 | $1,100 | $1.57 | 43d | 1 | 0.72mi |
| 551 Baltimore Ave Akron, OH | 2.0 | 1.0 | 588 | $850 | $1.45 | 23d | 1 | 0.72mi |
| 780 Anderson Ave #12 Akron, OH | 1.0 | 1.0 | 700 | $785 | $1.12 | 14d | 1 | 0.74mi |
| 780 Anderson Ave #13 Akron, OH | 1.0 | 1.0 | 700 | $785 | $1.12 | 43d | 1 | 0.74mi |
| 769 Anderson Ave #6 Akron, OH | 1.0 | 1.0 | 600 | $785 | $1.31 | 14d | 1 | 0.76mi |
| 794 Anderson Ave #9 Akron, OH | 1.0 | 1.0 | 600 | $785 | $1.31 | 23d | 1 | 0.76mi |
| 1566 Coventry St Akron, OH | 1.0 | 1.5 | 600 | $795 | $1.32 | 43d | 1 | 0.94mi |
| 1588 Coventry St Unit 7 Akron, OH | 1.0 | 1.0 | 600 | $795 | $1.32 | 23d | 1 | 0.98mi |
| 167 Chittenden St Unit 3 Akron, OH | 1.0 | 1.0 | 575 | $700 | $1.22 | 43d | 1 | 1.26mi |
| 1119 Johnston St Apt 1 Akron, OH | 1.0 | 1.0 | 365 | $675 | $1.85 | 14d | 1 | 1.37mi |
| 429 Lovisa St Akron, OH | 1.0 | 1.0 | 600 | $900 | $1.50 | 43d | 1 | 1.49mi |
Listing history 11 events
-
2026-06-18days on market $69,900 Active 12 DOM
-
2026-06-17days on market $69,900 Active 11 DOM
-
2026-06-16days on market $69,900 Active 10 DOM
-
2026-06-15days on market $69,900 Active 9 DOM
-
2026-06-14days on market $69,900 Active 7 DOM
-
2026-06-13days on market $69,900 Active 6 DOM
-
2026-06-10days on market $69,900 Active 4 DOM
-
2026-06-09days on market $69,900 Active 3 DOM
-
2026-06-08days on market $69,900 Active 2 DOM
-
2026-06-07remarks 693-char remark
-
2026-06-07$69,900 Active 1 DOM
ⓘ Source: listings_history table (triggers on properties + properties_extension) + one-shot
backfill from property_details.listing_events for pre-trigger history.
Tax reassessment forecast OH · Partial reset (capped growth)
- Current annual tax
- $964 · $80/mo
- Projected year-2 tax
- $1,027 · $86/mo
- Expected delta
- +$63/yr (+$5/mo · 6.5%)
ⓘ Screening estimate from a state-policy table — verify with the county assessor before closing.
Climate risk First Street
- Flood 1/10 Low FEMA zone X (unshaded) · 0% chance over 30 yrs
- Wildfire 1/10 Low
- Heat 3/10 Moderate 7 d/yr ≥96°F today · 17 d/yr by 30 yrs out
- Wind 1/10 Low
- Air quality 2/10 Low 1 unhealthy d/yr today · 2 by 30 yrs out
Nearby sold comps map
Loading sold comps map…
Walkable amenities ~0.75 mi
Loading nearby amenities…
Taxation est. · year 1
- Rental income
- $10,453
- − Mortgage interest
- −$3,915
- − Property taxes
- −$964
- − Insurance
- −$350
- − Repairs & maintenance
- −$836
- − Management
- −$836
- − Depreciation
- −$2,033
- Taxable income
- $1,518
- Est. tax owed @ 24.0%
- −$364
- After-tax cash flow
- $2,181/yr
For passive investors: Depreciation is non-cash, so a rental often shows a tax loss while cash-flowing — sheltering income. Rental losses are passive: they offset passive income freely, and up to $25,000/yr can offset ordinary (W-2) income if you actively participate and your MAGI is under $100k (phasing out to $0 by $150k); unused losses carry forward. On sale, claimed depreciation is recaptured at up to 25%, and gains may owe capital-gains tax (a 1031 exchange can defer both). Figures are a year-1 estimate at your 24.0% rate — not tax advice; consult a CPA.
Schools (NCES district)
- District
- Akron City
- NCES district ID
- 3904348
- Math proficiency
- 22% ▼ -17.00%
- Reading proficiency
- 30% ▼ -12.00%
- Median HH income
- $33,811
- Composite
- 21.31/100
- National rank
- #8383
- State rank
- #602 of 656 in OH
Livability — Akron
- Score
- 81/100
- State rank
- #104
- US rank
- #1591
Category grades
Schools grade is shown separately in the Schools card above.
Census & demographics
- Census place
- Akron, OH
- County
- Summit County · 440,783 people
- City population
- 174,375
- Metro
- Akron, OH
- Population (ZIP)
- 20,905
- Household income
- $41,688
- Rent vs Own
- Severe rent burden
- 1251.0
Population outlook (Summit County) Hauer SSP2
- Today (2025)
- 546,583 people
- By 2030
- 544,028 · -0.5%
- By 2040
- 531,363 · -2.8%
- By 2050
- 514,923 · -5.8%
- By 2075
- 481,765 · -11.9%
- By 2100
- 432,265 · -20.9%
Race, ethnicity, and origin ACS 2023
- Neighborhood character
- Diverse neighborhood (Simpson 0.62)
- Race & ethnicity
- White 48% Black 38% Two or more races 8% Hispanic / Latino 3% Asian 2%
- Common ancestry
- Lithuanian 2% Iranian 1% Scotch-Irish 1%
- Foreign-born
- 4% · Vietnam, Canada, Philippines
- Languages at home
- 94% English-only · Spanish 2% Other Asian/Pacific 1% Vietnamese 1%
Political lean MEDSL · Summit
- 2024 margin
- Lean D (+7.0) · D 53.0% · R 46.0%
- 2008→2024 swing
- -9.6pp toward R · 2008: 16.6pp · 2024: 7.0pp
- All cycles
- 2024: D+7.0 2020: D+9.6 2016: D+8.2 2012: D+14.8 2008: D+16.6
Not yet ingested
- Civics
- —
Market trends
- HPI YoY
- ▼ -101.46%
- Current HPI
- 132.768
- Rent YoY
- ▲ 7.63%
- Metro
- Akron, OH
- State GDP YoY
- ▲ 1.98%
- F500 in state
- 48
Industry mix (Fortune 500 HQ in OH)
| Industry | F500 HQs | Revenue |
|---|---|---|
| Insurance | 3 | $145B |
|
||
| Industrial Machinery | 3 | $49B |
|
||
| Financial Services | 3 | $24B |
|
||
| Consumer Goods | 2 | $93B |
|
||
| Aerospace / Defense | 2 | $47B |
|
||
| Utilities | 2 | $33B |
|
||
Price history
+606.1% since first listed5 events — show timeline
- 2026-06-05 Listed $69,900 MLSNOW
- 2013-04-24 Sold (MLS) $8,900 MLSNOW
- 2013-03-26 Listed $8,900 MLSNOW
- 2013-02-28 Listing Removed — MLSNOW
- 2012-10-08 Listed $9,900 MLSNOW
Property tax history
-0.1%/yrLatest (2025): $964 · +0.2% YoY. Source: county tax records.
Cash-flow waterfall
monthlySold comps — $/sqft
last 12 mo · ≤1 miLoading sold comps…