1056 Buffalo Trl Unit B1056 · Gardner, KS
Flood risk 1/10 · Minimal
- FEMA flood zone
- X (unshaded)
- Chance of flooding over 30 yrs
- 0.0%
- Est. flood insurance / yr
- $507 – $1,088
Fire risk 4/10 · Minor
- Est. fire insurance / yr
- $1,154 – $2,142
Heat risk 4/10 · Minor
- Hot days now (above 107°F)
- 7 days/yr
- Hot days in 30 yrs
- 17 days/yr
Wind risk 2/10 · Minimal
- Chance of severe wind over 30 yrs
- —
Air-quality risk 2/10 · Minimal
- Unhealthy air days now
- 2 days/yr
- Unhealthy air days in 30 yrs
- 2 days/yr
Risk factors via First Street. Map © Google.
Why this score? — see what drove the B grade
The composite is a weighted blend of 9 inputs, each scored 0–100. Each bar is that input's sub-score; the figure is the points it added to the 100-point composite (weight × sub-score).
- Cash flow +30.0/30.0
- 1% rule +10.0/10.0
- DSCR +10.0/10.0
- ARV discount +7.5/15.0
- Livability +3.8/5.0
- Condition / age +3.8/5.0
- Schools +3.2/10.0
- Rent growth +3.1/5.0
- Appreciation +0.0/10.0
$79,900
🖨 Deal sheet 📄 Offer letter ✓ Due diligence
Key facts
- Built 2026
- Listed 5 days
Property features AI
Finance
- Financial info: List price $79,900
Exterior
- Home design: Spec new construction, Plan name: Conestoga
- Construction: Built in 2026
Interior
- Bedrooms: 3 bedrooms
- Bathrooms: 2 full bathrooms
- Interior features: Living area of 1216
Neighborhood map
What this means for you Summary
Snapshot
- This is a 3-bed/2.0-bath manufactured listed at $80k. Condition is rated good.
Deal economics
- At list price, monthly cash flow is $877 ($11k/yr) — positive.
- The deal already cash-flows at list — no discount required.
- Meets the 1% rule at list price ($2k rent vs $80k).
- Cap rate 19.5% vs local median 3.1% in Gardner — top-decile yield for the area; either an underpriced asset or a hidden risk that comps aren't pricing in. Stress-test before assuming the spread holds.
Location & tenants
- Location reads 75/100 on livability (#61 in KS, #3,865 nationally) — a middle-class / working-renter tenant base. Strengths: crime A+, housing A+, employment A; Watch: amenities F, commute F.
- Gardner Edgerton (suburban): math 32% / reading 37% proficiency, ranked #50 of 169 in KS (top 30%) — families likely to look elsewhere, expect single-tenant / working-renter base with shorter leases.
- Market conditions: Rents rising (+2.2%/yr); 277 active listings in the ZIP; 7 comparable units currently listed for rent nearby; rentals leasing fast (median 2d on market — plan ~1-2 weeks tenant-placement turnaround); solid renter incomes; 2,969 units permitted in Johnson County in 2024 (1,066 in 5+ unit buildings).
Forward outlook
- Local home prices are declining (-3.0%/yr); year-one equity from $552 of loan paydown is wiped out by about $2k of value loss. Plan a longer hold.
- Johnson County population projected at +27% by 2050 — long-run rental-demand tailwind backs the buy-and-hold thesis.
- At projected returns (-3.0% appreciation + 2.2% rent growth), your $22k cash investment doubles in ~3 years — after that, you're playing with house money.
Negotiation context
- Only 5 days on market — expect competitive offers; lowballing is unlikely to land.
Questions for the listing agent
- Is there a deadline driving the sale (1031 exchange, divorce, estate, relocation)? That informs how much negotiation room exists.
- Schools are B-rated — typically a magnet for longer-tenancy family renters. What's the average tenant stay here, and is there a school-zone premium baked into asking?
- What's the average days-on-market for RENTAL listings here right now (not sales)? A rising rental-DOM trend means longer vacancies and softer asking-rent achievability than the comps imply.
- What's the recent tenant-quality profile in this submarket — average credit score on applications, eviction rate, late-payment / NSF rate, and stable-employment percentage? A property-management company in the area should have these aggregated.
- How much new for-sale + rental construction is in the pipeline within 1–3 miles? Heavy new supply typically softens prices + rents 12–24 months out; constrained supply supports both.
Investment metrics
- 1% rule
- 2.26% ✓
- Cap rate
- 19.47%
- Cash-on-cash
- 47.04%
- DSCR
- 3.09
- GRM
- 3.7
CMA / ARV
No comps found within radius.
Projected returns pro-forma
-3.0% appreciation · 2.22% rent growth · sell at horizon
- IRR
- 43.5%
- Equity multiple
- 2.86×
- Total profit
- $41,532
- Equity at exit
- $11,913
- IRR
- 49.2%
- Equity multiple
- 5.58×
- Total profit
- $102,514
- Equity at exit
- $6,908
Cash invested: $22,372 (down + closing). Projections, not guarantees.
Landlord ↔ Tenant lean methodology
- Overall (STATE)
- 83 Strongly Landlord-Friendly
- State Kansas
- 83 Strongly Landlord-Friendly · R+10
- County
- — inherits STATE
- City
- — inherits STATE
ZIP-level market 66030
- Home prices YoY
- -28.4%
- Rents YoY
- 2.2%
- Active inventory
- 277
- Price-to-rent
- 3.7×
Monthly cashflow live
- Estimated rent
- $1,809 high interval (Pro) →
- Mortgage (P&I)
- −$419
- Tax est. 1.5%
- −$100 /mo · $1,198/yr
- Insurance
- −$33
- HOA
- −$0
- Vacancy / Maint / Mgmt
- −$380
- Net cashflow
- $877
Break-even live
UW: 25.0% down · 7.5% · 30yr · 1.5% tax · 5.0% vac · 8.0% maint · 8.0% mgmt
Financing live
Cash to close
- Down payment
- $19,975
- Closing costs
- $2,397
- Reserves months
- —
- Total cash needed
- —
Loan-product check · same deal, 3 products live
Conventional
25% down · 7.5% · 30yr
- Down + closing
- —
- Monthly P&I
- —
- Monthly cashflow
- —
- DSCR
- —
- Eligible?
- —
Personal DTI + credit; lowest rate.
DSCR
20% down · 8.5% · 30yr
- Down + closing
- —
- Monthly P&I
- —
- Monthly cashflow
- —
- DSCR
- —
- Eligible?
- —
No personal income docs; deal must DSCR.
Hard money
10% down · 12.0% · 12mo
- Down + closing
- —
- Monthly P&I
- —
- Monthly cashflow
- —
- DSCR
- —
- Eligible?
- —
Short-term bridge; refi at stabilization.
Rent comps 7 comps
| Address | Beds | Baths | Sqft | Rent | $/sqft | DOM | Units | Dist |
|---|---|---|---|---|---|---|---|---|
| 1199 E Santa Fe St Gardner, KS | 2.0–4.0 | 2.0 | 960 | $1,639 | $1.71 | 1d | 1 | 0.38mi |
| 581 Woodson Ln Gardner, KS | 3.0 | 2.0 | 1330 | $1,695 | $1.27 | 23d | 1 | 0.40mi |
| 744 Woodson Ln Gardner, KS | 3.0 | 2.0 | 1383 | $1,625 | $1.17 | 23d | 1 | 0.58mi |
| 400 S Moonlight Rd Gardner, KS | 1.0–2.0 | 1.0–2.0 | 839 | $1,600 | $1.91 | 1d | 20 | 0.61mi |
| 704 S Hemlock St Gardner, KS | 2.0–4.0 | 2.0–3.0 | 1475 | $2,224 | $1.51 | 1d | 14 | 0.71mi |
| 370 N Evergreen St Gardner, KS | 3.0 | 2.0 | 1172 | $1,595 | $1.36 | 23d | 1 | 0.74mi |
| 25901 W 178th St Gardner, KS | 2.0 | 1.0–2.0 | 831 | $1,785 | $2.15 | 1d | 48 | 0.81mi |
Listing history 4 events
-
2026-06-09days on market $79,900 Active 5 DOM
-
2026-06-08days on market $79,900 Active 4 DOM
-
2026-06-07days on market $79,900 Active 3 DOM
-
2026-06-05$79,900 Active 1 DOM
ⓘ Source: listings_history table (triggers on properties + properties_extension) + one-shot
backfill from property_details.listing_events for pre-trigger history.
Climate risk First Street
- Flood 1/10 Low FEMA zone X (unshaded) · 0% chance over 30 yrs
- Wildfire 4/10 Moderate
- Heat 4/10 Moderate 7 d/yr ≥107°F today · 17 d/yr by 30 yrs out
- Wind 2/10 Low
- Air quality 2/10 Low 2 unhealthy d/yr today · 2 by 30 yrs out
Nearby sold comps map
Loading sold comps map…
Walkable amenities ~0.75 mi
Loading nearby amenities…
Taxation est. · year 1
- Rental income
- $21,710
- − Mortgage interest
- −$4,476
- − Property taxes
- −$1,198
- − Insurance
- −$400
- − Repairs & maintenance
- −$1,737
- − Management
- −$1,737
- − Depreciation
- −$2,324
- Taxable income
- $9,838
- Est. tax owed @ 24.0%
- −$2,361
- After-tax cash flow
- $8,164/yr
For passive investors: Depreciation is non-cash, so a rental often shows a tax loss while cash-flowing — sheltering income. Rental losses are passive: they offset passive income freely, and up to $25,000/yr can offset ordinary (W-2) income if you actively participate and your MAGI is under $100k (phasing out to $0 by $150k); unused losses carry forward. On sale, claimed depreciation is recaptured at up to 25%, and gains may owe capital-gains tax (a 1031 exchange can defer both). Figures are a year-1 estimate at your 24.0% rate — not tax advice; consult a CPA.
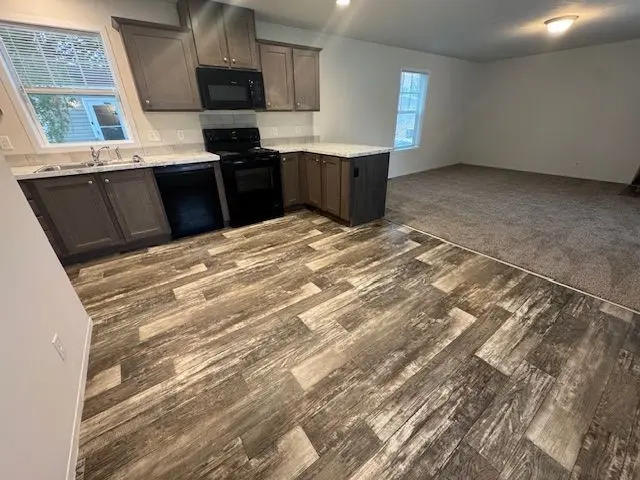
Condition & rehab AI · 4 photos
This manufactured home is in good condition with recent updates, making it move-in ready and suitable for both resale and rental markets.
Value-add opportunities
- Both Painting exterior siding — Enhances curb appeal and can increase both resale and rental value.
- Both Landscaping improvements — Enhances curb appeal and can increase both resale and rental value.
- Both New flooring in bathrooms — Improves aesthetics and can increase both resale and rental value.
- Both New countertops in bathrooms — Improves aesthetics and can increase both resale and rental value.
Renovation cost estimate screening
Value-add ROI direction
- Both Painting exterior siding — Enhances curb appeal and can increase both resale and rental value. ↑
- Both Landscaping improvements — Enhances curb appeal and can increase both resale and rental value. ↑
- Both New flooring in bathrooms — Improves aesthetics and can increase both resale and rental value. ↑
- Both New countertops in bathrooms — Improves aesthetics and can increase both resale and rental value. ↑
ⓘ Cost ranges are severity-bucket heuristics (US national rule-of-thumb). Get contractor quotes + a written scope before underwriting a rehab budget.
Schools (NCES district)
- District
- Gardner Edgerton
- NCES district ID
- 2006420
- Math proficiency
- 32% ▼ -7.00%
- Reading proficiency
- 37% ▼ -2.00%
- Median HH income
- $67,086
- Composite
- 31.55/100
- National rank
- #5957
- State rank
- #50 of 169 in KS
Livability — Gardner
- Score
- 75/100
- State rank
- #61
- US rank
- #3865
Category grades
Schools grade is shown separately in the Schools card above.
Census & demographics
- Census place
- Gardner, KS
- County
- Johnson County · 574,662 people
- City population
- 26,328
- Metro
- Kansas City, MO-KS
- Population (ZIP)
- 26,328
- Household income
- $97,822
- Rent vs Own
- Severe rent burden
- 410.0
Population outlook (Johnson County) Hauer SSP2
- Today (2025)
- 663,396 people
- By 2030
- 702,585 · +5.9%
- By 2040
- 775,386 · +16.9%
- By 2050
- 841,772 · +26.9%
- By 2075
- 994,137 · +49.9%
- By 2100
- 1,073,036 · +61.7%
Race, ethnicity, and origin ACS 2023
- Neighborhood character
- Predominantly White (78%)
- Race & ethnicity
- White 78% Hispanic / Latino 9% Two or more races 7% Black 7% Asian 1%
- Hispanic origin (detail)
- Mexican 6%
- Common ancestry
- Lithuanian 3% Iranian 2% Italian 2%
- Foreign-born
- 6% · Canada
- Languages at home
- 91% English-only · Spanish 6% Other Indo-European 1%
Political lean MEDSL · Johnson
- 2024 margin
- Lean D (+8.5) · D 53.4% · R 44.9% · Other 1.8%
- 2008→2024 swing
- +17.5pp toward D · 2008: -9.0pp · 2024: 8.5pp
- All cycles
- 2024: D+8.5 2020: D+8.2 2016: R+2.7 2012: R+17.8 2008: R+9.0
Not yet ingested
- Civics
- —
Market trends
- HPI YoY
- ▼ -100.70%
- Current HPI
- 253.9021
- Rent YoY
- ▲ 2.22%
- Metro
- Kansas City, MO-KS
- State GDP YoY
- —
- F500 in state
- 0
Cash-flow waterfall
monthlySold comps — $/sqft
last 12 mo · ≤1 miLoading sold comps…