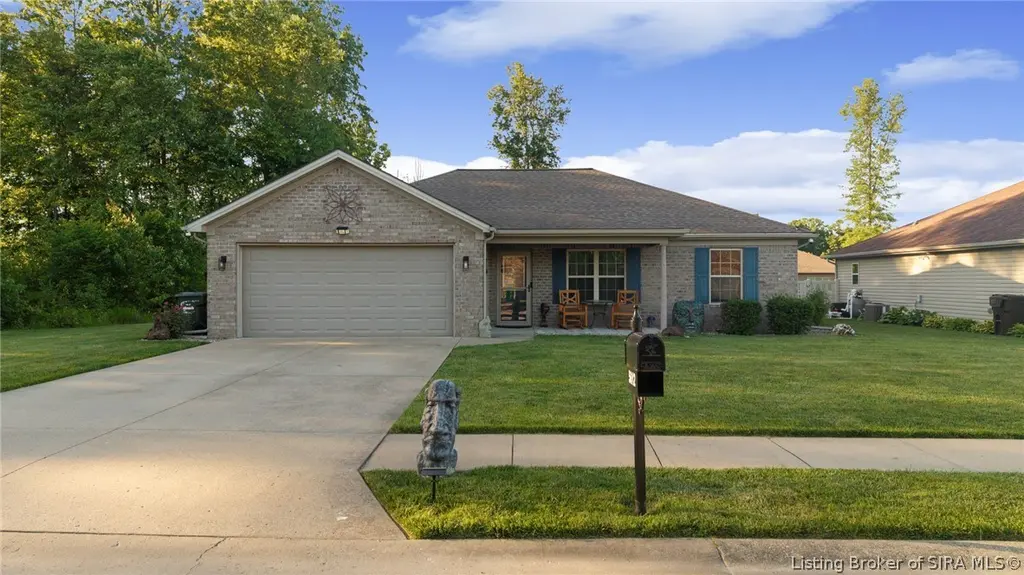
5612 Nature Vw · Memphis, IN
Flood risk 1/10 · Minimal
- FEMA flood zone
- X (unshaded)
- Chance of flooding over 30 yrs
- 0.0%
- Est. flood insurance / yr
- $507 – $1,088
Fire risk 1/10 · Minimal
- Est. fire insurance / yr
- $717 – $1,331
Heat risk 5/10 · Moderate
- Hot days now (above 105°F)
- 7 days/yr
- Hot days in 30 yrs
- 21 days/yr
Wind risk 2/10 · Minimal
- Chance of severe wind over 30 yrs
- 1.0%
Air-quality risk 2/10 · Minimal
- Unhealthy air days now
- 1 days/yr
- Unhealthy air days in 30 yrs
- 1 days/yr
Risk factors via First Street. Map © Google.
Why this score? — see what drove the D- grade
The composite is a weighted blend of 9 inputs, each scored 0–100. Each bar is that input's sub-score; the figure is the points it added to the 100-point composite (weight × sub-score).
- Cash flow +13.4/30.0
- Schools +5.0/10.0
- ARV discount +4.2/15.0
- DSCR +4.0/10.0
- Livability +3.5/5.0
- 1% rule +2.9/10.0
- Rent growth +2.5/5.0
- Condition / age +2.5/5.0
- Appreciation +0.0/10.0
$280,000
🖨 Deal sheet (PDF) 📄 Offer letter ✓ Due diligence
Listing remarks MLS
Sale pending. Sq ft & rm sz approx.
Key facts
- Oversized patio
- Gas range
- 0.25 acre lot
Tags
Property features AI
Finance
- HOA & community: Association fee of $100 annually
Exterior
- Parking: Attached garage; 2 garage spaces; Garage faces front; Garage door opener
- Utilities: Public water; Public sewer; Connected to water service
- Home design: Single-story home; Brick and frame construction; Shingle roof; Slab foundation; Residential zoning; Dead-end lot
- Construction: Built with brick and frame; Shingle roof; Slab foundation
- Exterior features: Patio; Landscaping; Paved driveway; Yard fenced; Shed(s); Garage(s)
Interior
- Kitchen: Dishwasher; Microwave; Oven; Range; Refrigerator; Breakfast bar; Eat-in kitchen
- Bedrooms: Primary bedroom on main level
- Bathrooms: 2 full bathrooms
- Heating & cooling: Heat pump heating; Central air conditioning
- Interior features: Attic; Breakfast bar; Ceramic bath; Ceiling fan(s); Eat-in kitchen; Open floorplan; Split bedroom layout; Utility room; Vaulted ceiling(s); Walk-in closet(s); Window treatments; Blinds; Screens
- Laundry & utility: Main level laundry room; Washer; Dryer
Neighborhood map
What this means for you Summary
Snapshot
- This is a 3-bed/2.0-bath single-family listed at $280k.
Deal economics
- At list price, monthly cash flow is $5 ($62/yr) — positive.
- The deal already cash-flows at list — no discount required.
- To meet the 1% rule (rent ≥ 1% of price), the offer needs to be $221k (21.2% below list).
- Recommended offer: $221k (21.2% below list) — sets the bar for 1% rule.
- Cap rate 6.3% vs local median 5.0% in Memphis — meaningfully above typical; check what's discounted (condition, days-on-market, listing class) to confirm the premium yield is real.
Location & tenants
- Location reads 70/100 on livability (#164 in IN) — a middle-class / working-renter tenant base. Strengths: employment A+, cost of living A+, housing A+; Watch: schools F, amenities F, commute F.
- Market conditions: 94 active listings in the ZIP; 911 units permitted in Clark County in 2024 (133 in 5+ unit buildings).
Forward outlook
- Local home prices are declining (-3.0%/yr); year-one equity from $2k of loan paydown is wiped out by about $8k of value loss. Plan a longer hold.
- Clark County population projected at +17% by 2050 — long-run rental-demand tailwind backs the buy-and-hold thesis.
Negotiation context
- Only 6 days on market — expect competitive offers; lowballing is unlikely to land.
- 2 sale attempts since 13y ago with the ask held roughly flat each time — persistent listings suggest the price (not the market) is what's stuck; bring a comps-based counter.
- Current owner paid $134k; list at $280k implies a 109% gain — meaningful room to come down on a strong offer.
Risks & watch-outs
- Climate carrying-cost: extreme-heat days projected 7→21/yr by 2055 (HVAC capex compounding) — expect insurance premiums to compound above CPI over the hold.
Questions for the listing agent
- What does the HOA fee cover, when was the last increase, and are there any pending special assessments or reserve-fund shortfalls?
- Is there a deadline driving the sale (1031 exchange, divorce, estate, relocation)? That informs how much negotiation room exists.
- Schools are F-rated, which usually means shorter tenancies and higher turnover. Who's the typical renter profile here, and what's been the actual vacancy rate?
- The area grade is low — what's the realistic commute time and amenity access for the typical tenant pool here? Any planned neighborhood developments (good or bad) we should know about?
- What's the average days-on-market for RENTAL listings here right now (not sales)? A rising rental-DOM trend means longer vacancies and softer asking-rent achievability than the comps imply.
- What's the recent tenant-quality profile in this submarket — average credit score on applications, eviction rate, late-payment / NSF rate, and stable-employment percentage? A property-management company in the area should have these aggregated.
- How much new for-sale + rental construction is in the pipeline within 1–3 miles? Heavy new supply typically softens prices + rents 12–24 months out; constrained supply supports both.
Investment metrics
- 1% rule
- 0.79% ✗
- Cap rate
- 6.31%
- Cash-on-cash
- 0.08%
- DSCR
- 1.00
- GRM
- 10.6
CMA / ARV
- ARV (on-the-fly)
- $261,129
- Comps found
- 12
Show comp detail 12 sales within ~0.75 mi
| Address | Dist | Beds/Ba | Sqft | Sold | Price | $/sf | Match |
|---|---|---|---|---|---|---|---|
| 5721 Harmony Woods Dr | 0.14mi | 3/2.0 | 1,398 (+3%) | 0mo | $269,900 | $193 | 88 |
| 5503 Harmony Woods | 0.14mi | 3/2.0 | 1,323 (-2%) | 3mo | $245,000 | $185 | 87 |
| 5707 Harmony Woods #1002 | 0.14mi | 3/2.0 | 1,400 (+4%) | 2mo | $265,000 | $189 | 86 |
| 5708 Harmony Woods Lot#1024 | 0.12mi | 3/2.0 | 1,305 (-4%) | 5mo | $249,900 | $191 | 85 |
| 5712 Harmony Woods Lot 1025 | 0.12mi | 3/2.0 | 1,285 (-5%) | 3mo | $249,900 | $194 | 84 |
| 5702 Water Vw | 0.15mi | 3/2.0 | 1,398 (+3%) | 5mo | $255,000 | $182 | 84 |
| 5703 Harmony Woods #1004 | 0.14mi | 3/2.0 | 1,425 (+5%) | 2mo | $274,900 | $193 | 83 |
| 5706 Harmony Woods Lot 1023 | 0.12mi | 3/2.0 | 1,285 (-5%) | 4mo | $250,000 | $195 | 83 |
| 5709 Harmony Woods Lot 1001 | 0.14mi | 3/2.0 | 1,425 (+5%) | 4mo | $274,900 | $193 | 81 |
| 13954 Deer Run Trce Lot 425 | 0.38mi | 3/2.0 | 1,472 (+9%) | 4mo | $299,900 | $204 | 64 |
| 13951 Deer Run Trce Lot 406 | 0.37mi | 3/2.0 | 1,553 (+15%) | 3mo | $338,900 | $218 | 56 |
| 13803 Station Ct | 0.52mi | 3/2.0 | 1,511 (+12%) | 2mo | $240,000 | $159 | 54 |
Match score weights: distance 35% · size 25% · config 20% · recency 20%. Top-matched comps best support the ARV.
Projected returns pro-forma
-3.0% appreciation · 3.0% rent growth · sell at horizon
- IRR
- -16.2%
- Equity multiple
- 0.42×
- Total profit
- $-45,133
- Equity at exit
- $41,749
- IRR
- -8.0%
- Equity multiple
- 0.50×
- Total profit
- $-39,238
- Equity at exit
- $24,209
Cash invested: $78,400 (down + closing). Projections, not guarantees.
Landlord ↔ Tenant lean methodology
- Overall (STATE)
- 90 Strongly Landlord-Friendly
- State Indiana
- 90 Strongly Landlord-Friendly · R+11
- County
- — inherits STATE
- City
- — inherits STATE
ZIP-level market 47143
- Home prices YoY
- -30.4%
- Active inventory
- 94
- Price-to-rent
- 10.6×
Monthly cashflow live
- Estimated rent
- $2,205 medium interval (Pro) →
- Mortgage (P&I)
- −$1,468
- Tax from tax record
- −$144 /mo · $1,726/yr
- Insurance
- −$117
- HOA
- −$8
- Vacancy / Maint / Mgmt
- −$463
- Net cashflow
- $5
Break-even live
Sensitivity live
| Price | -10% $164 | -5% $84 | +0% $5 | +5% $-74 | +10% $-153 |
|---|---|---|---|---|---|
| Rent | -10% $-169 | -5% $-82 | +0% $5 | +5% $92 | +10% $179 |
| Rate | -1.0pp $146 | -0.5pp $76 | base $5 | +0.5pp $-67 | +1.0pp $-141 |
UW: 25.0% down · 7.5% · 30yr · 1.5% tax · 5.0% vac · 8.0% maint · 8.0% mgmt
Financing live
Cash to close
- Down payment
- $70,000
- Closing costs
- $8,400
- Reserves months
- —
- Total cash needed
- —
Loan-product check · same deal, 3 products live
Conventional
25% down · 7.5% · 30yr
- Down + closing
- —
- Monthly P&I
- —
- Monthly cashflow
- —
- DSCR
- —
- Eligible?
- —
Personal DTI + credit; lowest rate.
DSCR
20% down · 8.5% · 30yr
- Down + closing
- —
- Monthly P&I
- —
- Monthly cashflow
- —
- DSCR
- —
- Eligible?
- —
No personal income docs; deal must DSCR.
Hard money
10% down · 12.0% · 12mo
- Down + closing
- —
- Monthly P&I
- —
- Monthly cashflow
- —
- DSCR
- —
- Eligible?
- —
Short-term bridge; refi at stabilization.
HOA detail
- Monthly dues
- $8 · $96/yr
Listing history 5 events
-
2026-06-10days on market $280,000 Active 6 DOM
-
2026-06-09days on market $280,000 Active 5 DOM
-
2026-06-08days on market $280,000 Active 4 DOM
-
2026-06-07remarks 699-char remark
-
2026-06-07$280,000 Active 3 DOM
ⓘ Source: listings_history table (triggers on properties + properties_extension) + one-shot
backfill from property_details.listing_events for pre-trigger history.
Tax reassessment forecast IN · Partial reset (capped growth)
- Current annual tax
- $1,726 · $144/mo
- Projected year-2 tax
- $2,053 · $171/mo
- Expected delta
- +$327/yr (+$27/mo · 18.9%)
ⓘ Screening estimate from a state-policy table — verify with the county assessor before closing.
Climate risk First Street
- Flood 1/10 Low FEMA zone X (unshaded) · 0% chance over 30 yrs
- Wildfire 1/10 Low
- Heat 5/10 Major 7 d/yr ≥105°F today · 21 d/yr by 30 yrs out
- Wind 2/10 Low 100% chance of damaging wind over 30 yrs
- Air quality 2/10 Low 1 unhealthy d/yr today · 1 by 30 yrs out
Nearby sold comps map
Loading sold comps map…
Walkable amenities ~0.75 mi
Loading nearby amenities…
Taxation est. · year 1
- Rental income
- $26,461
- − Mortgage interest
- −$15,684
- − Property taxes
- −$1,726
- − Insurance
- −$1,400
- − Repairs & maintenance
- −$2,117
- − Management
- −$2,117
- − HOA
- −$96
- − Depreciation
- −$8,145
- Taxable loss
- −$4,825
- Est. tax savings @ 24.0%
- +$1,158
- After-tax cash flow
- $1,220/yr
For passive investors: Depreciation is non-cash, so a rental often shows a tax loss while cash-flowing — sheltering income. Rental losses are passive: they offset passive income freely, and up to $25,000/yr can offset ordinary (W-2) income if you actively participate and your MAGI is under $100k (phasing out to $0 by $150k); unused losses carry forward. On sale, claimed depreciation is recaptured at up to 25%, and gains may owe capital-gains tax (a 1031 exchange can defer both). Figures are a year-1 estimate at your 24.0% rate — not tax advice; consult a CPA.
Schools (NCES district)
No district data.
Livability — Memphis
- Score
- 70/100
- State rank
- #164
- US rank
- #7848
Category grades
Schools grade is shown separately in the Schools card above.
Census & demographics
- Census place
- Memphis, IN
- Population (ZIP)
- 3,775
Population outlook (Clark County) Hauer SSP2
- Today (2025)
- 126,401 people
- By 2030
- 131,455 · +4.0%
- By 2040
- 140,471 · +11.1%
- By 2050
- 147,677 · +16.8%
- By 2075
- 161,702 · +27.9%
- By 2100
- 164,078 · +29.8%
Race, ethnicity, and origin ACS 2023
- Neighborhood character
- Predominantly White (93%)
- Race & ethnicity
- White 93% Two or more races 6% Hispanic / Latino 2% Black 1%
- Common ancestry
- Italian 5% American 3% Iranian 2%
- Foreign-born
- 1% · Canada
- Languages at home
- 98% English-only · Spanish 2%
Political lean MEDSL · Clark
- 2024 margin
- Strong R (+20.4) · D 38.9% · R 59.3% · Other 1.8%
- 2008→2024 swing
- -13.3pp toward R · 2008: -7.1pp · 2024: -20.4pp
- All cycles
- 2024: R+20.4 2020: R+18.3 2016: R+22.0 2012: R+9.9 2008: R+7.1
Not yet ingested
- Civics
- —
Market trends
- HPI YoY
- ▼ -80.60%
- Current HPI
- 184.1286
- Rent YoY
- —
- Metro
- —
- State GDP YoY
- ▲ 2.90%
- F500 in state
- 18
Industry mix (Fortune 500 HQ in IN)
| Industry | F500 HQs | Revenue |
|---|---|---|
| Industrial Machinery | 2 | $37B |
|
||
| Healthcare | 1 | $177B |
|
||
| Pharmaceuticals | 1 | $45B |
|
||
| Metals / Steel | 1 | $18B |
|
||
| Agriculture | 1 | $17B |
|
||
| Packaging | 1 | $12B |
|
||
Price history
+109.0% since first listed3 events — show timeline
- 2026-06-04 Listed $280,000 SIRA
- 2013-11-15 Sold (MLS) $134,000 SIRA
- 2013-04-03 Listed $134,000 SIRA
Property tax history
+7.7%/yrLatest (2024): $1,726 · +6.3% YoY. Source: county tax records.
Cash-flow waterfall
monthlySold comps — $/sqft
last 12 mo · ≤1 miLoading sold comps…