 🏗️ New Construction
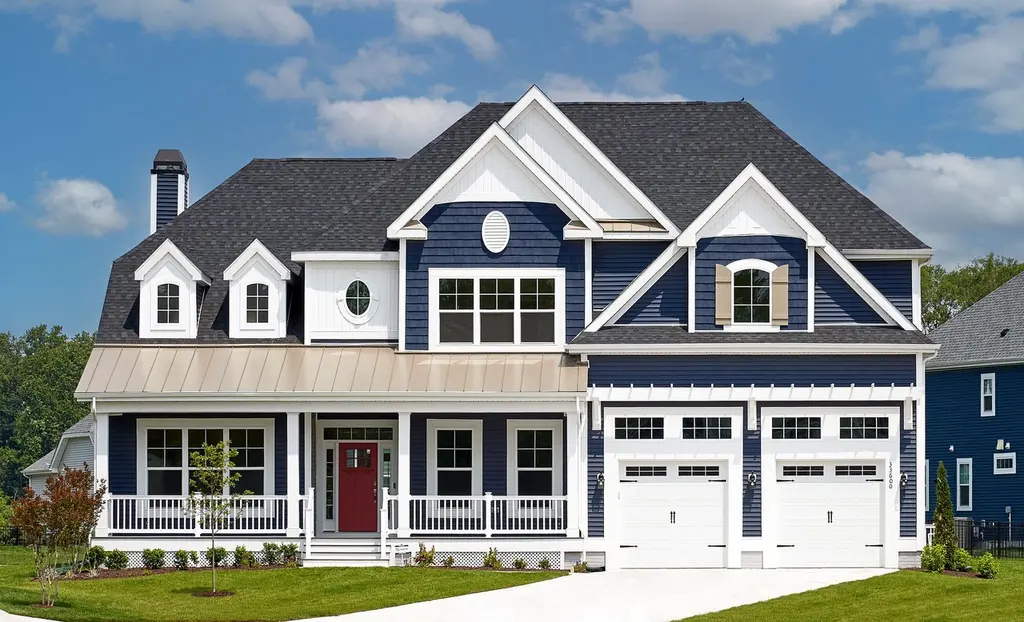
Waterford Plan · Ocean View, DE
Flood risk 9/10 · Severe
- FEMA flood zone
- X (unshaded)
- Chance of flooding over 30 yrs
- 0.99%
- Est. flood insurance / yr
- $473 – $860
Fire risk 1/10 · Minimal
- Est. fire insurance / yr
- $476 – $884
Heat risk 8/10 · Major
- Hot days now (above 100°F)
- 7 days/yr
- Hot days in 30 yrs
- 18 days/yr
Wind risk 8/10 · Major
- Chance of severe wind over 30 yrs
- 80.0%
Air-quality risk 2/10 · Minimal
- Unhealthy air days now
- 0 days/yr
- Unhealthy air days in 30 yrs
- 1 days/yr
Risk factors via First Street. Map © Google.
Why this score? — see what drove the F grade
The composite is a weighted blend of 9 inputs, each scored 0–100. Each bar is that input's sub-score; the figure is the points it added to the 100-point composite (weight × sub-score).
- Appreciation +10.0/10.0
- ARV discount +7.5/15.0
- Livability +3.5/5.0
- Schools +2.9/10.0
- Rent growth +2.5/5.0
- Condition / age +2.5/5.0
- Cash flow +2.2/30.0
- 1% rule +0.0/10.0
- DSCR +0.0/10.0
$850,400
🖨 Deal sheet 📄 Offer letter ✓ Due diligence
Listing remarks MLS
New Construction by Schell Brothers. This home will be built with Schellter(tm) Advanced Building Science Technologies providing you an extremely energy efficient home. You'll love the stunning exterior, innovative floor plan, and the multiple structural options that allow you to personalize your home to fit your needs. You will make all of your selections in our state-of-the-art design studio where you can choose from an extensive collection of interior finishes such as hardwood flooring, granite and quartz countertops, tile, cabinetry and so much more.
Key facts
- New construction
- Garage
- Listed 266 days
Tags
Neighborhood map
What this means for you Summary
Snapshot
- This is a 4-bed/3.5-bath single-family listed at $850k.
Deal economics
- At list price, monthly cash flow is $-4k ($-47k/yr) — negative.
- To cash-flow at today's rent, offer at most $501k (41.1% below list).
- To meet the 1% rule (rent ≥ 1% of price), the offer needs to be $445k (47.7% below list).
- Recommended offer: $445k (47.7% below list) — sets the bar for 1% rule.
Location & tenants
- Location reads 69/100 on livability (#27 in DE) — a middle-class / working-renter tenant base. Strengths: crime A+, employment A+, schools A; Watch: amenities F, commute F, cost of living F.
- Indian River School District (rural): math 25% / reading 41% proficiency, ranked #14 of 26 in DE (top 54%) — families likely to look elsewhere, expect single-tenant / working-renter base with shorter leases.
- Market conditions: 281 active listings in the ZIP; 1 comparable units currently listed for rent nearby; 4,354 units permitted in Sussex County in 2024 (344 in 5+ unit buildings).
Forward outlook
- In year one you build about $114k of equity ($7k loan paydown + $106k appreciation (10.0% local appreciation)).
- Sussex County population projected at +25% by 2050 — long-run rental-demand tailwind backs the buy-and-hold thesis.
- By year 2, paydown + projected appreciation supports a ~$183k cash-out refi (75% LTV) — recoverable capital for the next deal without selling this one.
Negotiation context
- It's been on market 266 days — a 12% lower offer ($748k) is reasonable based on typical stale-listing flexibility.
Risks & watch-outs
- Watch-outs: flood insurance adds $56/mo.
- Climate carrying-cost: severe flood risk; severe wind risk, 80% chance of damaging wind over 30y; extreme-heat days projected 7→18/yr by 2055 (HVAC capex compounding) — expect insurance premiums to compound above CPI over the hold.
Questions for the listing agent
- What do current leases actually rent for vs. the listed asking? Can we see a recent rent roll and the last 12 months of T-12 income?
- It's been on market 266 days. Have you received any prior offers? Is the seller open to a 48% concession, seller financing, or rate buy-down credit?
- What's the actual annual flood-insurance premium (NFIP or private), and is the property in a SFHA with mandatory coverage?
- Why hasn't it sold? Are there any deal-killer items the seller is aware of (foundation, flood, title, zoning, code violations)?
- Is there a deadline driving the sale (1031 exchange, divorce, estate, relocation)? That informs how much negotiation room exists.
- Schools are A-rated — typically a magnet for longer-tenancy family renters. What's the average tenant stay here, and is there a school-zone premium baked into asking?
- The area grade is low — what's the realistic commute time and amenity access for the typical tenant pool here? Any planned neighborhood developments (good or bad) we should know about?
- What's the average days-on-market for RENTAL listings here right now (not sales)? A rising rental-DOM trend means longer vacancies and softer asking-rent achievability than the comps imply.
- What's the recent tenant-quality profile in this submarket — average credit score on applications, eviction rate, late-payment / NSF rate, and stable-employment percentage? A property-management company in the area should have these aggregated.
- How much new for-sale + rental construction is in the pipeline within 1–3 miles? Heavy new supply typically softens prices + rents 12–24 months out; constrained supply supports both.
Investment metrics
- 1% rule
- 0.42% ✗
- Cap rate
- 1.97%
- Cash-on-cash
- -15.45%
- DSCR
- 0.31
- GRM
- 19.9
CMA / ARV
- ARV (median comp)
- $1,063,206
- List price
- $850,400
- Delta
- -20.02%
- Verdict
- UNDERPRICED
- Comps
- 18 within 1.0 mi
Projected returns pro-forma
10.0% appreciation · 3.0% rent growth · sell at horizon
- IRR
- 13.4%
- Equity multiple
- 2.11×
- Total profit
- $331,547
- Equity at exit
- $957,820
- IRR
- 13.6%
- Equity multiple
- 4.93×
- Total profit
- $1,171,266
- Equity at exit
- $2,065,575
Cash invested: $297,698 (down + closing). Projections, not guarantees.
Landlord ↔ Tenant lean methodology
- Overall (STATE)
- 70 Landlord-Friendly
- State Delaware
- 70 Landlord-Friendly · D+7
- County
- — inherits STATE
- City
- — inherits STATE
ZIP-level market 19945
- Home prices YoY
- 16.9%
- Active inventory
- 281
- Price-to-rent
- 15.9×
Monthly cashflow live
- Estimated rent
- $4,450 medium interval (Pro) →
- Mortgage (P&I)
- −$5,576
- Tax est. 1.5%
- −$1,329 /mo · $15,948/yr
- Insurance
- −$443
- Flood insurance flood zone
- −$56 /mo · $666/yr
- HOA
- −$0
- Vacancy / Maint / Mgmt
- −$934
- Net cashflow
- $-3,888
Break-even live
UW: 25.0% down · 7.5% · 30yr · 1.5% tax · 5.0% vac · 8.0% maint · 8.0% mgmt
Financing live
Cash to close
- Down payment
- $265,801
- Closing costs
- $31,896
- Reserves months
- —
- Total cash needed
- —
Loan-product check · same deal, 3 products live
Conventional
25% down · 7.5% · 30yr
- Down + closing
- —
- Monthly P&I
- —
- Monthly cashflow
- —
- DSCR
- —
- Eligible?
- —
Personal DTI + credit; lowest rate.
DSCR
20% down · 8.5% · 30yr
- Down + closing
- —
- Monthly P&I
- —
- Monthly cashflow
- —
- DSCR
- —
- Eligible?
- —
No personal income docs; deal must DSCR.
Hard money
10% down · 12.0% · 12mo
- Down + closing
- —
- Monthly P&I
- —
- Monthly cashflow
- —
- DSCR
- —
- Eligible?
- —
Short-term bridge; refi at stabilization.
Rent comps 1 comps
| Address | Beds | Baths | Sqft | Rent | $/sqft | DOM | Units | Dist |
|---|---|---|---|---|---|---|---|---|
| 36312 Sturgis Ln Frankford, DE | 5.0 | 3.5 | 3600 | $4,450 | $1.24 | 21d | 1 | 0.12mi |
Listing history 17 events
-
2026-06-18days on market $850,400 Active 266 DOM
-
2026-06-17days on market $850,400 Active 265 DOM
-
2026-06-16days on market $850,400 Active 264 DOM
-
2026-06-15days on market $850,400 Active 263 DOM
-
2026-06-14days on market $850,400 Active 261 DOM
-
2026-06-13days on market $850,400 Active 260 DOM
-
2026-06-10days on market $850,400 Active 258 DOM
-
2026-06-09days on market $850,400 Active 257 DOM
-
2026-06-08days on market $850,400 Active 256 DOM
-
2026-06-07days on market $850,400 Active 255 DOM
-
2026-06-02days on market $850,400 Active 250 DOM
-
2026-06-01days on market $850,400 Active 249 DOM
-
2026-05-31days on market $850,400 Active 248 DOM
-
2026-05-30days on market $850,400 Active 247 DOM
-
2026-05-15price $850,400 560-char remark
Show marketing remark (560 chars)
New Construction by Schell Brothers. This home will be built with Schellter(tm) Advanced Building Science Technologies providing you an extremely energy efficient home. You'll love the stunning exterior, innovative floor plan, and the multiple structural options that allow you to personalize your home to fit your needs. You will make all of your selections in our state-of-the-art design studio where you can choose from an extensive collection of interior finishes such as hardwood flooring, granite and quartz countertops, tile, cabinetry and so much more.
-
2025-10-06price $840,400 560-char remark
Show marketing remark (560 chars)
New Construction by Schell Brothers. This home will be built with Schellter(tm) Advanced Building Science Technologies providing you an extremely energy efficient home. You'll love the stunning exterior, innovative floor plan, and the multiple structural options that allow you to personalize your home to fit your needs. You will make all of your selections in our state-of-the-art design studio where you can choose from an extensive collection of interior finishes such as hardwood flooring, granite and quartz countertops, tile, cabinetry and so much more.
-
2025-09-26$830,400 Active 560-char remark
Show marketing remark (560 chars)
New Construction by Schell Brothers. This home will be built with Schellter(tm) Advanced Building Science Technologies providing you an extremely energy efficient home. You'll love the stunning exterior, innovative floor plan, and the multiple structural options that allow you to personalize your home to fit your needs. You will make all of your selections in our state-of-the-art design studio where you can choose from an extensive collection of interior finishes such as hardwood flooring, granite and quartz countertops, tile, cabinetry and so much more.
ⓘ Source: listings_history table (triggers on properties + properties_extension) + one-shot
backfill from property_details.listing_events for pre-trigger history.
Climate risk First Street
- Flood 9/10 Extreme FEMA zone X (unshaded) · 99% chance over 30 yrs
- Wildfire 1/10 Low
- Heat 8/10 Severe 7 d/yr ≥100°F today · 18 d/yr by 30 yrs out
- Wind 8/10 Severe 80% chance of damaging wind over 30 yrs
- Air quality 2/10 Low 0 unhealthy d/yr today · 1 by 30 yrs out
Nearby sold comps map
Loading sold comps map…
Walkable amenities ~0.75 mi
Loading nearby amenities…
Taxation est. · year 1
- Rental income
- $53,400
- − Mortgage interest
- −$59,556
- − Property taxes
- −$15,948
- − Insurance
- −$5,983
- − Repairs & maintenance
- −$4,272
- − Management
- −$4,272
- − Depreciation
- −$30,930
- Taxable loss
- −$67,560
- Est. tax savings @ 24.0%
- +$16,214
- After-tax cash flow
- $-30,437/yr
For passive investors: Depreciation is non-cash, so a rental often shows a tax loss while cash-flowing — sheltering income. Rental losses are passive: they offset passive income freely, and up to $25,000/yr can offset ordinary (W-2) income if you actively participate and your MAGI is under $100k (phasing out to $0 by $150k); unused losses carry forward. On sale, claimed depreciation is recaptured at up to 25%, and gains may owe capital-gains tax (a 1031 exchange can defer both). Figures are a year-1 estimate at your 24.0% rate — not tax advice; consult a CPA.
Schools (NCES district)
- District
- Indian River School District
- NCES district ID
- 1000680
- Math proficiency
- 25% ▼ -27.00%
- Reading proficiency
- 41% ▼ -17.00%
- Median HH income
- $53,838
- Composite
- 28.99/100
- National rank
- #6620
- State rank
- #14 of 26 in DE
Livability — Ocean View
- Score
- 69/100
- State rank
- #27
- US rank
- #8560
Category grades
Schools grade is shown separately in the Schools card above.
Census & demographics
- Population (ZIP)
- 8,917
Population outlook (Sussex County) Hauer SSP2
- Today (2025)
- 248,853 people
- By 2030
- 264,464 · +6.3%
- By 2040
- 290,980 · +16.9%
- By 2050
- 311,259 · +25.1%
- By 2075
- 352,488 · +41.6%
- By 2100
- 367,406 · +47.6%
Race, ethnicity, and origin ACS 2023
- Neighborhood character
- Predominantly White (77%)
- Race & ethnicity
- White 77% Black 12% Hispanic / Latino 8% Two or more races 7%
- Hispanic origin (detail)
- Mexican 4%
- Common ancestry
- Romanian 3% Slovak 3% Lithuanian 1%
- Foreign-born
- 5% · Canada
- Languages at home
- 91% English-only · Spanish 8%
Political lean MEDSL · Sussex
- 2024 margin
- R (+11.0) · D 43.9% · R 54.9% · Other 1.2%
- 2008→2024 swing
- -2.4pp toward R · 2008: -8.6pp · 2024: -11.0pp
- All cycles
- 2024: R+11.0 2020: R+11.2 2016: R+22.0 2012: R+13.0 2008: R+8.6
Not yet ingested
- Civics
- —
Market trends
- HPI YoY
- ▲ 46.51%
- Current HPI
- 322.2407
- Rent YoY
- —
- Metro
- —
- State GDP YoY
- —
- F500 in state
- 0
Price history
+2.4% since first listed3 events — show timeline
- 2026-05-15 Price Changed $850,400 Zillow
- 2025-10-06 Price Changed $840,400 Zillow
- 2025-09-26 Listed $830,400 Zillow
Cash-flow waterfall
monthlySold comps — $/sqft
last 12 mo · ≤1 miLoading sold comps…