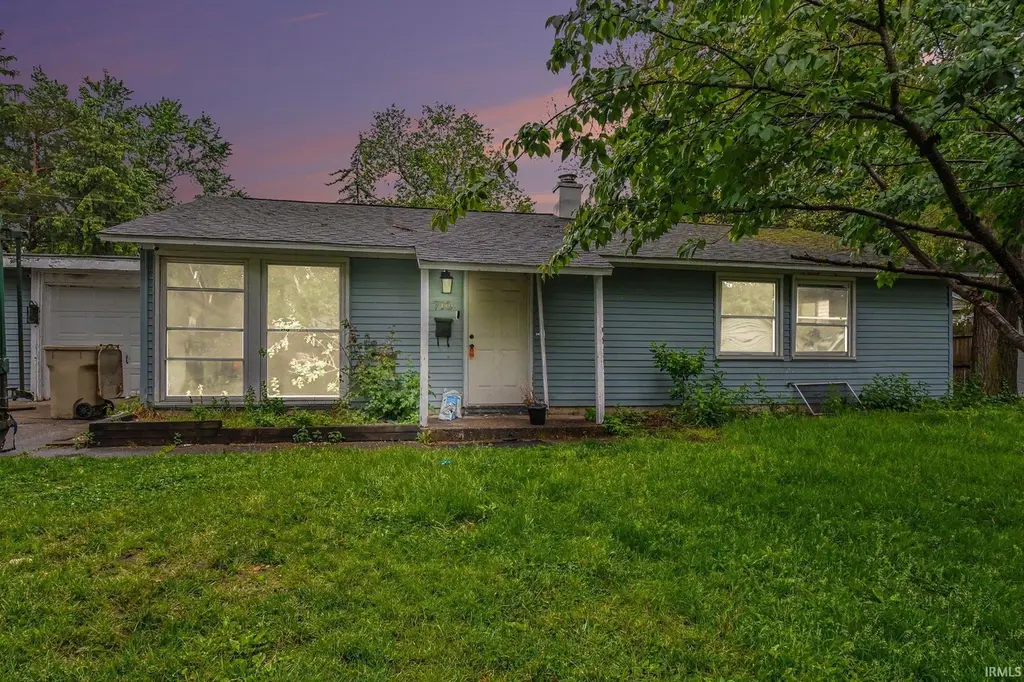
710 Patterson Dr · South Bend, IN
Flood risk 1/10 · Minimal
- FEMA flood zone
- X (unshaded)
- Chance of flooding over 30 yrs
- 0.0%
- Est. flood insurance / yr
- $507 – $1,088
Fire risk 1/10 · Minimal
- Est. fire insurance / yr
- $717 – $1,331
Heat risk 2/10 · Minimal
- Hot days now (above 99°F)
- 7 days/yr
- Hot days in 30 yrs
- 16 days/yr
Wind risk 2/10 · Minimal
- Chance of severe wind over 30 yrs
- —
Air-quality risk 3/10 · Minor
- Unhealthy air days now
- 2 days/yr
- Unhealthy air days in 30 yrs
- 3 days/yr
Risk factors via First Street. Map © Google.
Why this score? — see what drove the B grade
The composite is a weighted blend of 9 inputs, each scored 0–100. Each bar is that input's sub-score; the figure is the points it added to the 100-point composite (weight × sub-score).
- Cash flow +30.0/30.0
- ARV discount +15.0/15.0
- DSCR +10.0/10.0
- 1% rule +8.8/10.0
- Rent growth +4.1/5.0
- Livability +3.2/5.0
- Condition / age +2.5/5.0
- Schools +1.4/10.0
- Appreciation +0.0/10.0
$124,900
🖨 Deal sheet 📄 Offer letter ✓ Due diligence
Listing remarks
Opportunity awaits with this 4-bedroom ranch home in a great South Bend location! Perfect for a house flipper, rental investor, or buyer looking to build sweat equity. This property offers strong potential and is conveniently located near Notre Dame, Bethel University, golf courses, hospitals, shopping, the zoo, and many other amenities. Spacious layout with plenty of possibilities to make it your own. Property is being sold as-is. Don’t miss this chance to invest in a home with excellent upside in a highly desirable area!
Key facts
- Near notre dame
- Near hospitals
- Near shopping
Tags
Property features AI
Exterior
- Parking: Attached garage with 1 garage space
- Utilities: Public water; Public sewer
- Home design: Single-family residence; Site-built home; One-story
- Construction: Vinyl siding; Slab foundation; Built as site-built construction
- Exterior features: Irregular-shaped lot; Lot dimensions approximately 70 x 115
Interior
- Bathrooms: One full bathroom on the main level
- Heating & cooling: Central air conditioning; Forced air heating
- Interior features: 8 total rooms
- Laundry & utility: Washer hookup; Gas dryer hookup; Laundry on the main level
Neighborhood map
What this means for you Summary
Snapshot
- This is a 4-bed/1.5-bath single-family listed at $125k.
Deal economics
- At list price, monthly cash flow is $518 ($6k/yr) — positive.
- The deal already cash-flows at list — no discount required.
- Meets the 1% rule at list price ($2k rent vs $125k).
- Cap rate 11.3% vs local median 4.4% in South Bend — top-decile yield for the area; either an underpriced asset or a hidden risk that comps aren't pricing in. Stress-test before assuming the spread holds.
Location & tenants
- Location reads 64/100 on livability (#365 in IN) — a middle-class / working-renter tenant base. Strengths: cost of living A+, housing A+, health & safety A+; Watch: amenities D, employment D, crime F.
- South Bend Community School Corporation (urban): math 12% / reading 21% proficiency, ranked #284 of 301 in IN (top 94%) — low school quality limits family demand, transient renter base, plan for 1-2y turnover; 66% free/reduced lunch — lower-income household profile, screen leases tightly.
- Zoned schools: Mckinley Elementary School (math 12% / reading 12%, grade F, #893 of 994 statewide, top 91%, 513 students, 87% FRL); Edison Middle School (math 7% / reading 13%, grade F, #314 of 330 statewide, top 95%, 381 students, 84% FRL); Adams High School (math 28% / reading 57%, grade F, #195 of 369 statewide, top 53%, 1,976 students, 56% FRL).
- Market conditions: Rents rising fast (+6.3%/yr); 73 active listings in the ZIP; 9 comparable units currently listed for rent nearby; rentals leasing fast (median 14d on market — plan ~1-2 weeks tenant-placement turnaround); 754 units permitted in St. Joseph County in 2024 (460 in 5+ unit buildings).
- This rent runs 33% of the median local income ($63k/yr) — at the standard rent-burdened threshold; future hikes will face affordability resistance.
Forward outlook
- Local home prices are declining (-3.0%/yr); year-one equity from $864 of loan paydown is wiped out by about $4k of value loss. Plan a longer hold.
- At projected returns (-3.0% appreciation + 6.3% rent growth), your $35k cash investment doubles in ~6 years — after that, you're playing with house money.
Negotiation context
- Only 4 days on market — expect competitive offers; lowballing is unlikely to land.
Risks & watch-outs
- Watch-outs: built in 1953 — expect roof / HVAC / electrical / plumbing capex.
Questions for the listing agent
- Built in 1953 — when were the roof, HVAC, electrical panel, plumbing, and water heater last replaced?
- Is there a deadline driving the sale (1031 exchange, divorce, estate, relocation)? That informs how much negotiation room exists.
- Schools are F-rated, which usually means shorter tenancies and higher turnover. Who's the typical renter profile here, and what's been the actual vacancy rate?
- Crime grade is F in this area — have there been break-ins, vandalism, or insurance claims at this property in the last 3 years? What carrier currently insures it and at what premium?
- What's the average days-on-market for RENTAL listings here right now (not sales)? A rising rental-DOM trend means longer vacancies and softer asking-rent achievability than the comps imply.
- What's the recent tenant-quality profile in this submarket — average credit score on applications, eviction rate, late-payment / NSF rate, and stable-employment percentage? A property-management company in the area should have these aggregated.
- How much new for-sale + rental construction is in the pipeline within 1–3 miles? Heavy new supply typically softens prices + rents 12–24 months out; constrained supply supports both.
Investment metrics
- 1% rule
- 1.38% ✓
- Cap rate
- 11.27%
- Cash-on-cash
- 17.79%
- DSCR
- 1.79
- GRM
- 6.0
CMA / ARV
- ARV (on-the-fly)
- $191,688
- Comps found
- 12
Show comp detail 12 sales within ~0.75 mi
| Address | Dist | Beds/Ba | Sqft | Sold | Price | $/sf | Match |
|---|---|---|---|---|---|---|---|
| 710 Patterson Dr | 0.00mi | 4/1.0 | 1,176 (0%) | 0mo | $115,000 | $98 | 98 |
| 627 Manchester Dr | 0.13mi | 3/2.0 (-1) | 1,120 (-5%) | 1mo | $221,200 | $198 | 78 |
| 924 Whitehall Dr | 0.25mi | 3/1.5 (-1) | 1,120 (-5%) | 4mo | $210,000 | $188 | 72 |
| 3239 Essex Dr | 0.22mi | 3/1.5 (-1) | 1,274 (+8%) | 3mo | $208,000 | $163 | 69 |
| 1207 Manchester Dr | 0.47mi | 4/2.0 | 1,232 (+5%) | 1mo | $235,000 | $191 | 67 |
| 1117 Whitehall Dr | 0.37mi | 3/1.5 (-1) | 1,120 (-5%) | 6mo | $180,000 | $161 | 65 |
| 1239 Brummit Ln | 0.58mi | 4/2.0 | 1,232 (+5%) | 6mo | $196,887 | $160 | 58 |
| 3215 Bentley Ln | 0.42mi | 3/1.0 (-1) | 1,064 (-10%) | 3mo | $180,000 | $169 | 55 |
| 403 Manchester Dr | 0.37mi | 3/1.5 (-1) | 1,330 (+13%) | 2mo | $205,000 | $154 | 55 |
| 2530 Grape Rd | 0.72mi | 3/2.0 (-1) | 1,212 (+3%) | 6mo | $215,000 | $177 | 49 |
| 341 Imus Dr | 0.74mi | 3/1.0 (-1) | 1,288 (+10%) | 3mo | $178,000 | $138 | 40 |
| 2525 Benedict Ave | 0.66mi | 3/1.0 (-1) | 1,350 (+15%) | 6mo | $212,500 | $157 | 33 |
Match score weights: distance 35% · size 25% · config 20% · recency 20%. Top-matched comps best support the ARV.
Projected returns pro-forma
-3.0% appreciation · 6.27% rent growth · sell at horizon
- IRR
- 12.9%
- Equity multiple
- 1.53×
- Total profit
- $18,639
- Equity at exit
- $18,623
- IRR
- 24.2%
- Equity multiple
- 3.41×
- Total profit
- $84,456
- Equity at exit
- $10,799
Cash invested: $34,972 (down + closing). Projections, not guarantees.
Landlord ↔ Tenant lean methodology
- Overall (STATE)
- 90 Strongly Landlord-Friendly
- State Indiana
- 90 Strongly Landlord-Friendly · R+11
- County
- — inherits STATE
- City
- — inherits STATE
ZIP-level market 46615
- Home prices YoY
- -34.0%
- Rents YoY
- 6.3%
- Active inventory
- 73
- Price-to-rent
- 6.0×
Monthly cashflow live
- Estimated rent
- $1,720 high interval (Pro) →
- Mortgage (P&I)
- −$655
- Tax from tax record
- −$134 /mo · $1,605/yr
- Insurance
- −$52
- HOA
- −$0
- Vacancy / Maint / Mgmt
- −$361
- Net cashflow
- $518
Break-even live
UW: 25.0% down · 7.5% · 30yr · 1.5% tax · 5.0% vac · 8.0% maint · 8.0% mgmt
Financing live
Cash to close
- Down payment
- $31,225
- Closing costs
- $3,747
- Reserves months
- —
- Total cash needed
- —
Loan-product check · same deal, 3 products live
Conventional
25% down · 7.5% · 30yr
- Down + closing
- —
- Monthly P&I
- —
- Monthly cashflow
- —
- DSCR
- —
- Eligible?
- —
Personal DTI + credit; lowest rate.
DSCR
20% down · 8.5% · 30yr
- Down + closing
- —
- Monthly P&I
- —
- Monthly cashflow
- —
- DSCR
- —
- Eligible?
- —
No personal income docs; deal must DSCR.
Hard money
10% down · 12.0% · 12mo
- Down + closing
- —
- Monthly P&I
- —
- Monthly cashflow
- —
- DSCR
- —
- Eligible?
- —
Short-term bridge; refi at stabilization.
Rent comps 9 comps
| Address | Beds | Baths | Sqft | Rent | $/sqft | DOM | Units | Dist |
|---|---|---|---|---|---|---|---|---|
| 300 Pin Oak Cir Mishawaka, IN | 1.0–3.0 | 1.0–1.5 | 835 | $1,225 | $1.47 | 13d | 1 | 0.42mi |
| 117 Palau Ave Mishawaka, IN | 3.0 | 1.0 | 1100 | $1,650 | $1.50 | 13d | 1 | 1.00mi |
| 303 Village Dr Mishawaka, IN | 1.0–3.0 | 1.0–1.5 | 918 | $1,975 | $2.15 | 13d | 25 | 1.10mi |
| 302 Village Dr Mishawaka, IN | 1.0–3.0 | 1.0–1.5 | 950 | $2,043 | $2.15 | 13d | 33 | 1.20mi |
| 737 S 30th St South Bend, IN | 3.0 | 2.0 | 1000 | $1,600 | $1.60 | 43d | 1 | 1.20mi |
| 209 E Edgar Ave Mishawaka, IN | 3.0 | 1.0 | 1400 | $1,400 | $1.00 | 13d | 1 | 1.27mi |
| 754 S 23rd St South Bend, IN | 3.0 | 1.0 | 884 | $1,300 | $1.47 | 43d | 1 | 1.39mi |
| 819 S 24th St South Bend, IN | 3.0 | 2.0 | 1480 | $1,795 | $1.21 | 43d | 1 | 1.42mi |
| 1006 S 35th St South Bend, IN | 3.0 | 2.0 | 816 | $1,000 | $1.23 | 13d | 1 | 1.46mi |
Listing history 1 events
-
2026-05-23$124,900 Active
ⓘ Source: listings_history table (triggers on properties + properties_extension) + one-shot
backfill from property_details.listing_events for pre-trigger history.
Tax reassessment forecast IN · Partial reset (capped growth)
- Current annual tax
- $1,605 · $134/mo
- Projected year-2 tax
- $1,605 · $134/mo
- Expected delta
- $0/yr ($0/mo · 0.0%)
ⓘ Screening estimate from a state-policy table — verify with the county assessor before closing.
Climate risk First Street
- Flood 1/10 Low FEMA zone X (unshaded) · 0% chance over 30 yrs
- Wildfire 1/10 Low
- Heat 2/10 Low 7 d/yr ≥99°F today · 16 d/yr by 30 yrs out
- Wind 2/10 Low
- Air quality 3/10 Moderate 2 unhealthy d/yr today · 3 by 30 yrs out
Nearby sold comps map
Loading sold comps map…
Walkable amenities ~0.75 mi
Loading nearby amenities…
Taxation est. · year 1
- Rental income
- $20,646
- − Mortgage interest
- −$6,996
- − Property taxes
- −$1,605
- − Insurance
- −$624
- − Repairs & maintenance
- −$1,652
- − Management
- −$1,652
- − Depreciation
- −$3,633
- Taxable income
- $4,484
- Est. tax owed @ 24.0%
- −$1,076
- After-tax cash flow
- $5,145/yr
For passive investors: Depreciation is non-cash, so a rental often shows a tax loss while cash-flowing — sheltering income. Rental losses are passive: they offset passive income freely, and up to $25,000/yr can offset ordinary (W-2) income if you actively participate and your MAGI is under $100k (phasing out to $0 by $150k); unused losses carry forward. On sale, claimed depreciation is recaptured at up to 25%, and gains may owe capital-gains tax (a 1031 exchange can defer both). Figures are a year-1 estimate at your 24.0% rate — not tax advice; consult a CPA.
Schools (NCES district)
- District
- South Bend Community School Corporation
- NCES district ID
- 1810290
- Math proficiency
- 12% ▼ -10.00%
- Reading proficiency
- 21% ▼ -6.00%
- Median HH income
- $41,935
- Composite
- 14.21/100
- National rank
- #9452
- State rank
- #284 of 301 in IN
Livability — South Bend
- Score
- 64/100
- State rank
- #365
- US rank
- #13730
Category grades
Schools grade is shown separately in the Schools card above.
Census & demographics
- Census place
- South Bend, IN
- County
- Saint Joseph County · 189,048 people
- City population
- 99,767
- Metro
- South Bend-Mishawaka, IN-MI
- Population (ZIP)
- 14,190
- Household income
- $62,964
- Rent vs Own
- Severe rent burden
- 420.0
Population outlook (St. Joseph County) Hauer SSP2
- Today (2025)
- 273,186 people
- By 2030
- 273,594 · +0.1%
- By 2040
- 271,641 · -0.6%
- By 2050
- 269,187 · -1.5%
- By 2075
- 263,136 · -3.7%
- By 2100
- 245,659 · -10.1%
Race, ethnicity, and origin ACS 2023
- Neighborhood character
- Predominantly White (65%)
- Race & ethnicity
- White 65% Black 14% Two or more races 11% Hispanic / Latino 10% Asian 3%
- Hispanic origin (detail)
- Mexican 8%
- Common ancestry
- Romanian 6% Italian 2% Serbian 2%
- Foreign-born
- 8% · Canada, Vietnam
- Languages at home
- 87% English-only · Spanish 7% Tagalog/Filipino 1% Other Indo-European 1%
Political lean MEDSL · St. Joseph
- 2024 margin
- Toss-up / Even · D 50.0% · R 48.5% · Other 1.5%
- 2008→2024 swing
- -15.6pp toward R · 2008: 17.1pp · 2024: 1.5pp
- All cycles
- 2024: D+1.5 2020: D+5.8 2016: D+0.2 2012: D+3.5 2008: D+17.1
Not yet ingested
- Civics
- —
Market trends
- HPI YoY
- ▼ -124.82%
- Current HPI
- 242.1938
- Rent YoY
- ▲ 6.27%
- Metro
- South Bend-Mishawaka, IN-MI
- State GDP YoY
- ▲ 2.90%
- F500 in state
- 18
Industry mix (Fortune 500 HQ in IN)
| Industry | F500 HQs | Revenue |
|---|---|---|
| Industrial Machinery | 2 | $37B |
|
||
| Healthcare | 1 | $177B |
|
||
| Pharmaceuticals | 1 | $45B |
|
||
| Metals / Steel | 1 | $18B |
|
||
| Agriculture | 1 | $17B |
|
||
| Packaging | 1 | $12B |
|
||
Price history
1 event — show timeline
- 2026-05-23 Listed $124,900 IRMLS
Property tax history
+9.8%/yrLatest (2023): $1,605 · +4.9% YoY. Source: county tax records.
Cash-flow waterfall
monthlySold comps — $/sqft
last 12 mo · ≤1 miLoading sold comps…