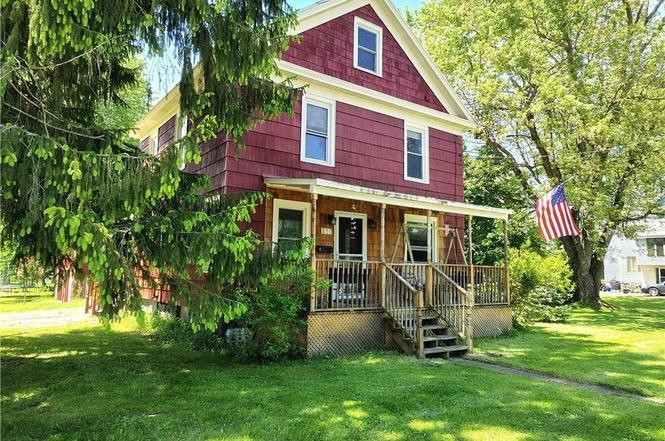
801 W Thomas St · Rome, NY
Flood risk 1/10 · Minimal
- FEMA flood zone
- X (unshaded)
- Chance of flooding over 30 yrs
- 0.0%
- Est. flood insurance / yr
- $473 – $860
Fire risk 3/10 · Minor
- Est. fire insurance / yr
- $691 – $1,283
Heat risk 3/10 · Minor
- Hot days now (above 94°F)
- 7 days/yr
- Hot days in 30 yrs
- 16 days/yr
Wind risk 1/10 · Minimal
- Chance of severe wind over 30 yrs
- —
Air-quality risk 2/10 · Minimal
- Unhealthy air days now
- 0 days/yr
- Unhealthy air days in 30 yrs
- 1 days/yr
Risk factors via First Street. Map © Google.
Why this score? — see what drove the D- grade
The composite is a weighted blend of 9 inputs, each scored 0–100. Each bar is that input's sub-score; the figure is the points it added to the 100-point composite (weight × sub-score).
- Cash flow +17.3/30.0
- DSCR +5.4/10.0
- 1% rule +3.8/10.0
- Schools +3.5/10.0
- Livability +3.2/5.0
- Rent growth +2.5/5.0
- Condition / age +2.5/5.0
- ARV discount +0.0/15.0
- Appreciation +0.0/10.0
$209,900
🖨 Deal sheet 📄 Offer letter ✓ Due diligence
Listing remarks
This property offers incredible value! Nestled on a spacious 1.2-acre lot, this inviting 4-bedroom, 2-bathroom home offers both comfort and versatility. The first floor features a large eat-in kitchen, perfect for family gatherings, with sliding glass doors that lead to a side porch, ideal for enjoying outdoor meals. A generously sized living room provides plenty of space to relax, while the remodeled full bath adds a touch of modern flair. The primary bedroom on the first floor offers convenience and privacy, along with a mudroom and laundry area to make daily tasks a breeze. Upstairs, you’ll find three additional bedrooms, each offering ample space, along with a second full bath fea
Key facts
- Large eat-in kitchen
- Primary bedroom
- Full attic
Tags
Neighborhood map
What this means for you Summary
Snapshot
- This is a 3-bed/1.0-bath single-family listed at $210k.
Deal economics
- At list price, monthly cash flow is $154 ($2k/yr) — positive.
- The deal already cash-flows at list — no discount required.
- To meet the 1% rule (rent ≥ 1% of price), the offer needs to be $184k (12.2% below list).
- Recommended offer: $184k (12.2% below list) — sets the bar for 1% rule.
- Cap rate 7.2% vs local median 5.6% in Rome — meaningfully above typical; check what's discounted (condition, days-on-market, listing class) to confirm the premium yield is real.
Location & tenants
- Location reads 64/100 on livability (#722 in NY) — a middle-class / working-renter tenant base. Strengths: cost of living A+, housing A+; Watch: health & safety C-, schools F, amenities F.
- Rome City School District (town): math 35% / reading 46% proficiency, ranked #516 of 590 in NY (top 88%) — families likely to look elsewhere, expect single-tenant / working-renter base with shorter leases.
- Market conditions: 272 active listings in the ZIP; 6 comparable units currently listed for rent nearby; rentals lingering (median 44d on market — plan ~5-8 weeks vacancy on turnover, expect pricing pressure); 100% of comp listings sitting > 30 days — soft ceiling on asking rent; 204 units permitted in Oneida County in 2024 (68 in 5+ unit buildings).
Forward outlook
- Local home prices are declining (-3.0%/yr); year-one equity from $1k of loan paydown is wiped out by about $6k of value loss. Plan a longer hold.
- Oneida County population projected at -12% by 2050 — secular population decline; favor cash flow + early exit over multi-decade hold.
Negotiation context
- It's been on market 123 days — a 12% lower offer ($185k) is reasonable based on typical stale-listing flexibility.
- 4 sale attempts since 8y ago with the ask held roughly flat each time — persistent listings suggest the price (not the market) is what's stuck; bring a comps-based counter.
- Current owner paid $30k; list at $210k implies a 588% gain — meaningful room to come down on a strong offer.
Risks & watch-outs
- Watch-outs: built in 1910 — expect roof / HVAC / electrical / plumbing capex.
Questions for the listing agent
- It's been on market 123 days. Have you received any prior offers? Is the seller open to a 12% concession, seller financing, or rate buy-down credit?
- Built in 1910 — when were the roof, HVAC, electrical panel, plumbing, and water heater last replaced?
- Why hasn't it sold? Are there any deal-killer items the seller is aware of (foundation, flood, title, zoning, code violations)?
- Is there a deadline driving the sale (1031 exchange, divorce, estate, relocation)? That informs how much negotiation room exists.
- Schools are F-rated, which usually means shorter tenancies and higher turnover. Who's the typical renter profile here, and what's been the actual vacancy rate?
- The area grade is low — what's the realistic commute time and amenity access for the typical tenant pool here? Any planned neighborhood developments (good or bad) we should know about?
- What's the average days-on-market for RENTAL listings here right now (not sales)? A rising rental-DOM trend means longer vacancies and softer asking-rent achievability than the comps imply.
- What's the recent tenant-quality profile in this submarket — average credit score on applications, eviction rate, late-payment / NSF rate, and stable-employment percentage? A property-management company in the area should have these aggregated.
- How much new for-sale + rental construction is in the pipeline within 1–3 miles? Heavy new supply typically softens prices + rents 12–24 months out; constrained supply supports both.
Investment metrics
- 1% rule
- 0.88% ✗
- Cap rate
- 7.18%
- Cash-on-cash
- 3.15%
- DSCR
- 1.14
- GRM
- 9.5
CMA / ARV
- ARV (on-the-fly)
- $165,000
- Comps found
- 12
Show comp detail 12 sales within ~0.75 mi
| Address | Dist | Beds/Ba | Sqft | Sold | Price | $/sf | Match |
|---|---|---|---|---|---|---|---|
| 623 W Thomas St | 0.36mi | 3/1.5 | 1,327 (+6%) | 2mo | $174,900 | $132 | 69 |
| 214-216 Hamilton St | 0.57mi | 3/1.0 | 1,264 (+1%) | 3mo | $182,380 | $144 | 69 |
| 901 Dewitt Ln | 0.19mi | 3/1.0 | 1,108 (-11%) | 5mo | $70,000 | $63 | 68 |
| 707 Union St | 0.28mi | 2/1.0 (-1) | 1,136 (-9%) | 3mo | $175,000 | $154 | 65 |
| 927 Croton St St | 0.63mi | 3/1.0 | 1,290 (+3%) | 1mo | $176,000 | $136 | 64 |
| 811 Massena Ave | 0.49mi | 3/1.0 | 1,157 (-7%) | 1mo | $241,900 | $209 | 64 |
| 511 Elm St | 0.50mi | 4/1.5 (+1) | 1,271 (+2%) | 6mo | $161,060 | $127 | 62 |
| 1100 Jervis Ave | 0.57mi | 4/1.0 (+1) | 1,326 (+6%) | 3mo | $190,000 | $143 | 56 |
| 523 William St | 0.49mi | 3/1.5 | 1,408 (+13%) | 3mo | $80,000 | $57 | 52 |
| 752 N Jay St | 0.63mi | 3/1.0 | 1,408 (+13%) | 1mo | $111,000 | $79 | 48 |
| 533 W Embargo St | 0.52mi | 2/2.0 (-1) | 1,122 (-10%) | 2mo | $136,210 | $121 | 48 |
| 609 Laurel St | 0.52mi | 2/1.0 (-1) | 1,105 (-12%) | 5mo | $135,000 | $122 | 47 |
Match score weights: distance 35% · size 25% · config 20% · recency 20%. Top-matched comps best support the ARV.
Projected returns pro-forma
-3.0% appreciation · 3.0% rent growth · sell at horizon
- IRR
- -11.4%
- Equity multiple
- 0.59×
- Total profit
- $-24,249
- Equity at exit
- $31,297
- IRR
- -2.2%
- Equity multiple
- 0.85×
- Total profit
- $-8,720
- Equity at exit
- $18,148
Cash invested: $58,772 (down + closing). Projections, not guarantees.
Landlord ↔ Tenant lean methodology
- Overall (STATE)
- 15 Strongly Tenant-Friendly
- State New York
- 15 Strongly Tenant-Friendly · D+10
- County
- — inherits STATE
- City
- — inherits STATE
ZIP-level market 13440
- Home prices YoY
- -8.0%
- Active inventory
- 272
- Price-to-rent
- 9.5×
Monthly cashflow live
- Estimated rent
- $1,843 high interval (Pro) →
- Mortgage (P&I)
- −$1,101
- Tax from tax record
- −$114 /mo · $1,362/yr
- Insurance
- −$87
- HOA
- −$0
- Vacancy / Maint / Mgmt
- −$387
- Net cashflow
- $154
Break-even live
UW: 25.0% down · 7.5% · 30yr · 1.5% tax · 5.0% vac · 8.0% maint · 8.0% mgmt
Financing live
Cash to close
- Down payment
- $52,475
- Closing costs
- $6,297
- Reserves months
- —
- Total cash needed
- —
Loan-product check · same deal, 3 products live
Conventional
25% down · 7.5% · 30yr
- Down + closing
- —
- Monthly P&I
- —
- Monthly cashflow
- —
- DSCR
- —
- Eligible?
- —
Personal DTI + credit; lowest rate.
DSCR
20% down · 8.5% · 30yr
- Down + closing
- —
- Monthly P&I
- —
- Monthly cashflow
- —
- DSCR
- —
- Eligible?
- —
No personal income docs; deal must DSCR.
Hard money
10% down · 12.0% · 12mo
- Down + closing
- —
- Monthly P&I
- —
- Monthly cashflow
- —
- DSCR
- —
- Eligible?
- —
Short-term bridge; refi at stabilization.
Rent comps 6 comps
| Address | Beds | Baths | Sqft | Rent | $/sqft | DOM | Units | Dist |
|---|---|---|---|---|---|---|---|---|
| 1027 Elwood St Rome, NY | 3.0 | 2.0 | 1200 | $1,500 | $1.25 | 43d | 1 | 0.73mi |
| 251 Liam Ln Unit 251 Rome, NY | 3.0 | 2.0 | 1577 | $2,750 | $1.74 | 43d | 1 | 0.78mi |
| 7805 Merrick Rd Unit 201 Rome, NY | 2.0 | 2.0 | 1200 | $2,000 | $1.67 | 43d | 1 | 0.95mi |
| 1611 Craig St Rome, NY | 3.0 | 1.0 | 1250 | $2,000 | $1.60 | 43d | 1 | 1.03mi |
| 183 W Dominick St Rome, NY | 1.0–2.0 | 1.0 | 845 | $904 | $1.07 | 43d | 1 | 1.17mi |
| 149 River St Unit 2 Rome, NY | 3.0 | 1.0 | 1160 | $1,500 | $1.29 | 44d | 1 | 1.34mi |
Listing history 13 events
-
2026-02-08status Pending
-
2026-02-02historical Active Under Contract
-
2025-11-21price $209,900
-
2025-10-08$214,900 Active
-
2025-10-08historical
-
2025-09-02price $224,900
-
2025-07-18price $232,900
-
2025-07-01price $239,900
-
2025-05-28$249,900 Active
-
2025-01-25historical
-
2025-01-20$209,900 Active
-
2019-08-08soldstatus $30,500
-
2018-08-21$30,000
ⓘ Source: listings_history table (triggers on properties + properties_extension) + one-shot
backfill from property_details.listing_events for pre-trigger history.
Tax reassessment forecast NY · Partial reset (capped growth)
- Current annual tax
- $1,362 · $114/mo
- Projected year-2 tax
- $2,455 · $205/mo
- Expected delta
- +$1,092/yr (+$91/mo · 80.2%)
ⓘ Screening estimate from a state-policy table — verify with the county assessor before closing.
Climate risk First Street
- Flood 1/10 Low FEMA zone X (unshaded) · 0% chance over 30 yrs
- Wildfire 3/10 Moderate
- Heat 3/10 Moderate 7 d/yr ≥94°F today · 16 d/yr by 30 yrs out
- Wind 1/10 Low
- Air quality 2/10 Low 0 unhealthy d/yr today · 1 by 30 yrs out
Nearby sold comps map
Loading sold comps map…
Walkable amenities ~0.75 mi
Loading nearby amenities…
Taxation est. · year 1
- Rental income
- $22,117
- − Mortgage interest
- −$11,758
- − Property taxes
- −$1,362
- − Insurance
- −$1,050
- − Repairs & maintenance
- −$1,769
- − Management
- −$1,769
- − Depreciation
- −$6,106
- Taxable loss
- −$1,698
- Est. tax savings @ 24.0%
- +$407
- After-tax cash flow
- $2,259/yr
For passive investors: Depreciation is non-cash, so a rental often shows a tax loss while cash-flowing — sheltering income. Rental losses are passive: they offset passive income freely, and up to $25,000/yr can offset ordinary (W-2) income if you actively participate and your MAGI is under $100k (phasing out to $0 by $150k); unused losses carry forward. On sale, claimed depreciation is recaptured at up to 25%, and gains may owe capital-gains tax (a 1031 exchange can defer both). Figures are a year-1 estimate at your 24.0% rate — not tax advice; consult a CPA.
Schools (NCES district)
- District
- Rome City School District
- NCES district ID
- 3624900
- Math proficiency
- 35% ▼ -4.00%
- Reading proficiency
- 46% ▲ 10.00%
- Median HH income
- $46,406
- Composite
- 34.52/100
- National rank
- #5178
- State rank
- #516 of 590 in NY
Livability — Rome
- Score
- 64/100
- State rank
- #722
- US rank
- #13676
Category grades
Schools grade is shown separately in the Schools card above.
Census & demographics
- Census place
- Rome, NY
- City population
- 41,418
- Population (ZIP)
- 41,273
Population outlook (Oneida County) Hauer SSP2
- Today (2025)
- 225,223 people
- By 2030
- 220,384 · -2.1%
- By 2040
- 209,071 · -7.2%
- By 2050
- 197,920 · -12.1%
- By 2075
- 175,541 · -22.1%
- By 2100
- 148,491 · -34.1%
Race, ethnicity, and origin ACS 2023
- Neighborhood character
- Predominantly White (82%)
- Race & ethnicity
- White 82% Hispanic / Latino 7% Two or more races 6% Black 4% Asian 1%
- Hispanic origin (detail)
- Mexican 1% Puerto Rican 4%
- Common ancestry
- Romanian 9% Lithuanian 4% Slovak 1%
- Foreign-born
- 3% · Canada, China
- Languages at home
- 94% English-only · Spanish 3% Other Indo-European 1%
Political lean MEDSL · Oneida
- 2024 margin
- Strong R (+21.3) · D 39.4% · R 60.6%
- 2008→2024 swing
- -15.2pp toward R · 2008: -6.1pp · 2024: -21.3pp
- All cycles
- 2024: R+21.3 2020: R+15.5 2016: R+21.1 2012: R+5.3 2008: R+6.1
Not yet ingested
- Civics
- —
Market trends
- HPI YoY
- ▼ -29.58%
- Current HPI
- 339.3589
- Rent YoY
- —
- Metro
- —
- State GDP YoY
- ▲ 2.60%
- F500 in state
- 92
Industry mix (Fortune 500 HQ in NY)
| Industry | F500 HQs | Revenue |
|---|---|---|
| Financial Services | 10 | $950B |
|
||
| Consumer Goods | 9 | $162B |
|
||
| Insurance | 4 | $225B |
|
||
| Telecommunications | 2 | $144B |
|
||
| Pharmaceuticals | 2 | $112B |
|
||
| Media / Entertainment | 2 | $69B |
|
||
Price history
+599.7% since first listed13 events — show timeline
- 2026-02-08 Pending — CNYIS
- 2026-02-02 Contingent — CNYIS
- 2025-11-21 Price Changed $209,900 CNYIS
- 2025-10-08 Listing Removed — CNYIS
- 2025-10-08 Listed $214,900 CNYIS
- 2025-09-02 Price Changed $224,900 CNYIS
- 2025-07-18 Price Changed $232,900 CNYIS
- 2025-07-01 Price Changed $239,900 CNYIS
- 2025-05-28 Listed $249,900 CNYIS
- 2025-01-25 Listing Removed — CNYIS
- 2025-01-20 Listed $209,900 CNYIS
- 2019-08-08 Sold (MLS) $30,500 CNYIS
- 2018-08-21 Listed $30,000 CNYIS
Property tax history
-2.2%/yrLatest (2025): $1,362 · +1.7% YoY. Source: county tax records.
Cash-flow waterfall
monthlySold comps — $/sqft
last 12 mo · ≤1 miLoading sold comps…