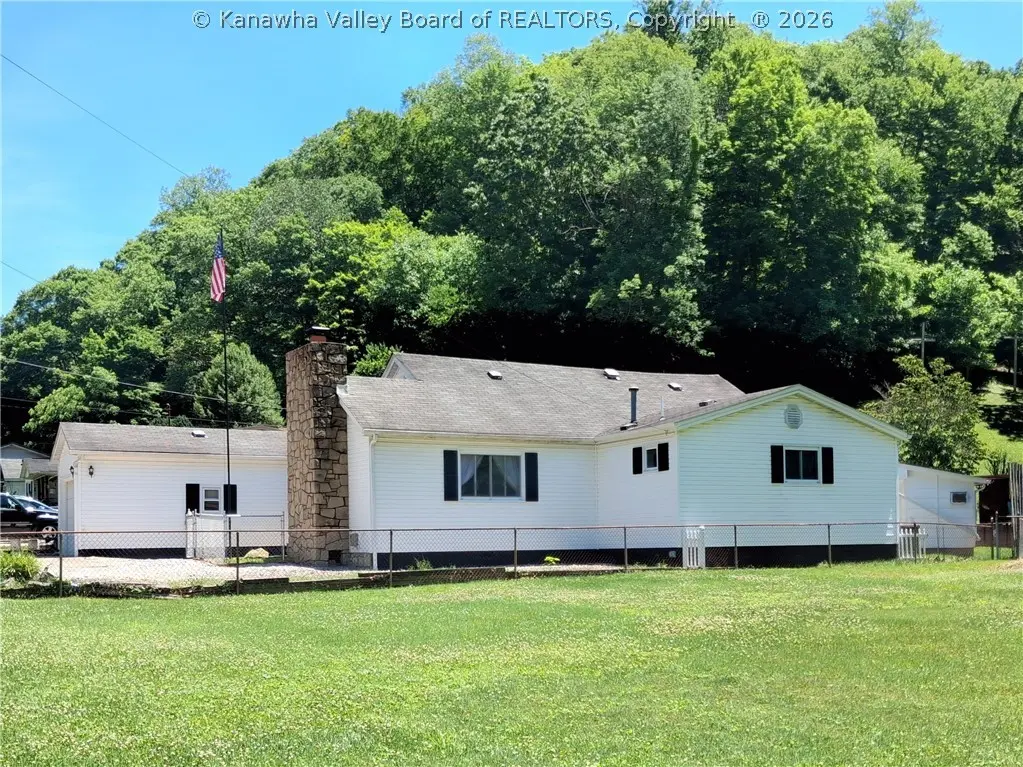
810 Thunderbird Dr · Rand, WV
Flood risk 8/10 · Major
- FEMA flood zone
- X (unshaded)
- Chance of flooding over 30 yrs
- 0.99%
- Est. flood insurance / yr
- $507 – $1,088
Fire risk 7/10 · Major
- Est. fire insurance / yr
- $787 – $1,461
Heat risk 5/10 · Moderate
- Hot days now (above 98°F)
- 7 days/yr
- Hot days in 30 yrs
- 20 days/yr
Wind risk 2/10 · Minimal
- Chance of severe wind over 30 yrs
- 1.0%
Air-quality risk 1/10 · Minimal
- Unhealthy air days now
- 0 days/yr
- Unhealthy air days in 30 yrs
- 0 days/yr
Risk factors via First Street. Map © Google.
Why this score? — see what drove the C+ grade
The composite is a weighted blend of 9 inputs, each scored 0–100. Each bar is that input's sub-score; the figure is the points it added to the 100-point composite (weight × sub-score).
- Cash flow +21.7/30.0
- ARV discount +7.5/15.0
- Appreciation +7.0/10.0
- DSCR +6.9/10.0
- 1% rule +4.7/10.0
- Rent growth +4.4/5.0
- Livability +3.2/5.0
- Schools +2.9/10.0
- Condition / age +2.5/5.0
$180,000
🖨 Deal sheet 📄 Offer letter ✓ Due diligence
Listing remarks MLS
Very nice home on level lot with completely fenced yard, detached garage, and has off street parking. Backyard is your private paradise with above ground pool, goldfish pond, and pool house with storage. Very tastefully landscaped.
Key facts
- Privacy fencing
- Tranquil pond
- Newer pool
Tags
Property features AI
Exterior
- Parking: Garage (1 car)
- Security: Smoke detector(s)
- Utilities: Public water; Public sewer; Cable available
- Home design: Single family residence; Residential property
- Construction: Frame construction
- Exterior features: Composition/shingle roof
Interior
- Kitchen: Electric range; Refrigerator
- Bedrooms: Total of 6 rooms (bedroom count not specified)
- Flooring: Carpet; Hardwood; Tile
- Bathrooms: 2 full bathrooms
- Heating & cooling: Wood stove; Electric heating; Forced air
- Interior features: Insulated windows; Smoke detector(s)
- Laundry & utility: No basement
Neighborhood map
What this means for you Summary
Snapshot
- This is a 3-bed/2.0-bath single-family listed at $180k.
Deal economics
- At list price, monthly cash flow is $211 ($3k/yr) — positive.
- The deal already cash-flows at list — no discount required.
- To meet the 1% rule (rent ≥ 1% of price), the offer needs to be $174k (3.3% below list).
- Recommended offer: $174k (3.3% below list) — sets the bar for 1% rule.
Location & tenants
- Location reads 64/100 on livability (#138 in WV) — a middle-class / working-renter tenant base. Strengths: cost of living A+; Watch: commute D+, amenities F, health & safety F.
- Kanawha County Schools (suburban): math 29% / reading 40% proficiency, ranked #17 of 55 in WV (top 31%) — families likely to look elsewhere, expect single-tenant / working-renter base with shorter leases.
- Zoned schools: Malden Elementary School (math 22% / reading 17%, grade F, #350 of 377 statewide, top 95%, 152 students, 0% FRL); Riverside High School (math 17% / reading 47%, grade F, #55 of 110 statewide, top 59%, 1,220 students, 0% FRL) — zoned schools average 0% FRL vs 46% district-wide (46 pts lower); this property's tenant base skews higher-income than the district average.
- Market conditions: Rents rising fast (+7.6%/yr); 24 active listings in the ZIP; 103 units permitted in Kanawha County in 2024 (0 in 5+ unit buildings).
Forward outlook
- In year one you build about $8k of equity ($1k loan paydown + $7k appreciation (4.0% local appreciation)).
- Kanawha County population projected at -17% by 2050 — secular population decline; favor cash flow + early exit over multi-decade hold.
- At projected returns (4.0% appreciation + 7.6% rent growth), your $50k cash investment doubles in ~4 years — after that, you're playing with house money.
- By year 5, paydown + projected appreciation supports a ~$36k cash-out refi (75% LTV) — recoverable capital for the next deal without selling this one.
Negotiation context
- It's been on market 21 days — a 2% lower offer ($177k) is reasonable based on typical stale-listing flexibility.
- 2 sale attempts since 4y ago with the ask held roughly flat each time — persistent listings suggest the price (not the market) is what's stuck; bring a comps-based counter.
- Current owner paid $142k; 27% above their basis — modest negotiation headroom, anchor on the comps not their cost.
Risks & watch-outs
- Watch-outs: flood insurance adds $66/mo; built in 1953 — expect roof / HVAC / electrical / plumbing capex.
- Climate carrying-cost: severe flood risk; major wildfire risk; extreme-heat days projected 7→20/yr by 2055 (HVAC capex compounding) — expect insurance premiums to compound above CPI over the hold.
Questions for the listing agent
- Built in 1953 — when were the roof, HVAC, electrical panel, plumbing, and water heater last replaced?
- What's the actual annual flood-insurance premium (NFIP or private), and is the property in a SFHA with mandatory coverage?
- Is there a deadline driving the sale (1031 exchange, divorce, estate, relocation)? That informs how much negotiation room exists.
- Schools are F-rated, which usually means shorter tenancies and higher turnover. Who's the typical renter profile here, and what's been the actual vacancy rate?
- What's the average days-on-market for RENTAL listings here right now (not sales)? A rising rental-DOM trend means longer vacancies and softer asking-rent achievability than the comps imply.
- What's the recent tenant-quality profile in this submarket — average credit score on applications, eviction rate, late-payment / NSF rate, and stable-employment percentage? A property-management company in the area should have these aggregated.
- How much new for-sale + rental construction is in the pipeline within 1–3 miles? Heavy new supply typically softens prices + rents 12–24 months out; constrained supply supports both.
Investment metrics
- 1% rule
- 0.97% ✗
- Cap rate
- 8.14%
- Cash-on-cash
- 6.61%
- DSCR
- 1.29
- GRM
- 8.6
CMA / ARV
No comps found within radius.
Projected returns pro-forma
3.99% appreciation · 7.59% rent growth · sell at horizon
- IRR
- 17.1%
- Equity multiple
- 2.05×
- Total profit
- $53,128
- Equity at exit
- $91,157
- IRR
- 20.0%
- Equity multiple
- 4.46×
- Total profit
- $174,216
- Equity at exit
- $149,010
Cash invested: $50,400 (down + closing). Projections, not guarantees.
Landlord ↔ Tenant lean methodology
- Overall (STATE)
- 83 Strongly Landlord-Friendly
- State West Virginia
- 83 Strongly Landlord-Friendly · R+22
- County
- — inherits STATE
- City
- — inherits STATE
ZIP-level market 25306
- Home prices YoY
- 2.1%
- Rents YoY
- 7.6%
- Active inventory
- 24
- Price-to-rent
- 8.6×
Monthly cashflow live
- Estimated rent
- $1,740 medium interval (Pro) →
- Mortgage (P&I)
- −$944
- Tax from tax record
- −$78 /mo · $934/yr
- Insurance
- −$75
- Flood insurance flood zone
- −$66 /mo · $798/yr
- HOA
- −$0
- Vacancy / Maint / Mgmt
- −$365
- Net cashflow
- $211
Break-even live
UW: 25.0% down · 7.5% · 30yr · 1.5% tax · 5.0% vac · 8.0% maint · 8.0% mgmt
Financing live
Cash to close
- Down payment
- $45,000
- Closing costs
- $5,400
- Reserves months
- —
- Total cash needed
- —
Loan-product check · same deal, 3 products live
Conventional
25% down · 7.5% · 30yr
- Down + closing
- —
- Monthly P&I
- —
- Monthly cashflow
- —
- DSCR
- —
- Eligible?
- —
Personal DTI + credit; lowest rate.
DSCR
20% down · 8.5% · 30yr
- Down + closing
- —
- Monthly P&I
- —
- Monthly cashflow
- —
- DSCR
- —
- Eligible?
- —
No personal income docs; deal must DSCR.
Hard money
10% down · 12.0% · 12mo
- Down + closing
- —
- Monthly P&I
- —
- Monthly cashflow
- —
- DSCR
- —
- Eligible?
- —
Short-term bridge; refi at stabilization.
Listing history 20 events
-
2026-06-19days on market $180,000 Active 21 DOM
-
2026-06-18days on market $180,000 Active 20 DOM
-
2026-06-17days on market $180,000 Active 19 DOM
-
2026-06-16days on market $180,000 Active 18 DOM
-
2026-06-15days on market $180,000 Active 17 DOM
-
2026-06-14days on market $180,000 Active 15 DOM
-
2026-06-12days on market $180,000 Active 14 DOM
-
2026-06-09days on market $180,000 Active 11 DOM
-
2026-06-08days on market $180,000 Active 10 DOM
-
2026-06-07days on market $180,000 Active 9 DOM
-
2026-06-05days on market $180,000 Active 6 DOM
-
2026-06-03days on market $180,000 Active 5 DOM
-
2026-06-02days on market $180,000 Active 4 DOM
-
2026-06-01days on market $180,000 Active 3 DOM
-
2026-05-31days on market $180,000 Active 2 DOM
-
2026-05-29$180,000 Active
-
2022-07-28soldstatus $142,000
-
2022-07-27soldstatus $142,000 231-char remark
Show marketing remark (231 chars)
Very nice home on level lot with completely fenced yard, detached garage, and has off street parking. Backyard is your private paradise with above ground pool, goldfish pond, and pool house with storage. Very tastefully landscaped.
-
2022-05-31$142,000 231-char remark
Show marketing remark (231 chars)
Very nice home on level lot with completely fenced yard, detached garage, and has off street parking. Backyard is your private paradise with above ground pool, goldfish pond, and pool house with storage. Very tastefully landscaped.
-
1996-12-05soldstatus $55,000
ⓘ Source: listings_history table (triggers on properties + properties_extension) + one-shot
backfill from property_details.listing_events for pre-trigger history.
Tax reassessment forecast WV · Resets to sale price
- Current annual tax
- $934 · $78/mo
- Projected year-2 tax
- $1,062 · $88/mo
- Expected delta
- +$128/yr (+$11/mo · 13.8%)
ⓘ Screening estimate from a state-policy table — verify with the county assessor before closing.
Climate risk First Street
- Flood 8/10 Severe FEMA zone X (unshaded) · 99% chance over 30 yrs
- Wildfire 7/10 Severe
- Heat 5/10 Major 7 d/yr ≥98°F today · 20 d/yr by 30 yrs out
- Wind 2/10 Low 100% chance of damaging wind over 30 yrs
- Air quality 1/10 Low 0 unhealthy d/yr today · 0 by 30 yrs out
Nearby sold comps map
Loading sold comps map…
Walkable amenities ~0.75 mi
Loading nearby amenities…
Taxation est. · year 1
- Rental income
- $20,877
- − Mortgage interest
- −$10,083
- − Property taxes
- −$934
- − Insurance
- −$1,697
- − Repairs & maintenance
- −$1,670
- − Management
- −$1,670
- − Depreciation
- −$5,236
- Taxable loss
- −$413
- Est. tax savings @ 24.0%
- +$99
- After-tax cash flow
- $2,634/yr
For passive investors: Depreciation is non-cash, so a rental often shows a tax loss while cash-flowing — sheltering income. Rental losses are passive: they offset passive income freely, and up to $25,000/yr can offset ordinary (W-2) income if you actively participate and your MAGI is under $100k (phasing out to $0 by $150k); unused losses carry forward. On sale, claimed depreciation is recaptured at up to 25%, and gains may owe capital-gains tax (a 1031 exchange can defer both). Figures are a year-1 estimate at your 24.0% rate — not tax advice; consult a CPA.
Schools (NCES district)
- District
- Kanawha County Schools
- NCES district ID
- 5400600
- Math proficiency
- 29% ▼ -13.00%
- Reading proficiency
- 40% ▼ -7.00%
- Median HH income
- $44,329
- Composite
- 29.35/100
- National rank
- #6540
- State rank
- #17 of 55 in WV
Livability — Rand
- Score
- 64/100
- State rank
- #138
- US rank
- #13922
Category grades
Schools grade is shown separately in the Schools card above.
Census & demographics
- County
- Kanawha County · 33,502 people
- Metro
- Charleston, WV
- Population (ZIP)
- 6,040
- Household income
- $71,654
- Rent vs Own
- Severe rent burden
- 124.0
Population outlook (Kanawha County) Hauer SSP2
- Today (2025)
- 178,946 people
- By 2030
- 172,906 · -3.4%
- By 2040
- 159,874 · -10.7%
- By 2050
- 148,148 · -17.2%
- By 2075
- 123,257 · -31.1%
- By 2100
- 96,454 · -46.1%
Race, ethnicity, and origin ACS 2023
- Neighborhood character
- Predominantly White (86%)
- Race & ethnicity
- White 86% Black 6% Hispanic / Latino 3% Two or more races 3% Asian 3%
- Common ancestry
- Italian 4% Slovak 3% Iranian 1%
- Foreign-born
- 3% · Canada
- Languages at home
- 97% English-only · Other Asian/Pacific 1% Other Indo-European 1%
Political lean MEDSL · Kanawha
- 2024 margin
- R (+17.4) · D 40.2% · R 57.6% · Other 2.2%
- 2008→2024 swing
- -17.0pp toward R · 2008: -0.4pp · 2024: -17.4pp
- All cycles
- 2024: R+17.4 2020: R+14.7 2016: R+20.6 2012: R+11.9 2008: R+0.4
Not yet ingested
- Civics
- —
Market trends
- HPI YoY
- ▲ 3.99%
- Current HPI
- 195.9623
- Rent YoY
- ▲ 7.59%
- Metro
- Charleston, WV
- State GDP YoY
- —
- F500 in state
- 0
Price history
+227.3% since first listed5 events — show timeline
- 2026-05-29 Listed $180,000 KVBOR
- 2022-07-28 Sold (Public Records) $142,000 Public Records
- 2022-07-27 Sold (MLS) $142,000 KVBOR
- 2022-05-31 Listed $142,000 KVBOR
- 1996-12-05 Sold (Public Records) $55,000 Public Records
Property tax history
+6.0%/yrLatest (2025): $934 · -2.1% YoY. Source: county tax records.
Cash-flow waterfall
monthlySold comps — $/sqft
last 12 mo · ≤1 miLoading sold comps…