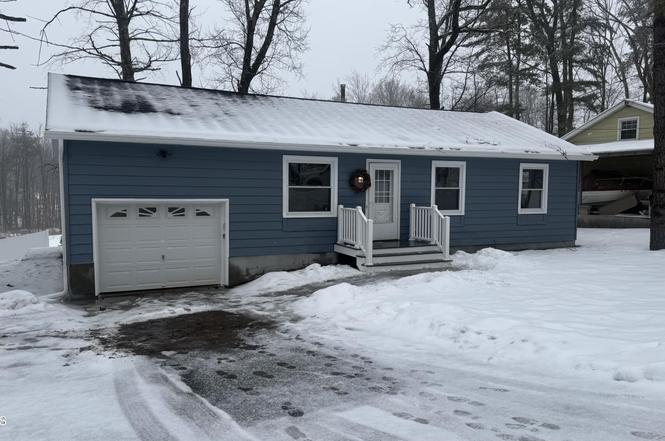
24 Birchwood Ln · North Ballston Spa, NY
Flood risk 1/10 · Minimal
- FEMA flood zone
- X
- Chance of flooding over 30 yrs
- 0.0%
- Est. flood insurance / yr
- $473 – $860
Fire risk 3/10 · Minor
- Est. fire insurance / yr
- $691 – $1,283
Heat risk 3/10 · Minor
- Hot days now (above 97°F)
- 7 days/yr
- Hot days in 30 yrs
- 16 days/yr
Wind risk 3/10 · Minor
- Chance of severe wind over 30 yrs
- 5.0%
Air-quality risk 2/10 · Minimal
- Unhealthy air days now
- 0 days/yr
- Unhealthy air days in 30 yrs
- 1 days/yr
Risk factors via First Street. Map © Google.
Why this score? — see what drove the D grade
The composite is a weighted blend of 9 inputs, each scored 0–100. Each bar is that input's sub-score; the figure is the points it added to the 100-point composite (weight × sub-score).
- Cash flow +12.7/30.0
- ARV discount +6.5/15.0
- Rent growth +5.0/5.0
- Schools +4.8/10.0
- DSCR +3.8/10.0
- Livability +3.6/5.0
- 1% rule +3.4/10.0
- Condition / age +2.5/5.0
- Appreciation +0.0/10.0
$319,000
🖨 Deal sheet (PDF) 📄 Offer letter ✓ Due diligence
Listing remarks MLS
Ranch home in Ballston Spa School district with 4 bedrooms. Large back yard perfect for entertaining. Make your appointment today!
Key facts
- Spacious lot
- New walkway
- Vinyl railings
Tags
Neighborhood map
What this means for you Summary
Snapshot
- This is a 4-bed/1.0-bath single-family listed at $319k.
Deal economics
- At list price, monthly cash flow is $-35 ($-422/yr) — negative.
- To cash-flow at today's rent, offer at most $313k (1.9% below list).
- To meet the 1% rule (rent ≥ 1% of price), the offer needs to be $268k (15.8% below list).
- Recommended offer: $268k (15.8% below list) — sets the bar for 1% rule.
Location & tenants
- Location reads 72/100 on livability (#370 in NY) — a middle-class / working-renter tenant base. Strengths: crime A+, housing A+, health & safety A+; Watch: amenities F, commute F.
- Ballston Spa Central School District (suburban): math 54% / reading 55% proficiency, ranked #289 of 590 in NY (top 49%) — acceptable for families but not a draw, mixed tenant base, ~2y average lease.
- Zoned schools: Malta Avenue Elementary School (math 52% / reading 57%, grade C, #908 of 2,108 statewide, top 46%, 342 students, 29% FRL); Ballston Spa Middle School (math 40% / reading 59%, grade C, #280 of 729 statewide, top 40%, 945 students, 32% FRL); Ballston Spa Senior High School (math 92% / reading 64%, grade A-, #568 of 1,100 statewide, top 52%, 1,249 students, 32% FRL).
- Market conditions: Rents rising fast (+11.3%/yr); 225 active listings in the ZIP; solid renter incomes; 1,132 units permitted in Saratoga County in 2024 (378 in 5+ unit buildings).
- This rent runs 30% of the median local income ($107k/yr) — at the standard rent-burdened threshold; future hikes will face affordability resistance.
Forward outlook
- Local home prices are declining (-3.0%/yr); year-one equity from $2k of loan paydown is wiped out by about $10k of value loss. Plan a longer hold.
- Saratoga County population projected at +4% by 2050 — modest demand growth; plan on rents tracking national, not racing it.
Negotiation context
- It's been on market 32 days — a 3% lower offer ($309k) is reasonable based on typical stale-listing flexibility.
- 7 sale attempts since 4y ago with the ask held roughly flat each time — persistent listings suggest the price (not the market) is what's stuck; bring a comps-based counter.
- Current owner paid $245k; 30% above their basis — modest negotiation headroom, anchor on the comps not their cost.
Questions for the listing agent
- What do current leases actually rent for vs. the listed asking? Can we see a recent rent roll and the last 12 months of T-12 income?
- It's been on market 32 days. Have you received any prior offers? Is the seller open to a 16% concession, seller financing, or rate buy-down credit?
- Built in 1969 — when were the roof, HVAC, electrical panel, plumbing, and water heater last replaced?
- Is there a deadline driving the sale (1031 exchange, divorce, estate, relocation)? That informs how much negotiation room exists.
- Schools are F-rated, which usually means shorter tenancies and higher turnover. Who's the typical renter profile here, and what's been the actual vacancy rate?
- The area grade is low — what's the realistic commute time and amenity access for the typical tenant pool here? Any planned neighborhood developments (good or bad) we should know about?
- What's the average days-on-market for RENTAL listings here right now (not sales)? A rising rental-DOM trend means longer vacancies and softer asking-rent achievability than the comps imply.
- What's the recent tenant-quality profile in this submarket — average credit score on applications, eviction rate, late-payment / NSF rate, and stable-employment percentage? A property-management company in the area should have these aggregated.
- How much new for-sale + rental construction is in the pipeline within 1–3 miles? Heavy new supply typically softens prices + rents 12–24 months out; constrained supply supports both.
Investment metrics
- 1% rule
- 0.84% ✗
- Cap rate
- 6.16%
- Cash-on-cash
- -0.47%
- DSCR
- 0.98
- GRM
- 9.9
CMA / ARV
- ARV (on-the-fly)
- $311,984
- Comps found
- 6
Show comp detail 6 sales within ~0.75 mi
| Address | Dist | Beds/Ba | Sqft | Sold | Price | $/sf | Match |
|---|---|---|---|---|---|---|---|
| 24 Birchwood Ln | 0.00mi | 4/1.0 | 1,147 (0%) | 1mo | $304,500 | $265 | 100 |
| 211 Northline Rd | 0.25mi | 4/1.0 | 1,176 (+2%) | 18mo | $215,000 | $183 | 69 |
| 40 Lee St | 0.57mi | 3/2.0 (-1) | 1,240 (+8%) | 2mo | $435,000 | $351 | 49 |
| 706 Arnold St | 0.56mi | 3/1.0 (-1) | 1,050 (-8%) | 22mo | $303,000 | $289 | 37 |
| 404 Milton Ave | 0.64mi | 3/1.0 (-1) | 1,212 (+6%) | 23mo | $330,000 | $272 | 37 |
| 26 Center St | 0.71mi | 3/1.5 (-1) | 1,292 (+13%) | 9mo | $299,900 | $232 | 32 |
Match score weights: distance 35% · size 25% · config 20% · recency 20%. Top-matched comps best support the ARV.
Projected returns pro-forma
-3.0% appreciation · 8.0% rent growth · sell at horizon
- IRR
- -11.7%
- Equity multiple
- 0.56×
- Total profit
- $-39,735
- Equity at exit
- $47,564
- IRR
- 3.4%
- Equity multiple
- 1.30×
- Total profit
- $27,125
- Equity at exit
- $27,581
Cash invested: $89,320 (down + closing). Projections, not guarantees.
Landlord ↔ Tenant lean methodology
- Overall (STATE)
- 15 Strongly Tenant-Friendly
- State New York
- 15 Strongly Tenant-Friendly · D+10
- County
- — inherits STATE
- City
- — inherits STATE
ZIP-level market 12020
- Home prices YoY
- -14.8%
- Rents YoY
- 11.3%
- Active inventory
- 225
- Price-to-rent
- 9.9×
Monthly cashflow live
- Estimated rent
- $2,684 medium interval (Pro) →
- Mortgage (P&I)
- −$1,673
- Tax from tax record
- −$350 /mo · $4,201/yr
- Insurance
- −$133
- HOA
- −$0
- Vacancy / Maint / Mgmt
- −$564
- Net cashflow
- $-35
Break-even live
Sensitivity live
| Price | -10% $145 | -5% $55 | +0% $-35 | +5% $-125 | +10% $-216 |
|---|---|---|---|---|---|
| Rent | -10% $-247 | -5% $-141 | +0% $-35 | +5% $71 | +10% $177 |
| Rate | -1.0pp $125 | -0.5pp $46 | base $-35 | +0.5pp $-118 | +1.0pp $-202 |
UW: 25.0% down · 7.5% · 30yr · 1.5% tax · 5.0% vac · 8.0% maint · 8.0% mgmt
Financing live
Cash to close
- Down payment
- $79,750
- Closing costs
- $9,570
- Reserves months
- —
- Total cash needed
- —
Loan-product check · same deal, 3 products live
Conventional
25% down · 7.5% · 30yr
- Down + closing
- —
- Monthly P&I
- —
- Monthly cashflow
- —
- DSCR
- —
- Eligible?
- —
Personal DTI + credit; lowest rate.
DSCR
20% down · 8.5% · 30yr
- Down + closing
- —
- Monthly P&I
- —
- Monthly cashflow
- —
- DSCR
- —
- Eligible?
- —
No personal income docs; deal must DSCR.
Hard money
10% down · 12.0% · 12mo
- Down + closing
- —
- Monthly P&I
- —
- Monthly cashflow
- —
- DSCR
- —
- Eligible?
- —
Short-term bridge; refi at stabilization.
Listing history 20 events
-
2026-03-23status Pending
-
2026-03-16price $319,000
-
2026-02-19$329,000 Active
-
2026-01-14status Pending
-
2026-01-12historical
-
2026-01-08$319,000 Active
-
2023-10-18soldstatus $245,000
-
2023-08-04soldstatus $245,000 Closed 130-char remark
Show marketing remark (130 chars)
Ranch home in Ballston Spa School district with 4 bedrooms. Large back yard perfect for entertaining. Make your appointment today!
-
2023-05-19status Pending 130-char remark
Show marketing remark (130 chars)
Ranch home in Ballston Spa School district with 4 bedrooms. Large back yard perfect for entertaining. Make your appointment today!
-
2023-05-08$235,900 Active 130-char remark
Show marketing remark (130 chars)
Ranch home in Ballston Spa School district with 4 bedrooms. Large back yard perfect for entertaining. Make your appointment today!
-
2023-02-01historical
-
2023-01-09status Pending
-
2023-01-03status Active
-
2023-01-03historical
-
2022-12-21status Active
-
2022-12-05historical
-
2022-09-27price $224,900
-
2022-09-03historical
-
2022-09-02$232,900 Active
-
2022-07-25$239,900 Active
ⓘ Source: listings_history table (triggers on properties + properties_extension) + one-shot
backfill from property_details.listing_events for pre-trigger history.
Tax reassessment forecast NY · Partial reset (capped growth)
- Current annual tax
- $4,201 · $350/mo
- Projected year-2 tax
- $4,796 · $400/mo
- Expected delta
- +$595/yr (+$50/mo · 14.2%)
ⓘ Screening estimate from a state-policy table — verify with the county assessor before closing.
Climate risk First Street
- Flood 1/10 Low FEMA zone X · 0% chance over 30 yrs
- Wildfire 3/10 Moderate
- Heat 3/10 Moderate 7 d/yr ≥97°F today · 16 d/yr by 30 yrs out
- Wind 3/10 Moderate 5% chance of damaging wind over 30 yrs
- Air quality 2/10 Low 0 unhealthy d/yr today · 1 by 30 yrs out
Nearby sold comps map
Loading sold comps map…
Walkable amenities ~0.75 mi
Loading nearby amenities…
Taxation est. · year 1
- Rental income
- $32,213
- − Mortgage interest
- −$17,869
- − Property taxes
- −$4,201
- − Insurance
- −$1,595
- − Repairs & maintenance
- −$2,577
- − Management
- −$2,577
- − Depreciation
- −$9,280
- Taxable loss
- −$5,886
- Est. tax savings @ 24.0%
- +$1,413
- After-tax cash flow
- $990/yr
For passive investors: Depreciation is non-cash, so a rental often shows a tax loss while cash-flowing — sheltering income. Rental losses are passive: they offset passive income freely, and up to $25,000/yr can offset ordinary (W-2) income if you actively participate and your MAGI is under $100k (phasing out to $0 by $150k); unused losses carry forward. On sale, claimed depreciation is recaptured at up to 25%, and gains may owe capital-gains tax (a 1031 exchange can defer both). Figures are a year-1 estimate at your 24.0% rate — not tax advice; consult a CPA.
Schools (NCES district)
- District
- Ballston Spa Central School District
- NCES district ID
- 3603930
- Math proficiency
- 54% ▼ -13.00%
- Reading proficiency
- 55% ▼ -4.00%
- Median HH income
- $66,705
- Composite
- 48.12/100
- National rank
- #2184
- State rank
- #289 of 590 in NY
Livability — North Ballston Spa
- Score
- 72/100
- State rank
- #370
- US rank
- #6403
Category grades
Schools grade is shown separately in the Schools card above.
Census & demographics
- Census place
- North Ballston Spa, NY
- County
- Saratoga County · 166,192 people
- Metro
- Albany-Schenectady-Troy, NY
- Population (ZIP)
- 34,937
- Household income
- $107,112
- Rent vs Own
- Severe rent burden
- 607.0
Population outlook (Saratoga County) Hauer SSP2
- Today (2025)
- 238,889 people
- By 2030
- 243,681 · +2.0%
- By 2040
- 249,118 · +4.3%
- By 2050
- 248,638 · +4.1%
- By 2075
- 241,675 · +1.2%
- By 2100
- 213,150 · -10.8%
Race, ethnicity, and origin ACS 2023
- Neighborhood character
- Predominantly White (89%)
- Race & ethnicity
- White 89% Two or more races 4% Hispanic / Latino 4% Asian 2% Black 2%
- Common ancestry
- Romanian 6% Lithuanian 6% Iranian 2%
- Foreign-born
- 4% · Canada, China
- Languages at home
- 95% English-only · Chinese 1% Spanish 1% Other Asian/Pacific 1%
Political lean MEDSL · Saratoga
- 2024 margin
- Toss-up / Even · D 50.9% · R 49.1%
- 2008→2024 swing
- -1.6pp toward R · 2008: 3.4pp · 2024: 1.8pp
- All cycles
- 2024: D+1.8 2020: D+5.4 2016: R+4.4 2012: D+2.1 2008: D+3.4
Not yet ingested
- Civics
- —
Market trends
- HPI YoY
- ▼ -60.23%
- Current HPI
- 346.5996
- Rent YoY
- ▲ 11.26%
- Metro
- Albany-Schenectady-Troy, NY
- State GDP YoY
- ▲ 2.60%
- F500 in state
- 92
Industry mix (Fortune 500 HQ in NY)
| Industry | F500 HQs | Revenue |
|---|---|---|
| Financial Services | 10 | $950B |
|
||
| Consumer Goods | 9 | $162B |
|
||
| Insurance | 4 | $225B |
|
||
| Telecommunications | 2 | $144B |
|
||
| Pharmaceuticals | 2 | $112B |
|
||
| Media / Entertainment | 2 | $69B |
|
||
Price history
+33.0% since first listed20 events — show timeline
- 2026-03-23 Pending — Global MLS
- 2026-03-16 Price Changed $319,000 Global MLS
- 2026-02-19 Listed $329,000 Global MLS
- 2026-01-14 Pending — Global MLS
- 2026-01-12 Listing Removed — Global MLS
- 2026-01-08 Listed $319,000 Global MLS
- 2023-10-18 Sold (Public Records) $245,000 Public Records
- 2023-08-04 Sold (MLS) $245,000 Global MLS
- 2023-05-19 Pending — Global MLS
- 2023-05-08 Listed $235,900 Global MLS
- 2023-02-01 Listing Removed — Global MLS
- 2023-01-09 Pending — Global MLS
- 2023-01-03 Relisted — Global MLS
- 2023-01-03 Listing Removed — Global MLS
- 2022-12-21 Relisted — Global MLS
- 2022-12-05 Listing Removed — Global MLS
- 2022-09-27 Price Changed $224,900 Global MLS
- 2022-09-03 Listing Removed — Global MLS
- 2022-09-02 Listed $232,900 Global MLS
- 2022-07-25 Listed $239,900 Global MLS
Property tax history
+2.0%/yrLatest (2025): $4,201 · +0.6% YoY. Source: county tax records.
Cash-flow waterfall
monthlySold comps — $/sqft
last 12 mo · ≤1 miLoading sold comps…