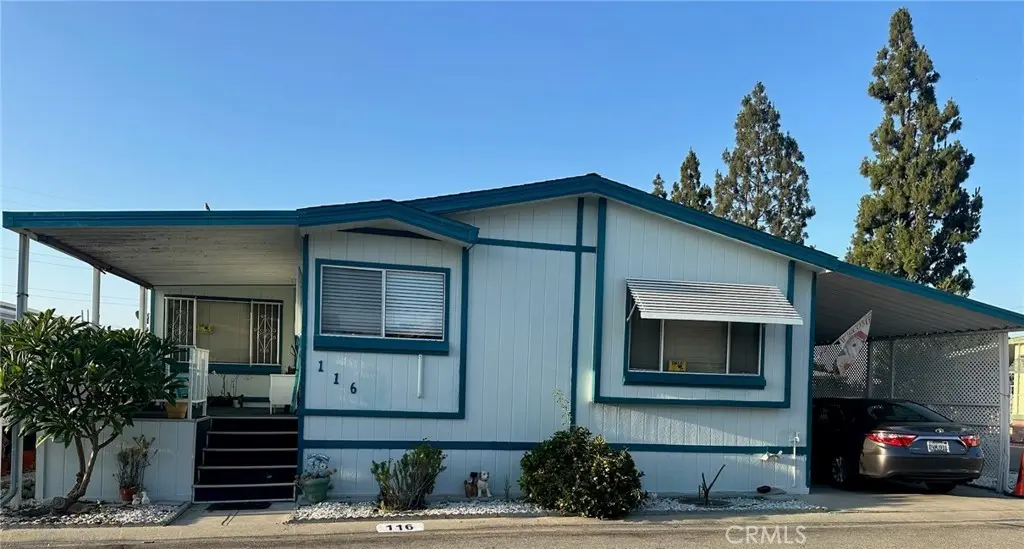
8509 Beverly #116 · Pico Rivera, CA
Flood risk 5/10 · Moderate
- FEMA flood zone
- X
- Chance of flooding over 30 yrs
- 0.27%
- Est. flood insurance / yr
- $507 – $1,088
Fire risk 1/10 · Minimal
- Est. fire insurance / yr
- $659 – $1,223
Heat risk 6/10 · Moderate
- Hot days now (above 96°F)
- 7 days/yr
- Hot days in 30 yrs
- 21 days/yr
Wind risk 1/10 · Minimal
- Chance of severe wind over 30 yrs
- —
Air-quality risk 6/10 · Moderate
- Unhealthy air days now
- 9 days/yr
- Unhealthy air days in 30 yrs
- 10 days/yr
Risk factors via First Street. Map © Google.
Why this score? — see what drove the C+ grade
The composite is a weighted blend of 9 inputs, each scored 0–100. Each bar is that input's sub-score; the figure is the points it added to the 100-point composite (weight × sub-score).
- Cash flow +28.0/30.0
- DSCR +10.0/10.0
- 1% rule +6.4/10.0
- Schools +3.9/10.0
- ARV discount +3.5/15.0
- Rent growth +3.5/5.0
- Livability +3.1/5.0
- Condition / age +2.5/5.0
- Appreciation +0.0/10.0
$290,000
🖨 Deal sheet 📄 Offer letter ✓ Due diligence
Listing remarks MLS
Very neat and clean unit - Nice senior park - Utility room- office can be 3rd bedroom - Extra large bedrooms and closets- Square footage per builder - Buyer to verify- 2 nice storage units.
Key facts
- Storage units
- Huge kitchen
- Formal living room
Tags
Property features AI
Finance
- Financial info: Land lease of $1,000 (land lease applies)
- HOA & community: Part of an association; Senior community; Manager approval required; Community features include biking, nearby park, sidewalks, street lighting, foothills/mountainous setting, close to clubhouse
Exterior
- Parking: 2 covered carport spaces (attached); 2 garage spaces; Total of 4 parking spaces
- Security: Gated community; Smoke and carbon monoxide detectors
- Utilities: Electricity available on property; Water connected (District/Public); Sewer connected / sewer paid; Cable available
- Home design: Single-story home; Entry on main level; Turnkey condition; Has a view; Mobile/manufactured model 568C3 (mobile home remains)
- Construction: Glass and drywall construction
- Exterior features: Front porch, additional porch and patio; Lighting; Community pool (fenced) managed by association
Interior
- Kitchen: Convection oven; Refrigerator; Water heater unit
- Bedrooms: Primary bedroom; Main floor primary bedroom; All bedrooms on one level; Primary suite; Additional bedrooms indicated (multiple flexible rooms listed such as office, bonus room, media room, etc.)
- Flooring: Tile; Vinyl; Carpet; Wood
- Bathrooms: 2 full bathrooms; Bathrooms include bathtub, shower, and vanity area
- Heating & cooling: Forced air heating; Central cooling
- Interior features: Beamed ceilings; Built-ins; High (9+ ft) ceilings; Cathedral/vaulted ceilings; Ceiling fan; Pantry; Storage space; Gated community; Smoke and carbon monoxide detectors
- Laundry & utility: Separate laundry room
Neighborhood map
What this means for you Summary
Snapshot
- This is a 2-bed/2.0-bath manufactured listed at $290k.
Deal economics
- At list price, monthly cash flow is $905 ($11k/yr) — positive.
- The deal already cash-flows at list — no discount required.
- Meets the 1% rule at list price ($3k rent vs $290k).
- Cap rate 10.0% vs local median 2.7% in Pico Rivera — top-decile yield for the area; either an underpriced asset or a hidden risk that comps aren't pricing in. Stress-test before assuming the spread holds.
Location & tenants
- Location reads 61/100 on livability (#511 in CA) — a middle-class / working-renter tenant base. Strengths: commute A+, employment A; Watch: schools D+, crime D-, amenities D-.
- El Rancho Unified (suburban): math 32% / reading 57% proficiency, ranked #185 of 517 in CA (top 36%) — families likely to look elsewhere, expect single-tenant / working-renter base with shorter leases; 63% free/reduced lunch — lower-income household profile, screen leases tightly.
- Market conditions: Rents rising fast (+4.1%/yr); 68 active listings in the ZIP; 14 comparable units currently listed for rent nearby; rentals leasing fast (median 6d on market — plan ~1-2 weeks tenant-placement turnaround); solid renter incomes; 19,697 units permitted in Los Angeles County in 2024 (9,426 in 5+ unit buildings).
- At $3,308/mo this rent would consume 45% of the median local household income ($88k/yr) (locally 1257% of renters already pay >50% of income on rent) — very limited rent-growth headroom before tenants either downsize or default.
Forward outlook
- Local home prices are declining (-3.0%/yr); year-one equity from $2k of loan paydown is wiped out by about $9k of value loss. Plan a longer hold.
- Los Angeles County population projected at +9% by 2050 — modest demand growth; plan on rents tracking national, not racing it.
- At projected returns (-3.0% appreciation + 4.1% rent growth), your $81k cash investment doubles in ~8 years — after that, you're playing with house money.
Negotiation context
- Only 13 days on market — expect competitive offers; lowballing is unlikely to land.
- 2 sale attempts since 12y ago with the ask held roughly flat each time — persistent listings suggest the price (not the market) is what's stuck; bring a comps-based counter.
- Current owner paid $85k; list at $290k implies a 241% gain — meaningful room to come down on a strong offer.
Risks & watch-outs
- Climate carrying-cost: moderate flood risk; extreme-heat days projected 7→21/yr by 2055 (HVAC capex compounding) — expect insurance premiums to compound above CPI over the hold.
Questions for the listing agent
- Is there a deadline driving the sale (1031 exchange, divorce, estate, relocation)? That informs how much negotiation room exists.
- Schools are D-rated, which usually means shorter tenancies and higher turnover. Who's the typical renter profile here, and what's been the actual vacancy rate?
- Crime grade is D in this area — have there been break-ins, vandalism, or insurance claims at this property in the last 3 years? What carrier currently insures it and at what premium?
- What's the average days-on-market for RENTAL listings here right now (not sales)? A rising rental-DOM trend means longer vacancies and softer asking-rent achievability than the comps imply.
- What's the recent tenant-quality profile in this submarket — average credit score on applications, eviction rate, late-payment / NSF rate, and stable-employment percentage? A property-management company in the area should have these aggregated.
- How much new for-sale + rental construction is in the pipeline within 1–3 miles? Heavy new supply typically softens prices + rents 12–24 months out; constrained supply supports both.
Investment metrics
- 1% rule
- 1.14% ✓
- Cap rate
- 10.04%
- Cash-on-cash
- 13.37%
- DSCR
- 1.60
- GRM
- 7.3
CMA / ARV
- ARV (on-the-fly)
- $266,328
- Comps found
- 3
Show comp detail 3 sales within ~0.75 mi
| Address | Dist | Beds/Ba | Sqft | Sold | Price | $/sf | Match |
|---|---|---|---|---|---|---|---|
| 8509 Beverly Blvd #74 | 0.02mi | 2/2.0 | 1,508 (-8%) | 2mo | $245,000 | $162 | 84 |
| 8509 Beverly Blvd | 0.12mi | 3/2.0 (+1) | 1,728 (+5%) | 5mo | $235,000 | $136 | 76 |
| 8509 Beverly #65 | 0.00mi | 2/2.0 | 1,440 (-12%) | 9mo | $245,000 | $170 | 72 |
Match score weights: distance 35% · size 25% · config 20% · recency 20%. Top-matched comps best support the ARV.
Projected returns pro-forma
-3.0% appreciation · 4.13% rent growth · sell at horizon
- IRR
- 4.5%
- Equity multiple
- 1.18×
- Total profit
- $14,317
- Equity at exit
- $43,240
- IRR
- 14.9%
- Equity multiple
- 2.26×
- Total profit
- $102,119
- Equity at exit
- $25,074
Cash invested: $81,200 (down + closing). Projections, not guarantees.
Landlord ↔ Tenant lean methodology
- Overall (STATE)
- 18 Strongly Tenant-Friendly
- State California
- 18 Strongly Tenant-Friendly · D+13
- County
- — inherits STATE
- City
- — inherits STATE
ZIP-level market 90660
- Rents YoY
- 4.1%
- Active inventory
- 68
- Price-to-rent
- 7.3×
Monthly cashflow live
- Estimated rent
- $3,308 high interval (Pro) →
- Mortgage (P&I)
- −$1,521
- Tax from tax record
- −$66 /mo · $797/yr
- Insurance
- −$121
- HOA
- −$0
- Vacancy / Maint / Mgmt
- −$695
- Net cashflow
- $905
Break-even live
UW: 25.0% down · 7.5% · 30yr · 1.5% tax · 5.0% vac · 8.0% maint · 8.0% mgmt
Financing live
Cash to close
- Down payment
- $72,500
- Closing costs
- $8,700
- Reserves months
- —
- Total cash needed
- —
Loan-product check · same deal, 3 products live
Conventional
25% down · 7.5% · 30yr
- Down + closing
- —
- Monthly P&I
- —
- Monthly cashflow
- —
- DSCR
- —
- Eligible?
- —
Personal DTI + credit; lowest rate.
DSCR
20% down · 8.5% · 30yr
- Down + closing
- —
- Monthly P&I
- —
- Monthly cashflow
- —
- DSCR
- —
- Eligible?
- —
No personal income docs; deal must DSCR.
Hard money
10% down · 12.0% · 12mo
- Down + closing
- —
- Monthly P&I
- —
- Monthly cashflow
- —
- DSCR
- —
- Eligible?
- —
Short-term bridge; refi at stabilization.
Rent comps 14 comps
| Address | Beds | Baths | Sqft | Rent | $/sqft | DOM | Units | Dist |
|---|---|---|---|---|---|---|---|---|
| 8813 Gallatin Rd #102 Pico Rivera, CA | 3.0 | 3.5 | 1495 | $3,600 | $2.41 | 43d | 1 | 0.36mi |
| 8813 Gallatin Rd #101 Pico Rivera, CA | 3.0 | 3.5 | 1578 | $3,700 | $2.34 | 43d | 1 | 0.36mi |
| 260 E Beverly Blvd Unit C Montebello, CA | 3.0 | 2.5 | 1289 | $3,595 | $2.79 | 43d | 1 | 0.43mi |
| 8812 Beverly Rd Pico Rivera, CA | 3.0 | 2.0 | 1464 | $4,700 | $3.21 | 6d | 1 | 0.45mi |
| 8936 Gallatin Rd Pico Rivera, CA | 3.0 | 2.0 | 1258 | $3,325 | $2.64 | 43d | 1 | 0.48mi |
| 637 Wilber Pl Montebello, CA | 3.0 | 1.0 | 1087 | $3,350 | $3.08 | 24d | 1 | 0.54mi |
| 8939 Gallatin Rd #123 Pico Rivera, CA | 3.0 | 2.0 | 1330 | $3,200 | $2.41 | 6d | 1 | 0.55mi |
| 140 E Whittier Blvd Montebello, CA | 3.0–4.0 | 2.5–4.0 | 1742 | $3,960 | $2.27 | 1d | 6 | 0.69mi |
| 428 N 6th St Montebello, CA | 3.0 | 1.0 | 1108 | $3,200 | $2.89 | 7d | 1 | 0.92mi |
| 205 S 7th St Montebello, CA | 3.0 | 2.0 | 1517 | $3,300 | $2.18 | 1d | 1 | 1.23mi |
| 608 N Taylor Ave Montebello, CA | 2.0 | 2.0 | 1200 | $2,400 | $2.00 | 1d | 1 | 1.37mi |
| 1221 W Lincoln Ave Montebello, CA | 2.0 | 2.0 | 1300 | $2,750 | $2.12 | 4d | 1 | 1.38mi |
| 1301 W Lincoln Ave Montebello, CA | 3.0 | 2.0 | 1600 | $3,500 | $2.19 | 1d | 1 | 1.42mi |
| 891 W Ashiya Rd Unit 1 Montebello, CA | 3.0 | 3.0 | 1589 | $2,500 | $1.57 | 1d | 1 | 1.44mi |
Listing history 10 events
-
2026-06-18days on market $290,000 Active 13 DOM
-
2026-06-17days on market $290,000 Active 12 DOM
-
2026-06-16days on market $290,000 Active 11 DOM
-
2026-06-15days on market $290,000 Active 10 DOM
-
2026-06-13days on market $290,000 Active 8 DOM
-
2026-06-13days on market $290,000 Active 7 DOM
-
2026-06-09days on market $290,000 Active 4 DOM
-
2026-06-08days on market $290,000 Active 3 DOM
-
2026-06-07remarks 699-char remark
-
2026-06-07$290,000 Active 2 DOM
ⓘ Source: listings_history table (triggers on properties + properties_extension) + one-shot
backfill from property_details.listing_events for pre-trigger history.
Tax reassessment forecast CA · Resets to sale price
- Current annual tax
- $797 · $66/mo
- Projected year-2 tax
- $2,204 · $184/mo
- Expected delta
- +$1,407/yr (+$117/mo · 176.5%)
ⓘ Screening estimate from a state-policy table — verify with the county assessor before closing.
Climate risk First Street
- Flood 5/10 Major FEMA zone X · 27% chance over 30 yrs
- Wildfire 1/10 Low
- Heat 6/10 Major 7 d/yr ≥96°F today · 21 d/yr by 30 yrs out
- Wind 1/10 Low
- Air quality 6/10 Major 9 unhealthy d/yr today · 10 by 30 yrs out
Nearby sold comps map
Loading sold comps map…
Walkable amenities ~0.75 mi
Loading nearby amenities…
Taxation est. · year 1
- Rental income
- $39,692
- − Mortgage interest
- −$16,245
- − Property taxes
- −$797
- − Insurance
- −$1,450
- − Repairs & maintenance
- −$3,175
- − Management
- −$3,175
- − Depreciation
- −$8,436
- Taxable income
- $6,413
- Est. tax owed @ 24.0%
- −$1,539
- After-tax cash flow
- $9,321/yr
For passive investors: Depreciation is non-cash, so a rental often shows a tax loss while cash-flowing — sheltering income. Rental losses are passive: they offset passive income freely, and up to $25,000/yr can offset ordinary (W-2) income if you actively participate and your MAGI is under $100k (phasing out to $0 by $150k); unused losses carry forward. On sale, claimed depreciation is recaptured at up to 25%, and gains may owe capital-gains tax (a 1031 exchange can defer both). Figures are a year-1 estimate at your 24.0% rate — not tax advice; consult a CPA.
Schools (NCES district)
- District
- El Rancho Unified
- NCES district ID
- 0612180
- Math proficiency
- 32% ▲ 3.00%
- Reading proficiency
- 57% ▲ 14.00%
- Median HH income
- $58,233
- Composite
- 38.91/100
- National rank
- #4093
- State rank
- #185 of 517 in CA
Livability — Pico Rivera
- Score
- 61/100
- State rank
- #511
- US rank
- #17324
Category grades
Schools grade is shown separately in the Schools card above.
Census & demographics
- Census place
- Pico Rivera, CA
- County
- Los Angeles County · 9,444,647 people
- City population
- 60,272
- Metro
- Los Angeles-Long Beach-Anaheim, CA
- Population (ZIP)
- 60,272
- Household income
- $88,201
- Rent vs Own
- Severe rent burden
- 1257.0
Population outlook (Los Angeles County) Hauer SSP2
- Today (2025)
- 10,940,515 people
- By 2030
- 11,256,481 · +2.9%
- By 2040
- 11,729,929 · +7.2%
- By 2050
- 11,948,407 · +9.2%
- By 2075
- 11,818,114 · +8.0%
- By 2100
- 10,842,928 · -0.9%
Race, ethnicity, and origin ACS 2023
- Neighborhood character
- Predominantly Hispanic (91%)
- Race & ethnicity
- Hispanic / Latino 91% Two or more races 21% White 4% Asian 3% Native American 3% Black 2%
- Hispanic origin (detail)
- Mexican 78%
- Foreign-born
- 30% · Canada, Vietnam, China
- Languages at home
- 34% English-only · Spanish 63% Tagalog/Filipino 1% Vietnamese 1%
Political lean MEDSL · Los Angeles
- 2024 margin
- Solid D (+32.9) · D 64.8% · R 31.9% · Other 3.3%
- 2008→2024 swing
- -7.4pp toward R · 2008: 40.4pp · 2024: 32.9pp
- All cycles
- 2024: D+32.9 2020: D+44.2 2016: D+48.0 2012: D+40.0 2008: D+40.4
Not yet ingested
- Civics
- —
Market trends
- HPI YoY
- ▼ -898.63%
- Current HPI
- 437.4769
- Rent YoY
- ▲ 4.13%
- Metro
- Los Angeles-Long Beach-Anaheim, CA
- State GDP YoY
- ▲ 3.21%
- F500 in state
- 116
Industry mix (Fortune 500 HQ in CA)
| Industry | F500 HQs | Revenue |
|---|---|---|
| Technology | 27 | $1,492B |
|
||
| Financial Services | 3 | $174B |
|
||
| Retail | 3 | $44B |
|
||
| Insurance | 3 | $26B |
|
||
| Media / Entertainment | 2 | $115B |
|
||
| Pharmaceuticals / Biotech | 2 | $62B |
|
||
Price history
+190.3% since first listed4 events — show timeline
- 2026-06-05 Listed $290,000 CRMLS
- 2015-02-25 Sold (MLS) $85,000 CRMLS
- 2015-02-06 Contingent — CRMLS
- 2014-12-05 Listed $99,900 CRMLS
Property tax history
+5.4%/yrLatest (2025): $797 · +5.4% YoY. Source: county tax records.
Cash-flow waterfall
monthlySold comps — $/sqft
last 12 mo · ≤1 miLoading sold comps…