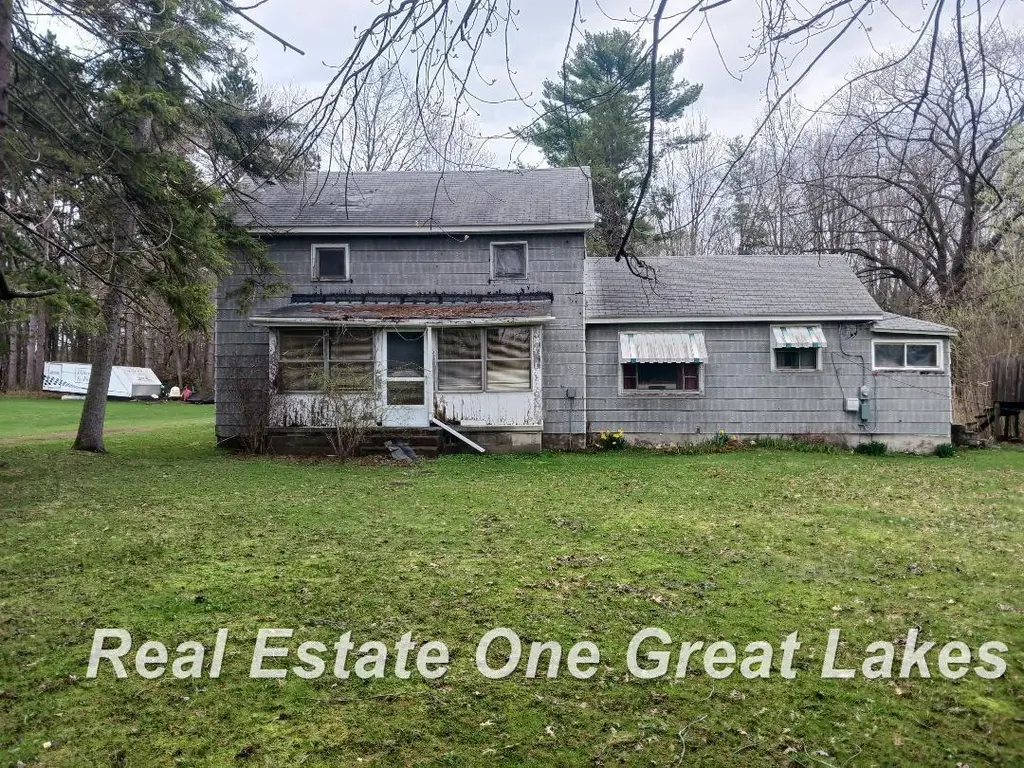
309 E North St · St. Charles, MI
Flood risk 1/10 · Minimal
- FEMA flood zone
- X (shaded)
- Chance of flooding over 30 yrs
- 0.0%
- Est. flood insurance / yr
- $507 – $1,088
Fire risk 1/10 · Minimal
- Est. fire insurance / yr
- $784 – $1,456
Heat risk 2/10 · Minimal
- Hot days now (above 98°F)
- 7 days/yr
- Hot days in 30 yrs
- 14 days/yr
Wind risk 1/10 · Minimal
- Chance of severe wind over 30 yrs
- —
Air-quality risk 2/10 · Minimal
- Unhealthy air days now
- 1 days/yr
- Unhealthy air days in 30 yrs
- 2 days/yr
Risk factors via First Street. Map © Google.
Why this score? — see what drove the B- grade
The composite is a weighted blend of 9 inputs, each scored 0–100. Each bar is that input's sub-score; the figure is the points it added to the 100-point composite (weight × sub-score).
- Cash flow +30.0/30.0
- 1% rule +10.0/10.0
- DSCR +10.0/10.0
- ARV discount +7.5/15.0
- Schools +3.5/10.0
- Rent growth +2.5/5.0
- Livability +2.5/5.0
- Condition / age +2.5/5.0
- Appreciation +0.0/10.0
$62,900
🖨 Deal sheet (PDF) 📄 Offer letter ✓ Due diligence
Listing remarks MLS
Rare opportunity to own nearly 2 acres in the village of ST Charles! This 1925-built home offers 1,773 square feet of character and space, featuring 3 bedrooms and 1 full bathroom. Bring your tools and vision to transform this classic residence into your dream home. The 1.85 irregular lot provides ample room for gardening, recreation, or future expansions. The 2-car detached garage is ready for a full overhaul and serves as the perfect project for a hobbyist or mechanic. Property is sold as-is--perfect for those looking to build sweat equity in a competitive market! Call for your private showing today.
Key facts
- 1925 built home
- Nearly 2 acres
- Irregular lot
Tags
Neighborhood map
What this means for you Summary
Snapshot
- This is a 3-bed/1.0-bath single-family listed at $63k.
Deal economics
- At list price, monthly cash flow is $348 ($4k/yr) — positive.
- The deal already cash-flows at list — no discount required.
- Meets the 1% rule at list price ($1k rent vs $63k).
- Recommended offer: $59k (6.0% below list) — sets the bar for market timing.
Location & tenants
- Location reads: area grade B — affects rentability + tenant quality, not the cash-flow math above.
- St. Charles Community Schools (rural): math 35% / reading 47% proficiency, ranked #196 of 540 in MI (top 36%) — families likely to look elsewhere, expect single-tenant / working-renter base with shorter leases.
- Zoned schools: St Charles Elementary School (math 47% / reading 47%, grade D-, #433 of 1,397 statewide, top 34%, 376 students, 58% FRL); St Charles Community Middlehigh School (math 32% / reading 57%, grade F, #214 of 713 statewide, top 36%, 326 students, 44% FRL).
- Market conditions: 32 active listings in the ZIP; 154 units permitted in Saginaw County in 2024 (0 in 5+ unit buildings).
Forward outlook
- Local home prices are declining (-3.0%/yr); year-one equity from $435 of loan paydown is wiped out by about $2k of value loss. Plan a longer hold.
- Saginaw County population projected at -25% by 2050 — secular population decline; favor cash flow + early exit over multi-decade hold.
- At projected returns (-3.0% appreciation + 3.0% rent growth), your $18k cash investment doubles in ~6 years — after that, you're playing with house money.
Negotiation context
- It's been on market 65 days — a 6% lower offer ($59k) is reasonable based on typical stale-listing flexibility.
- 2 sale attempts with the ask held roughly flat each time — persistent listings suggest the price (not the market) is what's stuck; bring a comps-based counter.
Risks & watch-outs
- Watch-outs: built in 1925 — expect roof / HVAC / electrical / plumbing capex.
Questions for the listing agent
- It's been on market 65 days. Have you received any prior offers? Is the seller open to a 6% concession, seller financing, or rate buy-down credit?
- Built in 1925 — when were the roof, HVAC, electrical panel, plumbing, and water heater last replaced?
- Why hasn't it sold? Are there any deal-killer items the seller is aware of (foundation, flood, title, zoning, code violations)?
- Is there a deadline driving the sale (1031 exchange, divorce, estate, relocation)? That informs how much negotiation room exists.
- What's the average days-on-market for RENTAL listings here right now (not sales)? A rising rental-DOM trend means longer vacancies and softer asking-rent achievability than the comps imply.
- What's the recent tenant-quality profile in this submarket — average credit score on applications, eviction rate, late-payment / NSF rate, and stable-employment percentage? A property-management company in the area should have these aggregated.
- How much new for-sale + rental construction is in the pipeline within 1–3 miles? Heavy new supply typically softens prices + rents 12–24 months out; constrained supply supports both.
Investment metrics
- 1% rule
- 1.62% ✓
- Cap rate
- 12.92%
- Cash-on-cash
- 23.68%
- DSCR
- 2.05
- GRM
- 5.1
CMA / ARV
- ARV (median comp)
- $182,013
- List price
- $62,900
- Delta
- -65.44%
- Verdict
- UNDERPRICED
- Comps
- 20 within 1.0 mi
Show comp detail 6 sales within ~0.75 mi
| Address | Dist | Beds/Ba | Sqft | Sold | Price | $/sf | Match |
|---|---|---|---|---|---|---|---|
| 105 W Maple St | 0.31mi | 3/2.0 | 1,776 (+0%) | 24mo | $148,000 | $83 | 61 |
| 419 W Walnut St | 0.46mi | 3/2.0 | 1,636 (-8%) | 3mo | $185,000 | $113 | 60 |
| 410 W Maple St | 0.47mi | 4/2.5 (+1) | 1,886 (+6%) | 2mo | $289,900 | $154 | 55 |
| 1075 N Main St | 0.10mi | 3/1.0 | 1,533 (-14%) | 23mo | $185,000 | $121 | 54 |
| 134 Sunview Dr | 0.37mi | 3/1.5 | 1,948 (+10%) | 18mo | $210,000 | $108 | 49 |
| 126 E Maple St | 0.27mi | 3/2.0 | 1,512 (-15%) | 15mo | $150,000 | $99 | 46 |
Match score weights: distance 35% · size 25% · config 20% · recency 20%. Top-matched comps best support the ARV.
Projected returns pro-forma
-3.0% appreciation · 3.0% rent growth · sell at horizon
- IRR
- 16.9%
- Equity multiple
- 1.68×
- Total profit
- $11,973
- Equity at exit
- $9,379
- IRR
- 25.4%
- Equity multiple
- 3.22×
- Total profit
- $39,051
- Equity at exit
- $5,438
Cash invested: $17,612 (down + closing). Projections, not guarantees.
Landlord ↔ Tenant lean methodology
- Overall (STATE)
- 62 Landlord-Friendly
- State Michigan
- 62 Landlord-Friendly · EVEN
- County
- — inherits STATE
- City
- — inherits STATE
ZIP-level market 48655
- Active inventory
- 32
- Price-to-rent
- 5.1×
Monthly cashflow live
- Estimated rent
- $1,020 medium interval (Pro) →
- Mortgage (P&I)
- −$330
- Tax from tax record
- −$102 /mo · $1,228/yr
- Insurance
- −$26
- HOA
- −$0
- Vacancy / Maint / Mgmt
- −$214
- Net cashflow
- $348
Break-even live
Sensitivity live
| Price | -10% $383 | -5% $365 | +0% $348 | +5% $330 | +10% $312 |
|---|---|---|---|---|---|
| Rent | -10% $267 | -5% $307 | +0% $348 | +5% $388 | +10% $428 |
| Rate | -1.0pp $379 | -0.5pp $364 | base $348 | +0.5pp $331 | +1.0pp $315 |
UW: 25.0% down · 7.5% · 30yr · 1.5% tax · 5.0% vac · 8.0% maint · 8.0% mgmt
Financing live
Cash to close
- Down payment
- $15,725
- Closing costs
- $1,887
- Reserves months
- —
- Total cash needed
- —
Loan-product check · same deal, 3 products live
Conventional
25% down · 7.5% · 30yr
- Down + closing
- —
- Monthly P&I
- —
- Monthly cashflow
- —
- DSCR
- —
- Eligible?
- —
Personal DTI + credit; lowest rate.
DSCR
20% down · 8.5% · 30yr
- Down + closing
- —
- Monthly P&I
- —
- Monthly cashflow
- —
- DSCR
- —
- Eligible?
- —
No personal income docs; deal must DSCR.
Hard money
10% down · 12.0% · 12mo
- Down + closing
- —
- Monthly P&I
- —
- Monthly cashflow
- —
- DSCR
- —
- Eligible?
- —
Short-term bridge; refi at stabilization.
Listing history 19 events
-
2026-06-21days on market $62,900 Active 65 DOM
-
2026-06-21days on market $62,900 Active 64 DOM
-
2026-06-18days on market $62,900 Active 62 DOM
-
2026-06-17days on market $62,900 Active 61 DOM
-
2026-06-16days on market $62,900 Active 60 DOM
-
2026-06-15days on market $62,900 Active 59 DOM
-
2026-06-13days on market $62,900 Active 57 DOM
-
2026-06-12days on market $62,900 Active 56 DOM
-
2026-06-09days on market $62,900 Active 53 DOM
-
2026-06-08days on market $62,900 Active 52 DOM
-
2026-06-07days on market $62,900 Active 51 DOM
-
2026-06-07days on market $62,900 Active 50 DOM
-
2026-06-04days on market $62,900 Active 47 DOM
-
2026-06-02days on market $62,900 Active 46 DOM
-
2026-06-01days on market $62,900 Active 45 DOM
-
2026-05-31days on market $62,900 Active 44 DOM
-
2026-05-31days on market $62,900 Active 43 DOM
-
2026-04-17$62,900 Active 609-char remark
Show marketing remark (609 chars)
Rare opportunity to own nearly 2 acres in the village of ST Charles! This 1925-built home offers 1,773 square feet of character and space, featuring 3 bedrooms and 1 full bathroom. Bring your tools and vision to transform this classic residence into your dream home. The 1.85 irregular lot provides ample room for gardening, recreation, or future expansions. The 2-car detached garage is ready for a full overhaul and serves as the perfect project for a hobbyist or mechanic. Property is sold as-is--perfect for those looking to build sweat equity in a competitive market! Call for your private showing today.
ⓘ Source: listings_history table (triggers on properties + properties_extension) + one-shot
backfill from property_details.listing_events for pre-trigger history.
Tax reassessment forecast MI · Partial reset (capped growth)
- Current annual tax
- $1,228 · $102/mo
- Projected year-2 tax
- $1,228 · $102/mo
- Expected delta
- $0/yr ($0/mo · 0.0%)
ⓘ Screening estimate from a state-policy table — verify with the county assessor before closing.
Climate risk First Street
- Flood 1/10 Low FEMA zone X (shaded) · 0% chance over 30 yrs
- Wildfire 1/10 Low
- Heat 2/10 Low 7 d/yr ≥98°F today · 14 d/yr by 30 yrs out
- Wind 1/10 Low
- Air quality 2/10 Low 1 unhealthy d/yr today · 2 by 30 yrs out
Nearby sold comps map
Loading sold comps map…
Walkable amenities ~0.75 mi
Loading nearby amenities…
Taxation est. · year 1
- Rental income
- $12,243
- − Mortgage interest
- −$3,523
- − Property taxes
- −$1,228
- − Insurance
- −$314
- − Repairs & maintenance
- −$979
- − Management
- −$979
- − Depreciation
- −$1,830
- Taxable income
- $3,388
- Est. tax owed @ 24.0%
- −$813
- After-tax cash flow
- $3,358/yr
For passive investors: Depreciation is non-cash, so a rental often shows a tax loss while cash-flowing — sheltering income. Rental losses are passive: they offset passive income freely, and up to $25,000/yr can offset ordinary (W-2) income if you actively participate and your MAGI is under $100k (phasing out to $0 by $150k); unused losses carry forward. On sale, claimed depreciation is recaptured at up to 25%, and gains may owe capital-gains tax (a 1031 exchange can defer both). Figures are a year-1 estimate at your 24.0% rate — not tax advice; consult a CPA.
Schools (NCES district)
- District
- St. Charles Community Schools
- NCES district ID
- 2632640
- Math proficiency
- 35% ▼ -3.00%
- Reading proficiency
- 47% ▼ -6.00%
- Median HH income
- $49,744
- Composite
- 35.25/100
- National rank
- #4976
- State rank
- #196 of 540 in MI
Livability — St. Charles
No livability data for this city. (Only ~50 U.S. cities are tracked.)
Census & demographics
- Census place
- St. Charles, MI
- City population
- 5,655
- Population (ZIP)
- 5,655
Population outlook (Saginaw County) Hauer SSP2
- Today (2025)
- 180,568 people
- By 2030
- 172,302 · -4.6%
- By 2040
- 153,919 · -14.8%
- By 2050
- 135,519 · -24.9%
- By 2075
- 97,199 · -46.2%
- By 2100
- 65,037 · -64.0%
Race, ethnicity, and origin ACS 2023
- Neighborhood character
- Predominantly White (88%)
- Race & ethnicity
- White 88% Hispanic / Latino 7% Two or more races 4% Black 3%
- Hispanic origin (detail)
- Mexican 4% Puerto Rican 1%
- Common ancestry
- Romanian 9% Lithuanian 6% Iranian 1%
- Foreign-born
- 0%
Political lean MEDSL · Saginaw
- 2024 margin
- Toss-up / Even · D 47.7% · R 51.0% · Other 1.4%
- 2008→2024 swing
- -20.6pp toward R · 2008: 17.3pp · 2024: -3.3pp
- All cycles
- 2024: R+3.3 2020: D+0.3 2016: R+1.1 2012: D+11.9 2008: D+17.3
Not yet ingested
- Civics
- —
Market trends
- HPI YoY
- ▼ -138.51%
- Current HPI
- 221.6423
- Rent YoY
- —
- Metro
- —
- State GDP YoY
- ▲ 1.37%
- F500 in state
- 28
Industry mix (Fortune 500 HQ in MI)
| Industry | F500 HQs | Revenue |
|---|---|---|
| Automotive Parts | 3 | $48B |
|
||
| Automotive | 2 | $372B |
|
||
| Chemicals | 1 | $45B |
|
||
| Automotive Retail | 1 | $29B |
|
||
| Healthcare / Medical Devices | 1 | $23B |
|
||
| Automotive Technology | 1 | $20B |
|
||
Price history
+0.0% since first listed2 events — show timeline
- 2026-04-17 Listed $62,900 REALCOMP
- 2026-04-17 Listed $62,900 MiRealSource-MiMLS
Property tax history
-0.4%/yrLatest (2025): $1,228 · -40.7% YoY. Source: county tax records.
Cash-flow waterfall
monthlySold comps — $/sqft
last 12 mo · ≤1 miLoading sold comps…