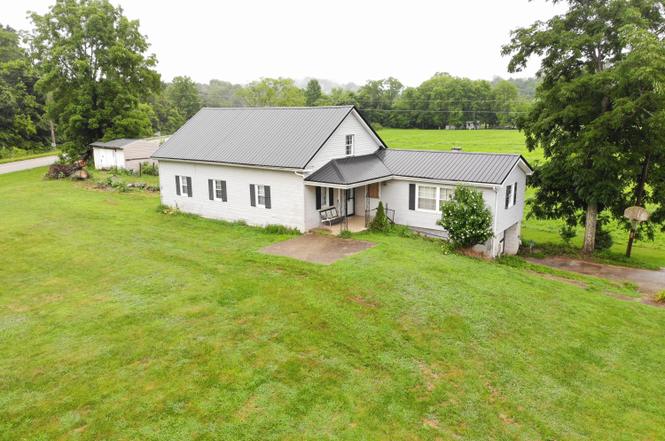
63 Augusta Dr · Mount Olivet, KY
Flood risk 9/10 · Severe
- FEMA flood zone
- A
- Chance of flooding over 30 yrs
- 0.99%
- Est. flood insurance / yr
- $1,009 – $1,996
Fire risk 3/10 · Minor
- Est. fire insurance / yr
- $839 – $1,559
Heat risk 4/10 · Minor
- Hot days now (above 102°F)
- 7 days/yr
- Hot days in 30 yrs
- 20 days/yr
Wind risk 2/10 · Minimal
- Chance of severe wind over 30 yrs
- 1.0%
Air-quality risk 2/10 · Minimal
- Unhealthy air days now
- 1 days/yr
- Unhealthy air days in 30 yrs
- 2 days/yr
Risk factors via First Street. Map © Google.
Why this score? — see what drove the B- grade
The composite is a weighted blend of 9 inputs, each scored 0–100. Each bar is that input's sub-score; the figure is the points it added to the 100-point composite (weight × sub-score).
- Cash flow +24.8/30.0
- Appreciation +10.0/10.0
- DSCR +8.0/10.0
- ARV discount +7.5/15.0
- 1% rule +5.5/10.0
- Livability +2.6/5.0
- Rent growth +2.5/5.0
- Condition / age +2.5/5.0
- Schools +2.2/10.0
$154,900
🖨 Deal sheet 📄 Offer letter ✓ Due diligence
Listing remarks
Looking for a smart investment or a place to call your first home? This 4-bedroom, 1-bathroom gem offers a great opportunity to add value with a little polish and personal touch! Situated on a nice-sized corner lot with dual road access, this home already has two major updates completed for you: New metal roof installed just last month Newer heat pump added last year for year-round comfort there is a back up heat source a pellet stove. Inside, you'll find a functional layout with space to update and customize to your liking. The yard offers plenty of room for outdoor living, pets, or gardening — and being on a corner lot gives you extra privacy and flexibility. Whether you're look
Key facts
- New metal roof
- Pellet stove
- Dual road access
Tags
Property features AI
Exterior
- Parking: Driveway; Off-street parking; Garage faces front; Has garage
- Utilities: Public water connected; Septic tank; Electricity connected; Natural gas not available
- Home design: House; Two levels
- Construction: Vinyl siding; Block foundation; Metal roof; Built with conventional residential construction
- Exterior features: Shed(s); Rural, trees/woods view
Interior
- Kitchen: Dishwasher; Microwave; Refrigerator; Breakfast bar / eat-in kitchen
- Bedrooms: Total rooms: 6
- Flooring: Carpet; Hardwood; Laminate
- Bathrooms: 1 full bathroom
- Heating & cooling: Electric heating; Heat pump; Attic fan
- Interior features: Breakfast bar; Eat-in kitchen; Primary bedroom on the first floor; Ceiling fan(s); Insulated windows with blinds and screens
- Laundry & utility: Washer hookup; Electric dryer hookup
Neighborhood map
What this means for you Summary
Snapshot
- This is a 3-bed/1.0-bath single-family listed at $155k.
Deal economics
- At list price, monthly cash flow is $203 ($2k/yr) — positive.
- The deal already cash-flows at list — no discount required.
- Meets the 1% rule at list price ($2k rent vs $155k).
- Recommended offer: $136k (12.0% below list) — sets the bar for market timing.
Location & tenants
- Location reads 52/100 on livability (#491 in KY) — a working-class tenant base; expect higher turnover. Strengths: cost of living A+; Watch: amenities F, commute F, employment F.
- Harrison County (town): math 21% / reading 32% proficiency, ranked #133 of 165 in KY (top 81%) — low school quality limits family demand, transient renter base, plan for 1-2y turnover.
- Zoned schools: Harrison County Middle School (math 19% / reading 35%, grade F, #172 of 217 statewide, top 80%, 607 students, 58% FRL); Harrison County High School (math 29% / reading 41%, grade F, #74 of 254 statewide, top 29%, 865 students, 46% FRL) — zoned schools at 52% FRL track the district average.
- Market conditions: 95 active listings in the ZIP; 69 units permitted in Harrison County in 2024 (0 in 5+ unit buildings).
Forward outlook
- In year one you build about $17k of equity ($1k loan paydown + $15k appreciation (10.0% local appreciation)).
- Harrison County population projected to shrink 10% by 2050 — rents likely to lag national; underwrite the cash flow, not the appreciation.
- At projected returns (10.0% appreciation + 3.0% rent growth), your $43k cash investment doubles in ~3 years — after that, you're playing with house money.
- By year 3, paydown + projected appreciation supports a ~$42k cash-out refi (75% LTV) — recoverable capital for the next deal without selling this one.
Negotiation context
- It's been on market 292 days — a 12% lower offer ($136k) is reasonable based on typical stale-listing flexibility.
- 7 sale attempts since 17y ago; this cycle's ask has dropped $14k (8%) from the opening price — seller is motivated, your offer sets the floor, not the list.
- Current owner paid $63k; list at $155k implies a 146% gain — meaningful room to come down on a strong offer.
Risks & watch-outs
- Watch-outs: flood insurance adds $125/mo; built in 1913 — expect roof / HVAC / electrical / plumbing capex.
- Climate carrying-cost: in FEMA flood zone A (mandatory federal flood insurance) — expect insurance premiums to compound above CPI over the hold.
Questions for the listing agent
- It's been on market 292 days. Have you received any prior offers? Is the seller open to a 12% concession, seller financing, or rate buy-down credit?
- Built in 1913 — when were the roof, HVAC, electrical panel, plumbing, and water heater last replaced?
- What's the actual annual flood-insurance premium (NFIP or private), and is the property in a SFHA with mandatory coverage?
- Why hasn't it sold? Are there any deal-killer items the seller is aware of (foundation, flood, title, zoning, code violations)?
- Is there a deadline driving the sale (1031 exchange, divorce, estate, relocation)? That informs how much negotiation room exists.
- Schools are D-rated, which usually means shorter tenancies and higher turnover. Who's the typical renter profile here, and what's been the actual vacancy rate?
- What's the average days-on-market for RENTAL listings here right now (not sales)? A rising rental-DOM trend means longer vacancies and softer asking-rent achievability than the comps imply.
- What's the recent tenant-quality profile in this submarket — average credit score on applications, eviction rate, late-payment / NSF rate, and stable-employment percentage? A property-management company in the area should have these aggregated.
- How much new for-sale + rental construction is in the pipeline within 1–3 miles? Heavy new supply typically softens prices + rents 12–24 months out; constrained supply supports both.
Investment metrics
- 1% rule
- 1.05% ✓
- Cap rate
- 8.83%
- Cash-on-cash
- 9.08%
- DSCR
- 1.40
- GRM
- 8.0
CMA / ARV
No comps found within radius.
Projected returns pro-forma
10.0% appreciation · 3.0% rent growth · sell at horizon
- IRR
- 28.4%
- Equity multiple
- 3.24×
- Total profit
- $97,315
- Equity at exit
- $139,546
- IRR
- 24.7%
- Equity multiple
- 7.37×
- Total profit
- $276,470
- Equity at exit
- $300,937
Cash invested: $43,372 (down + closing). Projections, not guarantees.
Landlord ↔ Tenant lean methodology
- Overall (STATE)
- 83 Strongly Landlord-Friendly
- State Kentucky
- 83 Strongly Landlord-Friendly · R+16
- County
- — inherits STATE
- City
- — inherits STATE
ZIP-level market 41031
- Home prices YoY
- 4.4%
- Active inventory
- 95
- Price-to-rent
- 8.0×
Monthly cashflow live
- Estimated rent
- $1,621 medium interval (Pro) →
- Mortgage (P&I)
- −$812
- Tax from tax record
- −$76 /mo · $906/yr
- Insurance
- −$65
- Flood insurance flood zone
- −$125 /mo · $1,502/yr
- HOA
- −$0
- Vacancy / Maint / Mgmt
- −$340
- Net cashflow
- $203
Break-even live
UW: 25.0% down · 7.5% · 30yr · 1.5% tax · 5.0% vac · 8.0% maint · 8.0% mgmt
Financing live
Cash to close
- Down payment
- $38,725
- Closing costs
- $4,647
- Reserves months
- —
- Total cash needed
- —
Loan-product check · same deal, 3 products live
Conventional
25% down · 7.5% · 30yr
- Down + closing
- —
- Monthly P&I
- —
- Monthly cashflow
- —
- DSCR
- —
- Eligible?
- —
Personal DTI + credit; lowest rate.
DSCR
20% down · 8.5% · 30yr
- Down + closing
- —
- Monthly P&I
- —
- Monthly cashflow
- —
- DSCR
- —
- Eligible?
- —
No personal income docs; deal must DSCR.
Hard money
10% down · 12.0% · 12mo
- Down + closing
- —
- Monthly P&I
- —
- Monthly cashflow
- —
- DSCR
- —
- Eligible?
- —
Short-term bridge; refi at stabilization.
Listing history 33 events
-
2026-06-18days on market $154,900 Active 292 DOM
-
2026-06-17days on market $154,900 Active 291 DOM
-
2026-06-16days on market $154,900 Active 290 DOM
-
2026-06-15days on market $154,900 Active 289 DOM
-
2026-06-14days on market $154,900 Active 287 DOM
-
2026-06-10days on market $154,900 Active 284 DOM
-
2026-06-09days on market $154,900 Active 283 DOM
-
2026-06-08days on market $154,900 Active 282 DOM
-
2026-06-07days on market $154,900 Active 281 DOM
-
2026-06-03days on market $154,900 Active 277 DOM
-
2026-06-02days on market $154,900 Active 276 DOM
-
2026-06-01days on market $154,900 Active 275 DOM
-
2026-05-31days on market $154,900 Active 274 DOM
-
2026-05-31days on market $154,900 Active 273 DOM
-
2026-05-17status Active
-
2026-04-07status Pending
-
2026-03-31status Active
-
2026-03-22historical Contingent
-
2026-02-20price $154,900
-
2025-08-19price $159,900
-
2025-07-20$169,000 Active
-
2015-10-27historical
-
2015-08-26$85,900 Active
-
2015-03-03historical
-
2014-03-03$89,900
-
2014-02-28historical
-
2013-08-17$89,900
-
2010-03-29soldstatus $63,000
-
2010-03-29soldstatus $63,000
-
2010-03-04historical
-
2009-10-19$73,000
-
2008-06-03soldstatus $46,768
-
2000-06-23soldstatus $77,000
ⓘ Source: listings_history table (triggers on properties + properties_extension) + one-shot
backfill from property_details.listing_events for pre-trigger history.
Tax reassessment forecast KY · Resets to sale price
- Current annual tax
- $906 · $76/mo
- Projected year-2 tax
- $1,332 · $111/mo
- Expected delta
- +$426/yr (+$35/mo · 47.0%)
ⓘ Screening estimate from a state-policy table — verify with the county assessor before closing.
Climate risk First Street
- Flood 9/10 Extreme FEMA zone A · 99% chance over 30 yrs
- Wildfire 3/10 Moderate
- Heat 4/10 Moderate 7 d/yr ≥102°F today · 20 d/yr by 30 yrs out
- Wind 2/10 Low 100% chance of damaging wind over 30 yrs
- Air quality 2/10 Low 1 unhealthy d/yr today · 2 by 30 yrs out
Nearby sold comps map
Loading sold comps map…
Walkable amenities ~0.75 mi
Loading nearby amenities…
Taxation est. · year 1
- Rental income
- $19,451
- − Mortgage interest
- −$8,677
- − Property taxes
- −$906
- − Insurance
- −$2,277
- − Repairs & maintenance
- −$1,556
- − Management
- −$1,556
- − Depreciation
- −$4,506
- Taxable loss
- −$28
- Est. tax savings @ 24.0%
- +$7
- After-tax cash flow
- $2,442/yr
For passive investors: Depreciation is non-cash, so a rental often shows a tax loss while cash-flowing — sheltering income. Rental losses are passive: they offset passive income freely, and up to $25,000/yr can offset ordinary (W-2) income if you actively participate and your MAGI is under $100k (phasing out to $0 by $150k); unused losses carry forward. On sale, claimed depreciation is recaptured at up to 25%, and gains may owe capital-gains tax (a 1031 exchange can defer both). Figures are a year-1 estimate at your 24.0% rate — not tax advice; consult a CPA.
Schools (NCES district)
- District
- Harrison County
- NCES district ID
- 2102580
- Math proficiency
- 21% ▼ -25.00%
- Reading proficiency
- 32% ▼ -19.00%
- Median HH income
- $39,744
- Composite
- 22.28/100
- National rank
- #8138
- State rank
- #133 of 165 in KY
Livability — Mount Olivet
- Score
- 52/100
- State rank
- #491
- US rank
- #24768
Category grades
Schools grade is shown separately in the Schools card above.
Census & demographics
- Population (ZIP)
- 16,748
Population outlook (Harrison County) Hauer SSP2
- Today (2025)
- 18,605 people
- By 2030
- 18,361 · -1.3%
- By 2040
- 17,685 · -4.9%
- By 2050
- 16,845 · -9.5%
- By 2075
- 14,882 · -20.0%
- By 2100
- 12,314 · -33.8%
Race, ethnicity, and origin ACS 2023
- Neighborhood character
- Predominantly White (93%)
- Race & ethnicity
- White 93% Two or more races 4% Hispanic / Latino 2% Black 2%
- Common ancestry
- Slovak 2% Serbian 2% Italian 2%
- Foreign-born
- 1% · Canada
- Languages at home
- 97% English-only · Spanish 1% German/W. Germanic 1%
Political lean MEDSL · Harrison
- 2024 margin
- Solid R (+48.5) · D 25.1% · R 73.6% · Other 1.3%
- 2008→2024 swing
- -27.4pp toward R · 2008: -21.1pp · 2024: -48.5pp
- All cycles
- 2024: R+48.5 2020: R+44.4 2016: R+43.8 2012: R+29.1 2008: R+21.1
Not yet ingested
- Civics
- —
Market trends
- HPI YoY
- ▲ 14.31%
- Current HPI
- 339.482
- Rent YoY
- —
- Metro
- —
- State GDP YoY
- ▲ 1.81%
- F500 in state
- 4
Industry mix (Fortune 500 HQ in KY)
| Industry | F500 HQs | Revenue |
|---|---|---|
| Healthcare | 1 | $118B |
|
||
| Food / Beverage | 1 | $7B |
|
||
Price history
+101.2% since first listed19 events — show timeline
- 2026-05-17 Relisted — ImagineMLS
- 2026-04-07 Pending — ImagineMLS
- 2026-03-31 Relisted — ImagineMLS
- 2026-03-22 Contingent — ImagineMLS
- 2026-02-20 Price Changed $154,900 ImagineMLS
- 2025-08-19 Price Changed $159,900 ImagineMLS
- 2025-07-20 Listed $169,000 ImagineMLS
- 2015-10-27 Listing Removed — ImagineMLS
- 2015-08-26 Listed $85,900 ImagineMLS
- 2015-03-03 Listing Removed — ImagineMLS
- 2014-03-03 Listed $89,900 ImagineMLS
- 2014-02-28 Listing Removed — ImagineMLS
- 2013-08-17 Listed $89,900 ImagineMLS
- 2010-03-29 Sold (Public Records) $63,000 Public Records
- 2010-03-29 Sold (MLS) $63,000 ImagineMLS
- 2010-03-04 Listing Removed — ImagineMLS
- 2009-10-19 Listed $73,000 ImagineMLS
- 2008-06-03 Sold (Public Records) $46,768 Public Records
- 2000-06-23 Sold (Public Records) $77,000 Public Records
Property tax history
+4.0%/yrLatest (2025): $906 · -0.6% YoY. Source: county tax records.
Cash-flow waterfall
monthlySold comps — $/sqft
last 12 mo · ≤1 miLoading sold comps…