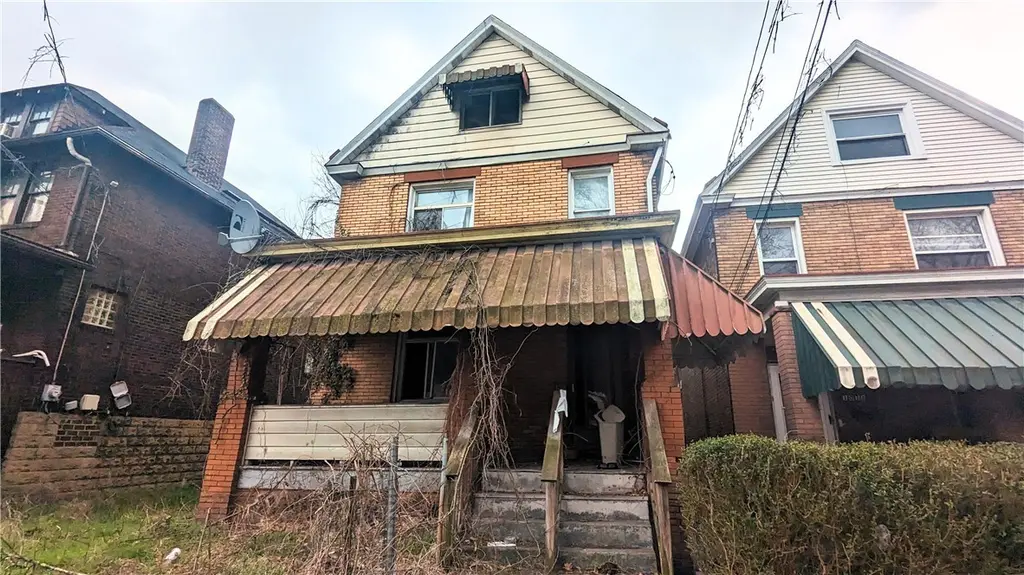
1014 4th St · North Braddock, PA
Flood risk 4/10 · Minor
- FEMA flood zone
- X (unshaded)
- Chance of flooding over 30 yrs
- 0.24%
- Est. flood insurance / yr
- $473 – $860
Fire risk 1/10 · Minimal
- Est. fire insurance / yr
- $511 – $949
Heat risk 4/10 · Minor
- Hot days now (above 98°F)
- 7 days/yr
- Hot days in 30 yrs
- 17 days/yr
Wind risk 2/10 · Minimal
- Chance of severe wind over 30 yrs
- —
Air-quality risk 4/10 · Minor
- Unhealthy air days now
- 4 days/yr
- Unhealthy air days in 30 yrs
- 5 days/yr
Risk factors via First Street. Map © Google.
Why this score? — see what drove the D+ grade
The composite is a weighted blend of 9 inputs, each scored 0–100. Each bar is that input's sub-score; the figure is the points it added to the 100-point composite (weight × sub-score).
- Cash flow +15.0/30.0
- ARV discount +7.5/15.0
- 1% rule +5.0/10.0
- DSCR +5.0/10.0
- Appreciation +4.2/10.0
- Livability +3.7/5.0
- Rent growth +2.5/5.0
- Condition / age +2.5/5.0
- Schools +1.8/10.0
$10,000
🖨 Deal sheet 📄 Offer letter ✓ Due diligence
Listing remarks
This 3 bedroom 1 bath 1,512 sqft home on a 2,820 sqft lot is being sold as is. The property features a covered front porch and back deck, large windows, and three floors of living space. The property requires demolition or a full rehab. In-person showings will not be offered for this property.
Key facts
- Covered front porch
- Large windows
- Back deck
Tags
Property features AI
Finance
- Financial info: Annual taxes approximately $924
- HOA & community: Public transportation nearby
Exterior
- Home design: 3-story building
- Construction: Brick construction
- Exterior features: Brick construction; Lot approximately 0.0647 acres
Interior
- Bathrooms: 1 full bathroom
- Interior features: Resale condition home
Neighborhood map
What this means for you Summary
Snapshot
- This is a 4-bed/1.0-bath single-family listed at $10k.
Deal economics
- At list price, monthly cash flow is $1k ($13k/yr) — positive.
- The deal already cash-flows at list — no discount required.
- Meets the 1% rule at list price ($2k rent vs $10k).
Location & tenants
- Location reads 73/100 on livability (#550 in PA) — a middle-class / working-renter tenant base. Strengths: commute A+, cost of living A+, housing A+; Watch: schools F, amenities F, employment F.
- Woodland Hills SD (suburban): math 13% / reading 30% proficiency, ranked #486 of 539 in PA (top 90%) — low school quality limits family demand, transient renter base, plan for 1-2y turnover; 69% free/reduced lunch — lower-income household profile, screen leases tightly.
- Market conditions: 37 active listings in the ZIP; 11 comparable units currently listed for rent nearby; rentals at typical pace (median 24d on market — plan ~3-4 weeks tenant-placement turnaround); lower-income renter base — watch delinquency; 2,996 units permitted in Allegheny County in 2024 (1,588 in 5+ unit buildings).
- This rent runs 45% of the median local income ($40k/yr) — at the standard rent-burdened threshold; future hikes will face affordability resistance.
Forward outlook
- Local home prices are declining (-1.6%/yr); year-one equity from $69 of loan paydown is wiped out by about $162 of value loss. Plan a longer hold.
- At projected returns (-1.6% appreciation + 3.0% rent growth), your $3k cash investment doubles in ~1 year — after that, you're playing with house money.
Negotiation context
- Only 1 days on market — expect competitive offers; lowballing is unlikely to land.
Risks & watch-outs
- Watch-outs: built in 1920 — expect roof / HVAC / electrical / plumbing capex.
Questions for the listing agent
- Built in 1920 — when were the roof, HVAC, electrical panel, plumbing, and water heater last replaced?
- Is there a deadline driving the sale (1031 exchange, divorce, estate, relocation)? That informs how much negotiation room exists.
- Schools are F-rated, which usually means shorter tenancies and higher turnover. Who's the typical renter profile here, and what's been the actual vacancy rate?
- The area grade is low — what's the realistic commute time and amenity access for the typical tenant pool here? Any planned neighborhood developments (good or bad) we should know about?
- What's the average days-on-market for RENTAL listings here right now (not sales)? A rising rental-DOM trend means longer vacancies and softer asking-rent achievability than the comps imply.
- What's the recent tenant-quality profile in this submarket — average credit score on applications, eviction rate, late-payment / NSF rate, and stable-employment percentage? A property-management company in the area should have these aggregated.
- How much new for-sale + rental construction is in the pipeline within 1–3 miles? Heavy new supply typically softens prices + rents 12–24 months out; constrained supply supports both.
Investment metrics
- 1% rule
- 15.01% ✓
- Cap rate
- 140.29%
- Cash-on-cash
- 478.56%
- DSCR
- 22.29
- GRM
- 0.6
CMA / ARV
- ARV (on-the-fly)
- $68,040
- Comps found
- 12
Show comp detail 12 sales within ~0.75 mi
| Address | Dist | Beds/Ba | Sqft | Sold | Price | $/sf | Match |
|---|---|---|---|---|---|---|---|
| 813 3rd St | 0.16mi | 4/1.0 | 1,472 (-3%) | 1mo | $14,999 | $10 | 87 |
| 126 Mills Ave | 0.46mi | 3/1.0 (-1) | 1,512 (0%) | 5mo | $49,000 | $32 | 69 |
| 226 Lobinger Ave | 0.20mi | 4/2.0 | 1,696 (+12%) | 3mo | $75,525 | $45 | 64 |
| 211 Division St | 0.42mi | 3/1.0 (-1) | 1,596 (+6%) | 4mo | $13,500 | $8 | 63 |
| 122 N Holland Ave | 0.45mi | 3/1.0 (-1) | 1,620 (+7%) | 0mo | $52,000 | $32 | 62 |
| 15 Holland Ave | 0.50mi | 3/1.5 (-1) | 1,408 (-7%) | 1mo | $32,000 | $23 | 58 |
| 123 5th Ave | 0.67mi | 3/1.5 (-1) | 1,551 (+3%) | 6mo | $135,000 | $87 | 52 |
| 1041 Ardmore Manor Dr | 0.75mi | 3/1.5 (-1) | 1,569 (+4%) | 2mo | $208,700 | $133 | 50 |
| 38 Roxbury Rd | 0.74mi | 3/2.5 (-1) | 1,496 (-1%) | 4mo | $250,000 | $167 | 50 |
| 1500 Brinton Rd | 0.69mi | 3/1.5 (-1) | 1,600 (+6%) | 4mo | $100,000 | $63 | 48 |
| 414 Mills Ave | 0.41mi | 3/2.5 (-1) | 1,680 (+11%) | 7mo | $10,000 | $6 | 46 |
| 79 Lilmont Dr | 0.65mi | 3/2.0 (-1) | 1,672 (+11%) | 5mo | $234,900 | $140 | 39 |
Match score weights: distance 35% · size 25% · config 20% · recency 20%. Top-matched comps best support the ARV.
Projected returns pro-forma
-1.62% appreciation · 3.0% rent growth · sell at horizon
- IRR
- —
- Equity multiple
- 26.04×
- Total profit
- $70,112
- Equity at exit
- $2,119
- IRR
- —
- Equity multiple
- 55.74×
- Total profit
- $153,260
- Equity at exit
- $1,982
Cash invested: $2,800 (down + closing). Projections, not guarantees.
Landlord ↔ Tenant lean methodology
- Overall (STATE)
- 62 Landlord-Friendly
- State Pennsylvania
- 62 Landlord-Friendly · EVEN
- County
- — inherits STATE
- City
- — inherits STATE
ZIP-level market 15104
- Home prices YoY
- -1.1%
- Active inventory
- 37
- Price-to-rent
- 0.6×
Monthly cashflow live
- Estimated rent
- $1,501 high interval (Pro) →
- Mortgage (P&I)
- −$52
- Tax est. 1.5%
- −$12 /mo · $150/yr
- Insurance
- −$4
- HOA
- −$0
- Vacancy / Maint / Mgmt
- −$315
- Net cashflow
- $1,117
Break-even live
UW: 25.0% down · 7.5% · 30yr · 1.5% tax · 5.0% vac · 8.0% maint · 8.0% mgmt
Financing live
Cash to close
- Down payment
- $2,500
- Closing costs
- $300
- Reserves months
- —
- Total cash needed
- —
Loan-product check · same deal, 3 products live
Conventional
25% down · 7.5% · 30yr
- Down + closing
- —
- Monthly P&I
- —
- Monthly cashflow
- —
- DSCR
- —
- Eligible?
- —
Personal DTI + credit; lowest rate.
DSCR
20% down · 8.5% · 30yr
- Down + closing
- —
- Monthly P&I
- —
- Monthly cashflow
- —
- DSCR
- —
- Eligible?
- —
No personal income docs; deal must DSCR.
Hard money
10% down · 12.0% · 12mo
- Down + closing
- —
- Monthly P&I
- —
- Monthly cashflow
- —
- DSCR
- —
- Eligible?
- —
Short-term bridge; refi at stabilization.
Rent comps 11 comps
| Address | Beds | Baths | Sqft | Rent | $/sqft | DOM | Units | Dist |
|---|---|---|---|---|---|---|---|---|
| 537 6th St Braddock, PA | 3.0 | 1.0 | 1360 | $1,400 | $1.03 | 43d | 1 | 0.42mi |
| 7645 Highland Ave Pittsburgh, PA | 3.0 | 1.0 | 1161 | $1,325 | $1.14 | 7d | 1 | 0.97mi |
| 227 Parklane Dr Unit Parklane Dr unit North Braddock, PA | 3.0 | 1.0 | 1107 | $1,500 | $1.36 | 12d | 1 | 0.97mi |
| 2323 Patterson Ave Pittsburgh, PA | 3.0 | 1.0 | 1440 | $1,800 | $1.25 | 43d | 1 | 1.04mi |
| 2323 Patterson Ave Unit NA Pittsburgh, PA | 3.0 | 1.0 | 1440 | $1,500 | $1.04 | 23d | 1 | 1.04mi |
| 539 Atlantic Ave Unit 2 Pittsburgh, PA | 3.0 | 1.0 | 1200 | $995 | $0.83 | 43d | 1 | 1.07mi |
| 2219 Manor Ave Pittsburgh, PA | 3.0 | 1.0 | 1638 | $1,600 | $0.98 | 23d | 1 | 1.17mi |
| 2210 Hampton St Pittsburgh, PA | 3.0 | 1.5 | 1512 | $1,650 | $1.09 | 23d | 1 | 1.23mi |
| 481 Filmore Rd Pittsburgh, PA | 3.0 | 1.5 | 1165 | $1,700 | $1.46 | 7d | 1 | 1.28mi |
| 101 Center St East Pittsburgh, PA | 3.0 | 1.0 | 1500 | $1,505 | $1.00 | 10d | 1 | 1.46mi |
| 931 Hilltop St Homestead, PA | 3.0 | 1.5 | 1312 | $1,500 | $1.14 | 14d | 1 | 1.49mi |
Listing history 2 events
-
2026-06-19remarks 294-char remark
-
2026-06-19$10,000 Active 1 DOM
ⓘ Source: listings_history table (triggers on properties + properties_extension) + one-shot
backfill from property_details.listing_events for pre-trigger history.
Climate risk First Street
- Flood 4/10 Moderate FEMA zone X (unshaded) · 24% chance over 30 yrs
- Wildfire 1/10 Low
- Heat 4/10 Moderate 7 d/yr ≥98°F today · 17 d/yr by 30 yrs out
- Wind 2/10 Low
- Air quality 4/10 Moderate 4 unhealthy d/yr today · 5 by 30 yrs out
Nearby sold comps map
Loading sold comps map…
Walkable amenities ~0.75 mi
Loading nearby amenities…
Taxation est. · year 1
- Rental income
- $18,012
- − Mortgage interest
- −$560
- − Property taxes
- −$150
- − Insurance
- −$50
- − Repairs & maintenance
- −$1,441
- − Management
- −$1,441
- − Depreciation
- −$291
- Taxable income
- $14,079
- Est. tax owed @ 24.0%
- −$3,379
- After-tax cash flow
- $10,021/yr
For passive investors: Depreciation is non-cash, so a rental often shows a tax loss while cash-flowing — sheltering income. Rental losses are passive: they offset passive income freely, and up to $25,000/yr can offset ordinary (W-2) income if you actively participate and your MAGI is under $100k (phasing out to $0 by $150k); unused losses carry forward. On sale, claimed depreciation is recaptured at up to 25%, and gains may owe capital-gains tax (a 1031 exchange can defer both). Figures are a year-1 estimate at your 24.0% rate — not tax advice; consult a CPA.
Schools (NCES district)
- District
- Woodland Hills SD
- NCES district ID
- 4216500
- Math proficiency
- 13% ▼ -13.00%
- Reading proficiency
- 30% ▼ -10.00%
- Median HH income
- $41,803
- Composite
- 18.31/100
- National rank
- #8954
- State rank
- #486 of 539 in PA
Livability — North Braddock
- Score
- 73/100
- State rank
- #550
- US rank
- #5126
Category grades
Schools grade is shown separately in the Schools card above.
Census & demographics
- Census place
- North Braddock, PA
- County
- Allegheny County · 1,022,028 people
- City population
- 7,946
- Metro
- Pittsburgh, PA
- Population (ZIP)
- 8,034
- Household income
- $40,104
- Rent vs Own
- Severe rent burden
- 515.0
Population outlook (Allegheny County) Hauer SSP2
- Today (2025)
- 1,250,282 people
- By 2030
- 1,256,482 · +0.5%
- By 2040
- 1,256,318 · +0.5%
- By 2050
- 1,244,169 · -0.5%
- By 2075
- 1,197,693 · -4.2%
- By 2100
- 1,093,187 · -12.6%
Race, ethnicity, and origin ACS 2023
- Neighborhood character
- Diverse neighborhood (Simpson 0.56)
- Race & ethnicity
- Black 59% White 31% Two or more races 6% Hispanic / Latino 3%
- Common ancestry
- Romanian 4% Hispanic 1% Lithuanian 1%
- Foreign-born
- 0%
- Languages at home
- 97% English-only · Spanish 2%
Political lean MEDSL · Allegheny
- 2024 margin
- Strong D (+20.3) · D 59.7% · R 39.4%
- 2008→2024 swing
- +4.8pp toward D · 2008: 15.5pp · 2024: 20.3pp
- All cycles
- 2024: D+20.3 2020: D+20.4 2016: D+16.4 2012: D+14.4 2008: D+15.5
Not yet ingested
- Civics
- —
Market trends
- HPI YoY
- ▼ -1.62%
- Current HPI
- 138.912
- Rent YoY
- —
- Metro
- Pittsburgh, PA
- State GDP YoY
- ▲ 1.68%
- F500 in state
- 34
Industry mix (Fortune 500 HQ in PA)
| Industry | F500 HQs | Revenue |
|---|---|---|
| Healthcare | 2 | $309B |
|
||
| Insurance | 2 | $27B |
|
||
| Telecommunications / Media | 1 | $124B |
|
||
| Industrial Distribution | 1 | $22B |
|
||
| Financial Services | 1 | $20B |
|
||
| Chemicals / Materials | 1 | $18B |
|
||
Price history
-57.4% since first listed3 events — show timeline
- 2026-06-18 Listed $10,000 West Penn MLS
- 2007-11-08 Sold (Public Records) $11,000 Public Records
- 1993-04-05 Sold (Public Records) $23,500 Public Records
Property tax history
+1.8%/yrLatest (2025): $877 · +7.6% YoY. Source: county tax records.
Cash-flow waterfall
monthlySold comps — $/sqft
last 12 mo · ≤1 miLoading sold comps…