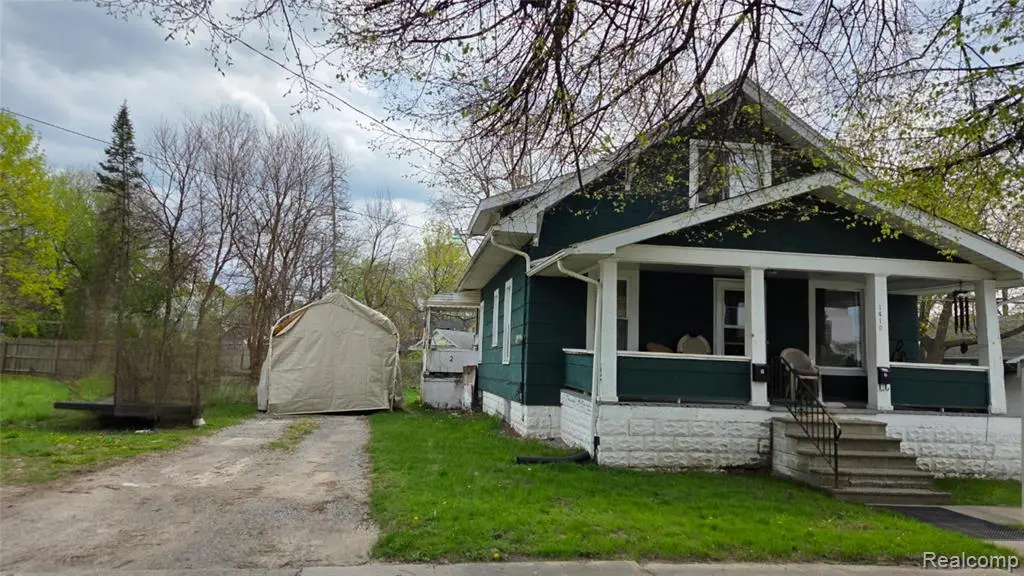
1410 Indiana Ave · Flint, MI
Flood risk 1/10 · Minimal
- FEMA flood zone
- X (unshaded)
- Chance of flooding over 30 yrs
- 0.0%
- Est. flood insurance / yr
- $507 – $1,088
Fire risk 1/10 · Minimal
- Est. fire insurance / yr
- $784 – $1,456
Heat risk 2/10 · Minimal
- Hot days now (above 96°F)
- 7 days/yr
- Hot days in 30 yrs
- 15 days/yr
Wind risk 2/10 · Minimal
- Chance of severe wind over 30 yrs
- —
Air-quality risk 3/10 · Minor
- Unhealthy air days now
- 3 days/yr
- Unhealthy air days in 30 yrs
- 4 days/yr
Risk factors via First Street. Map © Google.
Why this score? — see what drove the B- grade
The composite is a weighted blend of 9 inputs, each scored 0–100. Each bar is that input's sub-score; the figure is the points it added to the 100-point composite (weight × sub-score).
- Cash flow +30.0/30.0
- 1% rule +10.0/10.0
- DSCR +10.0/10.0
- ARV discount +7.5/15.0
- Livability +3.7/5.0
- Rent growth +2.5/5.0
- Condition / age +2.5/5.0
- Schools +1.1/10.0
- Appreciation +0.0/10.0
$40,000
🖨 Deal sheet (PDF) 📄 Offer letter ✓ Due diligence
Listing remarks MLS
Step into a piece of Flint's history at 1410 Indiana Ave, a charming single-family residence built in 1921. This bungalow offers a compelling opportunity for investors and handy homeowners alike, presenting a canvas brimming with potential. The heart of the home, the kitchen, uniquely blends rustic charm with industrial flair, featuring both a distinctive brick wall and a warm wood wall. With three bedrooms and two bathrooms, this property provides functional living spaces ready for your personal touch. A welcoming porch extends an invitation to enjoy the outdoors. This great investment property is poised for its next chapter; schedule a showing today to discover its full potential. INVESTORS - this property is also being listed as part of a package with 5 other properties as follows: 1) 2618 Lester Ct - MLS #20261033179 2) 838 Clinton St - MLS #20261033188 3) 1426 Lincoln Ave - MLS #20261033513 4) 920 Huron St - MLS #20261033550 5) 733 Vermilya Ave - MLS #20261033139 Contact listing agent to schedule a showing
Key facts
- Warm wood wall
- Welcoming porch
- 3,920 sq ft lot
Tags
Property features AI
Exterior
- Parking: Detached 1-car garage
- Utilities: Public water; Public sewer
- Home design: Two-story single-family residence; Ground-level entry with steps
- Construction: Asphalt construction materials; Asphalt roof; Block foundation; Built as residential single-family
- Exterior features: Paved road access; Lot approximately 0.09 acres (25.82 x 10⁵)
Interior
- Bathrooms: Two full bathrooms
- Heating & cooling: Forced air heating; Natural gas heating; No central cooling
- Interior features: Unfinished basement; Six total rooms
Neighborhood map
What this means for you Summary
Snapshot
- This is a 3-bed/2.0-bath single-family listed at $40k.
Deal economics
- At list price, monthly cash flow is $453 ($5k/yr) — positive.
- The deal already cash-flows at list — no discount required.
- Meets the 1% rule at list price ($979 rent vs $40k).
- Recommended offer: $39k (1.5% below list) — sets the bar for market timing.
- Cap rate 19.9% vs local median 11.5% in Flint — top-decile yield for the area; either an underpriced asset or a hidden risk that comps aren't pricing in. Stress-test before assuming the spread holds.
Location & tenants
- Location reads 74/100 on livability (#196 in MI, #4,946 nationally) — a middle-class / working-renter tenant base. Strengths: commute A+, cost of living A+, housing A+; Watch: schools F, crime F, employment F.
- Flint School District (urban): math 7% / reading 13% proficiency, ranked #714 of 760 in MI (top 94%) — low school quality limits family demand, transient renter base, plan for 1-2y turnover; 83% free/reduced lunch — lower-income household profile, screen leases tightly.
- Market conditions: 202 active listings in the ZIP; 5 comparable units currently listed for rent nearby; rentals at typical pace (median 14d on market — plan ~3-4 weeks tenant-placement turnaround); 419 units permitted in Genesee County in 2024 (68 in 5+ unit buildings).
Forward outlook
- Local home prices are declining (-3.0%/yr); year-one equity from $277 of loan paydown is wiped out by about $1k of value loss. Plan a longer hold.
- Genesee County population projected at -27% by 2050 — secular population decline; favor cash flow + early exit over multi-decade hold.
- At projected returns (-3.0% appreciation + 3.0% rent growth), your $11k cash investment doubles in ~3 years — after that, you're playing with house money.
Negotiation context
- It's been on market 30 days — a 2% lower offer ($39k) is reasonable based on typical stale-listing flexibility.
- 4 sale attempts since 14y ago; this cycle's ask has dropped $10k (20%) from the opening price — seller is motivated, your offer sets the floor, not the list.
- Current owner paid $9k; list at $40k implies a 344% gain — meaningful room to come down on a strong offer.
Risks & watch-outs
- Watch-outs: property tax is 2.8% of price; built in 1921 — expect roof / HVAC / electrical / plumbing capex.
Questions for the listing agent
- Built in 1921 — when were the roof, HVAC, electrical panel, plumbing, and water heater last replaced?
- Property tax is high relative to price — has the assessment been appealed recently, and will the sale trigger a re-assessment?
- Is there a deadline driving the sale (1031 exchange, divorce, estate, relocation)? That informs how much negotiation room exists.
- Schools are F-rated, which usually means shorter tenancies and higher turnover. Who's the typical renter profile here, and what's been the actual vacancy rate?
- Crime grade is F in this area — have there been break-ins, vandalism, or insurance claims at this property in the last 3 years? What carrier currently insures it and at what premium?
- What's the average days-on-market for RENTAL listings here right now (not sales)? A rising rental-DOM trend means longer vacancies and softer asking-rent achievability than the comps imply.
- What's the recent tenant-quality profile in this submarket — average credit score on applications, eviction rate, late-payment / NSF rate, and stable-employment percentage? A property-management company in the area should have these aggregated.
- How much new for-sale + rental construction is in the pipeline within 1–3 miles? Heavy new supply typically softens prices + rents 12–24 months out; constrained supply supports both.
Investment metrics
- 1% rule
- 2.45% ✓
- Cap rate
- 19.88%
- Cash-on-cash
- 48.51%
- DSCR
- 3.16
- GRM
- 3.4
CMA / ARV
- ARV (on-the-fly)
- $26,496
- Comps found
- 12
Show comp detail 12 sales within ~0.75 mi
| Address | Dist | Beds/Ba | Sqft | Sold | Price | $/sf | Match |
|---|---|---|---|---|---|---|---|
| 1379 Washington Ave | 0.21mi | 4/1.0 (+1) | 1,300 (+13%) | 2mo | $85,000 | $65 | 58 |
| 1241 Poplar St | 0.42mi | 4/2.0 (+1) | 1,030 (-11%) | 1mo | $25,650 | $25 | 57 |
| 1640 Kentucky Ave | 0.43mi | 3/1.5 | 1,060 (-8%) | 14mo | $12,000 | $11 | 53 |
| 1420 Dakota Ave | 0.64mi | 3/1.5 | 1,056 (-8%) | 4mo | $9,000 | $9 | 51 |
| 1646 Bennett Ave | 0.39mi | 3/1.0 | 1,260 (+9%) | 13mo | $24,900 | $20 | 51 |
| 1449 New York Ave | 0.49mi | 4/1.0 (+1) | 1,248 (+8%) | 6mo | $5,500 | $4 | 49 |
| 1215 Bennett Ave | 0.34mi | 2/1.0 (-1) | 1,001 (-13%) | 5mo | $31,000 | $31 | 49 |
| 1513 Jane Ave | 0.40mi | 2/1.0 (-1) | 1,002 (-13%) | 3mo | $12,000 | $12 | 48 |
| 1809 Kentucky Ave | 0.53mi | 3/1.0 | 1,038 (-10%) | 10mo | $24,000 | $23 | 46 |
| 2213 Pennsylvania Ave | 0.71mi | 3/1.0 | 1,248 (+8%) | 13mo | $57,680 | $46 | 38 |
| 1702 Nebraska Ave | 0.50mi | 2/1.0 (-1) | 998 (-13%) | 10mo | $28,000 | $28 | 37 |
| 2612 Maplewood Ave | 0.74mi | 2/1.0 (-1) | 1,041 (-10%) | 11mo | $15,000 | $14 | 31 |
Match score weights: distance 35% · size 25% · config 20% · recency 20%. Top-matched comps best support the ARV.
Projected returns pro-forma
-3.0% appreciation · 3.0% rent growth · sell at horizon
- IRR
- 46.1%
- Equity multiple
- 3.00×
- Total profit
- $22,399
- Equity at exit
- $5,964
- IRR
- 51.9%
- Equity multiple
- 6.07×
- Total profit
- $56,811
- Equity at exit
- $3,458
Cash invested: $11,200 (down + closing). Projections, not guarantees.
Landlord ↔ Tenant lean methodology
- Overall (STATE)
- 62 Landlord-Friendly
- State Michigan
- 62 Landlord-Friendly · EVEN
- County
- — inherits STATE
- City
- — inherits STATE
ZIP-level market 48506
- Active inventory
- 202
- Price-to-rent
- 3.4×
Monthly cashflow live
- Estimated rent
- $979 high interval (Pro) →
- Mortgage (P&I)
- −$210
- Tax from tax record
- −$95 /mo · $1,134/yr
- Insurance
- −$17
- HOA
- −$0
- Vacancy / Maint / Mgmt
- −$206
- Net cashflow
- $453
Break-even live
Sensitivity live
| Price | -10% $475 | -5% $464 | +0% $453 | +5% $441 | +10% $430 |
|---|---|---|---|---|---|
| Rent | -10% $375 | -5% $414 | +0% $453 | +5% $491 | +10% $530 |
| Rate | -1.0pp $473 | -0.5pp $463 | base $453 | +0.5pp $442 | +1.0pp $432 |
UW: 25.0% down · 7.5% · 30yr · 1.5% tax · 5.0% vac · 8.0% maint · 8.0% mgmt
Financing live
Cash to close
- Down payment
- $10,000
- Closing costs
- $1,200
- Reserves months
- —
- Total cash needed
- —
Loan-product check · same deal, 3 products live
Conventional
25% down · 7.5% · 30yr
- Down + closing
- —
- Monthly P&I
- —
- Monthly cashflow
- —
- DSCR
- —
- Eligible?
- —
Personal DTI + credit; lowest rate.
DSCR
20% down · 8.5% · 30yr
- Down + closing
- —
- Monthly P&I
- —
- Monthly cashflow
- —
- DSCR
- —
- Eligible?
- —
No personal income docs; deal must DSCR.
Hard money
10% down · 12.0% · 12mo
- Down + closing
- —
- Monthly P&I
- —
- Monthly cashflow
- —
- DSCR
- —
- Eligible?
- —
Short-term bridge; refi at stabilization.
Rent comps 5 comps
| Address | Beds | Baths | Sqft | Rent | $/sqft | DOM | Units | Dist |
|---|---|---|---|---|---|---|---|---|
| 1553 Illinois Ave Flint, MI | 2.0 | 1.0 | 702 | $900 | $1.28 | 21d | 1 | 0.23mi |
| 1605 Kearsley Park Blvd Flint, MI | 2.0 | 1.0 | 875 | $975 | $1.11 | 14d | 1 | 0.30mi |
| 2621 Churchill Ave Flint, MI | 2.0 | 1.0 | 736 | $795 | $1.08 | 14d | 1 | 0.94mi |
| 501 S Meade St Flint, MI | 2.0 | 1.0 | 850 | $695 | $0.82 | 14d | 1 | 1.20mi |
| 1540 Garland St Flint, MI | 3.0 | 2.5 | 1344 | $1,017 | $0.76 | 21d | 1 | 1.46mi |
Listing history 24 events
-
2026-06-18days on market $40,000 Active 30 DOM
-
2026-06-17days on market $40,000 Active 29 DOM
-
2026-06-16days on market $40,000 Active 28 DOM
-
2026-06-15days on market $40,000 Active 27 DOM
-
2026-06-14days on market $40,000 Active 25 DOM
-
2026-06-13pricedays on market $40,000 Active 24 DOM
-
2026-06-10days on market $50,000 Active 22 DOM
-
2026-06-09days on market $50,000 Active 21 DOM
-
2026-06-08days on market $50,000 Active 20 DOM
-
2026-06-07days on market $50,000 Active 19 DOM
-
2026-06-05days on market $50,000 Active 16 DOM
-
2026-06-03days on market $50,000 Active 15 DOM
-
2026-06-02days on market $50,000 Active 14 DOM
-
2026-06-01days on market $50,000 Active 13 DOM
-
2026-05-31days on market $50,000 Active 12 DOM
-
2026-05-30days on market $50,000 Active 11 DOM
-
2026-05-19$50,000 Active
Show marketing remark (1026 chars)
Step into a piece of Flint's history at 1410 Indiana Ave, a charming single-family residence built in 1921. This bungalow offers a compelling opportunity for investors and handy homeowners alike, presenting a canvas brimming with potential. The heart of the home, the kitchen, uniquely blends rustic charm with industrial flair, featuring both a distinctive brick wall and a warm wood wall. With three bedrooms and two bathrooms, this property provides functional living spaces ready for your personal touch. A welcoming porch extends an invitation to enjoy the outdoors. This great investment property is poised for its next chapter; schedule a showing today to discover its full potential. INVESTORS - this property is also being listed as part of a package with 5 other properties as follows: 1) 2618 Lester Ct - MLS #20261033179 2) 838 Clinton St - MLS #20261033188 3) 1426 Lincoln Ave - MLS #20261033513 4) 920 Huron St - MLS #20261033550 5) 733 Vermilya Ave - MLS #20261033139 Contact listing agent to schedule a showing
-
2026-05-19$50,000 Active 1026-char remark
Show marketing remark (1026 chars)
Step into a piece of Flint's history at 1410 Indiana Ave, a charming single-family residence built in 1921. This bungalow offers a compelling opportunity for investors and handy homeowners alike, presenting a canvas brimming with potential. The heart of the home, the kitchen, uniquely blends rustic charm with industrial flair, featuring both a distinctive brick wall and a warm wood wall. With three bedrooms and two bathrooms, this property provides functional living spaces ready for your personal touch. A welcoming porch extends an invitation to enjoy the outdoors. This great investment property is poised for its next chapter; schedule a showing today to discover its full potential. INVESTORS - this property is also being listed as part of a package with 5 other properties as follows: 1) 2618 Lester Ct - MLS #20261033179 2) 838 Clinton St - MLS #20261033188 3) 1426 Lincoln Ave - MLS #20261033513 4) 920 Huron St - MLS #20261033550 5) 733 Vermilya Ave - MLS #20261033139 Contact listing agent to schedule a showing
-
2013-03-18soldstatus $9,000
-
2012-03-16soldstatus $4,001 88-char remark
Show marketing remark (88 chars)
Two bedroom home with covered porch, detached garage, full basement, and more! HUD Home.
-
2012-03-16soldstatus $4,001
Show marketing remark (88 chars)
Two bedroom home with covered porch, detached garage, full basement, and more! HUD Home.
-
2012-01-31historical 88-char remark
Show marketing remark (88 chars)
Two bedroom home with covered porch, detached garage, full basement, and more! HUD Home.
-
2012-01-27$4,000 88-char remark
Show marketing remark (88 chars)
Two bedroom home with covered porch, detached garage, full basement, and more! HUD Home.
-
2012-01-27$4,000
Show marketing remark (88 chars)
Two bedroom home with covered porch, detached garage, full basement, and more! HUD Home.
ⓘ Source: listings_history table (triggers on properties + properties_extension) + one-shot
backfill from property_details.listing_events for pre-trigger history.
Tax reassessment forecast MI · Partial reset (capped growth)
- Current annual tax
- $1,134 · $95/mo
- Projected year-2 tax
- $1,134 · $95/mo
- Expected delta
- $0/yr ($0/mo · 0.0%)
ⓘ Screening estimate from a state-policy table — verify with the county assessor before closing.
Climate risk First Street
- Flood 1/10 Low FEMA zone X (unshaded) · 0% chance over 30 yrs
- Wildfire 1/10 Low
- Heat 2/10 Low 7 d/yr ≥96°F today · 15 d/yr by 30 yrs out
- Wind 2/10 Low
- Air quality 3/10 Moderate 3 unhealthy d/yr today · 4 by 30 yrs out
Nearby sold comps map
Loading sold comps map…
Walkable amenities ~0.75 mi
Loading nearby amenities…
Taxation est. · year 1
- Rental income
- $11,753
- − Mortgage interest
- −$2,241
- − Property taxes
- −$1,134
- − Insurance
- −$200
- − Repairs & maintenance
- −$940
- − Management
- −$940
- − Depreciation
- −$1,164
- Taxable income
- $5,134
- Est. tax owed @ 24.0%
- −$1,232
- After-tax cash flow
- $4,201/yr
For passive investors: Depreciation is non-cash, so a rental often shows a tax loss while cash-flowing — sheltering income. Rental losses are passive: they offset passive income freely, and up to $25,000/yr can offset ordinary (W-2) income if you actively participate and your MAGI is under $100k (phasing out to $0 by $150k); unused losses carry forward. On sale, claimed depreciation is recaptured at up to 25%, and gains may owe capital-gains tax (a 1031 exchange can defer both). Figures are a year-1 estimate at your 24.0% rate — not tax advice; consult a CPA.
Schools (NCES district)
- District
- Flint School District
- NCES district ID
- 2614520
- Math proficiency
- 7% ▬ 0.00%
- Reading proficiency
- 13% ▲ 3.00%
- Median HH income
- $25,954
- Composite
- 10.97/100
- National rank
- #14642
- State rank
- #714 of 760 in MI
Livability — Flint
- Score
- 74/100
- State rank
- #196
- US rank
- #4946
Category grades
Schools grade is shown separately in the Schools card above.
Census & demographics
- Census place
- Flint, MI
- County
- Genesee County · 221,329 people
- City population
- 93,814
- Metro
- Flint, MI
- Population (ZIP)
- 24,712
- Household income
- $47,929
- Rent vs Own
- Severe rent burden
- 954.0
Population outlook (Genesee County) Hauer SSP2
- Today (2025)
- 381,312 people
- By 2030
- 362,731 · -4.9%
- By 2040
- 321,550 · -15.7%
- By 2050
- 279,212 · -26.8%
- By 2075
- 193,336 · -49.3%
- By 2100
- 128,118 · -66.4%
Race, ethnicity, and origin ACS 2023
- Neighborhood character
- Predominantly White (76%)
- Race & ethnicity
- White 76% Black 9% Hispanic / Latino 8% Two or more races 7%
- Hispanic origin (detail)
- Mexican 6%
- Common ancestry
- Lithuanian 6% Romanian 4% Slovak 3%
- Foreign-born
- 3% · Canada
- Languages at home
- 96% English-only · Spanish 3%
Political lean MEDSL · Genesee
- 2024 margin
- Toss-up / Even · D 51.4% · R 47.2% · Other 1.4%
- 2008→2024 swing
- -28.3pp toward R · 2008: 32.5pp · 2024: 4.2pp
- All cycles
- 2024: D+4.2 2020: D+9.3 2016: D+9.5 2012: D+28.2 2008: D+32.5
Not yet ingested
- Civics
- —
Market trends
- HPI YoY
- ▼ -173.31%
- Current HPI
- 90.0494
- Rent YoY
- —
- Metro
- Flint, MI
- State GDP YoY
- ▲ 1.37%
- F500 in state
- 28
Industry mix (Fortune 500 HQ in MI)
| Industry | F500 HQs | Revenue |
|---|---|---|
| Automotive Parts | 3 | $48B |
|
||
| Automotive | 2 | $372B |
|
||
| Chemicals | 1 | $45B |
|
||
| Automotive Retail | 1 | $29B |
|
||
| Healthcare / Medical Devices | 1 | $23B |
|
||
| Automotive Technology | 1 | $20B |
|
||
Price history
+1150.0% since first listed8 events — show timeline
- 2026-05-19 Listed $50,000 MiRealSource-MiMLS
- 2026-05-19 Listed $50,000 REALCOMP
- 2013-03-18 Sold (Public Records) $9,000 Public Records
- 2012-03-16 Sold (MLS) $4,001 REALCOMP
- 2012-03-16 Sold (MLS) $4,001 MiRealSource-MiMLS
- 2012-01-31 Listing Removed — MiRealSource-MiMLS
- 2012-01-27 Listed $4,000 REALCOMP
- 2012-01-27 Listed $4,000 MiRealSource-MiMLS
Property tax history
-0.2%/yrLatest (2025): $1,134 · +1.7% YoY. Source: county tax records.
Cash-flow waterfall
monthlySold comps — $/sqft
last 12 mo · ≤1 miLoading sold comps…