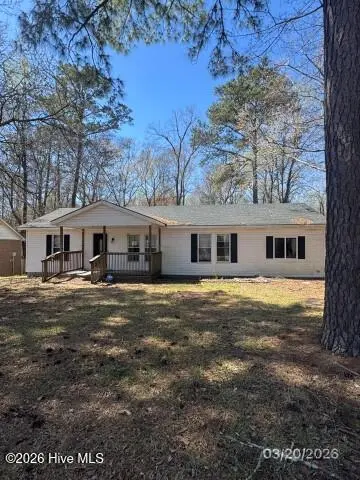
846 Mill River Rd · Jacksonville, NC
Flood risk 6/10 · Moderate
- FEMA flood zone
- X (unshaded)
- Chance of flooding over 30 yrs
- 0.74%
- Est. flood insurance / yr
- $507 – $1,088
Fire risk 5/10 · Moderate
- Est. fire insurance / yr
- $906 – $1,684
Heat risk 8/10 · Major
- Hot days now (above 106°F)
- 7 days/yr
- Hot days in 30 yrs
- 18 days/yr
Wind risk 8/10 · Major
- Chance of severe wind over 30 yrs
- 98.0%
Air-quality risk 3/10 · Minor
- Unhealthy air days now
- 2 days/yr
- Unhealthy air days in 30 yrs
- 5 days/yr
Risk factors via First Street. Map © Google.
Why this score? — see what drove the D+ grade
The composite is a weighted blend of 9 inputs, each scored 0–100. Each bar is that input's sub-score; the figure is the points it added to the 100-point composite (weight × sub-score).
- ARV discount +15.0/15.0
- Cash flow +13.2/30.0
- DSCR +4.0/10.0
- Schools +3.9/10.0
- Rent growth +3.6/5.0
- Livability +3.6/5.0
- 1% rule +2.8/10.0
- Condition / age +2.5/5.0
- Appreciation +0.0/10.0
$174,000
🖨 Deal sheet 📄 Offer letter ✓ Due diligence
Listing remarks
Imagine the joy of stepping into a home where modern country charm and spacious living come together beautifully! This lovely 3-bedroom, 2-bathroom residence offers an open-concept layout that feels wonderfully bright and welcoming. You'll love the heart of the home: a modern kitchen featuring a deep farmhouse sink and plenty of storage. The peaceful primary suite includes a spacious walk-in closet and a relaxing en-suite bath, while the guest rooms are tucked away on the other side for extra privacy. Plus, there's a versatile bonus room perfect for whatever your heart desires! Outside, you can relax on the expansive deck or the cozy front porch surrounded by beautiful, mature trees. With
Key facts
- Deep farmhouse sink
- Large bonus room
- Lush backyard oasis
Tags
Property features AI
Finance
- Other: Zoning: R-15; Lot dimensions: 71 x 325 x 29 x 85 x 314 (0.68 acres); Subdivision: West River
Exterior
- Parking: On-site parking
- Utilities: Public water; Septic tank sewer; Water available
- Home design: Single family residence; One level / single-story; Entry level: 1; Residential property
- Construction: Vinyl siding and frame construction; Shingle roof; Crawl space / no basement; Built-in year not specified
- Exterior features: Covered patio/porch; Deck; Porch; Wood fencing in back yard; Has a view; Other structures (see remarks); Paved road access
Interior
- Kitchen: Electric oven; Refrigerator; Dishwasher
- Bedrooms: 7 total rooms (bedroom count not specified)
- Flooring: Carpet
- Bathrooms: 2 full bathrooms
- Heating & cooling: Heat pump heating; Electric heating; Central air conditioning; Heat pump cooling
- Interior features: Walk-in closets; Ceiling fans; Eat-in kitchen; Unfurnished
- Laundry & utility: Laundry room; Electric water heater
Neighborhood map
What this means for you Summary
Snapshot
- This is a 3-bed/2.0-bath single-family listed at $174k.
Deal economics
- At list price, monthly cash flow is $-4 ($-44/yr) — negative.
- To cash-flow at today's rent, offer at most $173k (0.4% below list).
- To meet the 1% rule (rent ≥ 1% of price), the offer needs to be $135k (22.4% below list).
- Recommended offer: $135k (22.4% below list) — sets the bar for 1% rule.
- Cap rate 6.3% vs local median 4.4% in Jacksonville — top-decile yield for the area; either an underpriced asset or a hidden risk that comps aren't pricing in. Stress-test before assuming the spread holds.
Location & tenants
- Location reads 71/100 on livability (#111 in NC) — a middle-class / working-renter tenant base. Strengths: cost of living A+, housing A+, health & safety A+; Watch: employment D, crime F, amenities F.
- Onslow County Schools (other): math 42% / reading 49% proficiency, ranked #84 of 178 in NC (top 47%) — families likely to look elsewhere, expect single-tenant / working-renter base with shorter leases.
- Zoned schools: Blue Creek Elementary (math 42% / reading 47%, grade F, #574 of 1,410 statewide, top 43%, 490 students, 66% FRL); Southwest Middle (math 22% / reading 42%, grade F, #317 of 475 statewide, top 68%, 527 students, 64% FRL); Southwest High (math 52% / reading 47%, grade D, #311 of 535 statewide, top 60%, 702 students, 54% FRL) — zoned schools average 61% FRL vs 37% district-wide (25 pts higher); higher-poverty schools than district average — tighter screening recommended.
- Market conditions: Rents rising fast (+4.5%/yr); 380 active listings in the ZIP; 2 comparable units currently listed for rent nearby; 1,246 units permitted in Onslow County in 2024 (0 in 5+ unit buildings).
Forward outlook
- Local home prices are declining (-3.0%/yr); year-one equity from $1k of loan paydown is wiped out by about $5k of value loss. Plan a longer hold.
Negotiation context
- It's been on market 37 days — a 3% lower offer ($169k) is reasonable based on typical stale-listing flexibility.
- 6 sale attempts since 8y ago; this cycle's ask has dropped $12k (6%) from the opening price — seller is motivated, your offer sets the floor, not the list.
Risks & watch-outs
- Climate carrying-cost: major flood risk; severe wind risk, 98% chance of damaging wind over 30y; moderate wildfire risk; extreme-heat days projected 7→18/yr by 2055 (HVAC capex compounding) — expect insurance premiums to compound above CPI over the hold.
Questions for the listing agent
- What do current leases actually rent for vs. the listed asking? Can we see a recent rent roll and the last 12 months of T-12 income?
- It's been on market 37 days. Have you received any prior offers? Is the seller open to a 22% concession, seller financing, or rate buy-down credit?
- Is there a deadline driving the sale (1031 exchange, divorce, estate, relocation)? That informs how much negotiation room exists.
- Crime grade is F in this area — have there been break-ins, vandalism, or insurance claims at this property in the last 3 years? What carrier currently insures it and at what premium?
- The area grade is low — what's the realistic commute time and amenity access for the typical tenant pool here? Any planned neighborhood developments (good or bad) we should know about?
- What's the average days-on-market for RENTAL listings here right now (not sales)? A rising rental-DOM trend means longer vacancies and softer asking-rent achievability than the comps imply.
- What's the recent tenant-quality profile in this submarket — average credit score on applications, eviction rate, late-payment / NSF rate, and stable-employment percentage? A property-management company in the area should have these aggregated.
- How much new for-sale + rental construction is in the pipeline within 1–3 miles? Heavy new supply typically softens prices + rents 12–24 months out; constrained supply supports both.
Investment metrics
- 1% rule
- 0.78% ✗
- Cap rate
- 6.27%
- Cash-on-cash
- -0.09%
- DSCR
- 1.00
- GRM
- 10.7
CMA / ARV
- ARV (on-the-fly)
- $239,096
- Comps found
- 6
Show comp detail 6 sales within ~0.75 mi
| Address | Dist | Beds/Ba | Sqft | Sold | Price | $/sf | Match |
|---|---|---|---|---|---|---|---|
| 848 Mill River Rd | 0.02mi | 3/2.0 | 1,072 (-6%) | 14mo | $224,000 | $209 | 77 |
| 302 Southwest Dr | 0.41mi | 3/2.0 | 1,177 (+3%) | 5mo | $248,000 | $211 | 72 |
| 863 Mill River Rd | 0.13mi | 3/2.0 | 1,098 (-4%) | 20mo | $157,000 | $143 | 70 |
| 816 Mill River Rd | 0.23mi | 3/2.0 | 1,305 (+14%) | 6mo | $250,000 | $192 | 61 |
| 811 Mill River Rd | 0.26mi | 3/2.0 | 1,280 (+12%) | 23mo | $224,900 | $176 | 49 |
| 289 Haws Run Rd | 0.53mi | 3/2.0 | 1,243 (+9%) | 23mo | $265,000 | $213 | 42 |
Match score weights: distance 35% · size 25% · config 20% · recency 20%. Top-matched comps best support the ARV.
Projected returns pro-forma
-3.0% appreciation · 4.47% rent growth · sell at horizon
- IRR
- -15.0%
- Equity multiple
- 0.46×
- Total profit
- $-26,460
- Equity at exit
- $25,944
- IRR
- -4.4%
- Equity multiple
- 0.69×
- Total profit
- $-15,013
- Equity at exit
- $15,044
Cash invested: $48,720 (down + closing). Projections, not guarantees.
Landlord ↔ Tenant lean methodology
- Overall (STATE)
- 85 Strongly Landlord-Friendly
- State North Carolina
- 85 Strongly Landlord-Friendly · R+3
- County
- — inherits STATE
- City
- — inherits STATE
ZIP-level market 28540
- Home prices YoY
- -21.5%
- Rents YoY
- 4.5%
- Active inventory
- 380
- Price-to-rent
- 10.7×
Monthly cashflow live
- Estimated rent
- $1,351 medium interval (Pro) →
- Mortgage (P&I)
- −$912
- Tax from tax record
- −$86 /mo · $1,031/yr
- Insurance
- −$72
- HOA
- −$0
- Vacancy / Maint / Mgmt
- −$284
- Net cashflow
- $-4
Break-even live
UW: 25.0% down · 7.5% · 30yr · 1.5% tax · 5.0% vac · 8.0% maint · 8.0% mgmt
Financing live
Cash to close
- Down payment
- $43,500
- Closing costs
- $5,220
- Reserves months
- —
- Total cash needed
- —
Loan-product check · same deal, 3 products live
Conventional
25% down · 7.5% · 30yr
- Down + closing
- —
- Monthly P&I
- —
- Monthly cashflow
- —
- DSCR
- —
- Eligible?
- —
Personal DTI + credit; lowest rate.
DSCR
20% down · 8.5% · 30yr
- Down + closing
- —
- Monthly P&I
- —
- Monthly cashflow
- —
- DSCR
- —
- Eligible?
- —
No personal income docs; deal must DSCR.
Hard money
10% down · 12.0% · 12mo
- Down + closing
- —
- Monthly P&I
- —
- Monthly cashflow
- —
- DSCR
- —
- Eligible?
- —
Short-term bridge; refi at stabilization.
Rent comps 2 comps
| Address | Beds | Baths | Sqft | Rent | $/sqft | DOM | Units | Dist |
|---|---|---|---|---|---|---|---|---|
| 2980 Burgaw Hwy Jacksonville, NC | 2.0 | 2.0 | 960 | $904 | $0.94 | 13d | 1 | 1.03mi |
| 2980 Burgaw Hwy Unit 22 Jacksonville, NC | 3.0 | 2.0 | 1056 | $1,200 | $1.14 | 21d | 1 | 1.04mi |
Listing history 35 events
-
2026-06-19days on market $174,000 Active 37 DOM
-
2026-06-18days on market $174,000 Active 36 DOM
-
2026-06-17price $174,000 Active 35 DOM
-
2026-06-17days on market $186,000 Active 35 DOM
-
2026-06-16days on market $186,000 Active 34 DOM
-
2026-06-15days on market $186,000 Active 33 DOM
-
2026-06-14days on market $186,000 Active 31 DOM
-
2026-06-13days on market $186,000 Active 30 DOM
-
2026-06-10days on market $186,000 Active 28 DOM
-
2026-06-09days on market $186,000 Active 27 DOM
-
2026-06-09days on market $186,000 Active 26 DOM
-
2026-06-07days on market $186,000 Active 25 DOM
-
2026-06-03days on market $186,000 Active 21 DOM
-
2026-06-02days on market $186,000 Active 20 DOM
-
2026-06-01days on market $186,000 Active 19 DOM
-
2026-05-31days on market $186,000 Active 18 DOM
-
2026-05-30days on market $186,000 Active 17 DOM
-
2026-05-13$186,000 Active
-
2025-01-01$190,000 Active
-
2024-12-12status Active
-
2024-12-10status Pending
-
2024-12-10historical
-
2024-11-18price $220,000
-
2024-10-17price $224,900
-
2024-09-26price $225,000
-
2024-09-05price $230,000
-
2024-08-22$235,000 Active
-
2022-01-05soldstatus $201,000
-
2022-01-05soldstatus $201,000
-
2021-10-17$205,000
-
2019-03-18soldstatus $128,250
-
2019-03-18soldstatus $128,500
-
2018-12-18$127,555
-
2009-09-01soldstatus $131,000
-
2001-06-05soldstatus $75,000
ⓘ Source: listings_history table (triggers on properties + properties_extension) + one-shot
backfill from property_details.listing_events for pre-trigger history.
Tax reassessment forecast NC · Resets to sale price
- Current annual tax
- $1,031 · $86/mo
- Projected year-2 tax
- $1,427 · $119/mo
- Expected delta
- +$396/yr (+$33/mo · 38.4%)
ⓘ Screening estimate from a state-policy table — verify with the county assessor before closing.
Climate risk First Street
- Flood 6/10 Major FEMA zone X (unshaded) · 74% chance over 30 yrs
- Wildfire 5/10 Major
- Heat 8/10 Severe 7 d/yr ≥106°F today · 18 d/yr by 30 yrs out
- Wind 8/10 Severe 98% chance of damaging wind over 30 yrs
- Air quality 3/10 Moderate 2 unhealthy d/yr today · 5 by 30 yrs out
Nearby sold comps map
Loading sold comps map…
Walkable amenities ~0.75 mi
Loading nearby amenities…
Taxation est. · year 1
- Rental income
- $16,211
- − Mortgage interest
- −$9,747
- − Property taxes
- −$1,031
- − Insurance
- −$870
- − Repairs & maintenance
- −$1,297
- − Management
- −$1,297
- − Depreciation
- −$5,062
- Taxable loss
- −$3,092
- Est. tax savings @ 24.0%
- +$742
- After-tax cash flow
- $698/yr
For passive investors: Depreciation is non-cash, so a rental often shows a tax loss while cash-flowing — sheltering income. Rental losses are passive: they offset passive income freely, and up to $25,000/yr can offset ordinary (W-2) income if you actively participate and your MAGI is under $100k (phasing out to $0 by $150k); unused losses carry forward. On sale, claimed depreciation is recaptured at up to 25%, and gains may owe capital-gains tax (a 1031 exchange can defer both). Figures are a year-1 estimate at your 24.0% rate — not tax advice; consult a CPA.
Schools (NCES district)
- District
- Onslow County Schools
- NCES district ID
- 3703450
- Math proficiency
- 42% ▲ 6.00%
- Reading proficiency
- 49% ▲ 5.00%
- Median HH income
- $46,076
- Composite
- 38.66/100
- National rank
- #4148
- State rank
- #84 of 178 in NC
Livability — Jacksonville
- Score
- 71/100
- State rank
- #111
- US rank
- #6991
Category grades
Schools grade is shown separately in the Schools card above.
Census & demographics
- County
- Onslow County · 164,453 people
- City population
- 96,397
- Metro
- Jacksonville, NC
- Population (ZIP)
- 49,141
- Household income
- $65,625
- Rent vs Own
- Severe rent burden
- 1304.0
Population outlook (Onslow County) Hauer SSP2
- Today (2025)
- 189,789 people
- By 2030
- 194,463 · +2.5%
- By 2040
- 193,629 · +2.0%
- By 2050
- 193,248 · +1.8%
- By 2075
- 196,995 · +3.8%
- By 2100
- 201,513 · +6.2%
Race, ethnicity, and origin ACS 2023
- Neighborhood character
- Diverse neighborhood (Simpson 0.58)
- Race & ethnicity
- White 62% Black 14% Hispanic / Latino 14% Two or more races 13% Asian 2%
- Hispanic origin (detail)
- Mexican 5% Puerto Rican 6%
- Common ancestry
- Italian 3% Serbian 2% Romanian 2%
- Foreign-born
- 4% · Canada, China
- Languages at home
- 90% English-only · Spanish 7% Chinese 1% Other Asian/Pacific 1%
Political lean MEDSL · Onslow
- 2024 margin
- Solid R (+35.9) · D 31.5% · R 67.5% · Other 1.0%
- 2008→2024 swing
- -14.5pp toward R · 2008: -21.5pp · 2024: -35.9pp
- All cycles
- 2024: R+35.9 2020: R+30.2 2016: R+34.6 2012: R+27.0 2008: R+21.5
Not yet ingested
- Civics
- —
Market trends
- HPI YoY
- ▼ -60.11%
- Current HPI
- 219.5571
- Rent YoY
- ▲ 4.47%
- Metro
- Jacksonville, NC
- State GDP YoY
- ▲ 3.28%
- F500 in state
- 26
Industry mix (Fortune 500 HQ in NC)
| Industry | F500 HQs | Revenue |
|---|---|---|
| Financial Services | 2 | $213B |
|
||
| Retail | 2 | $95B |
|
||
| Industrial Conglomerate | 1 | $38B |
|
||
| Metals / Steel | 1 | $35B |
|
||
| Utilities | 1 | $30B |
|
||
| Industrial Machinery | 1 | $19B |
|
||
Price history
+148.0% since first listed18 events — show timeline
- 2026-05-13 Listed $186,000 Hive MLS
- 2025-01-01 Listed $190,000 Hive MLS
- 2024-12-12 Relisted — Hive MLS
- 2024-12-10 Pending — Hive MLS
- 2024-12-10 Listing Removed — Hive MLS
- 2024-11-18 Price Changed $220,000 Hive MLS
- 2024-10-17 Price Changed $224,900 Hive MLS
- 2024-09-26 Price Changed $225,000 Hive MLS
- 2024-09-05 Price Changed $230,000 Hive MLS
- 2024-08-22 Listed $235,000 Hive MLS
- 2022-01-05 Sold (Public Records) $201,000 Public Records
- 2022-01-05 Sold (MLS) $201,000 Hive MLS
- 2021-10-17 Listed $205,000 Hive MLS
- 2019-03-18 Sold (Public Records) $128,500 Public Records
- 2019-03-18 Sold (MLS) $128,250 Hive MLS
- 2018-12-18 Listed $127,555 Hive MLS
- 2009-09-01 Sold (Public Records) $131,000 Public Records
- 2001-06-05 Sold (Public Records) $75,000 Public Records
Property tax history
+2.3%/yrLatest (2025): $1,031 · +0.0% YoY. Source: county tax records.
Cash-flow waterfall
monthlySold comps — $/sqft
last 12 mo · ≤1 miLoading sold comps…