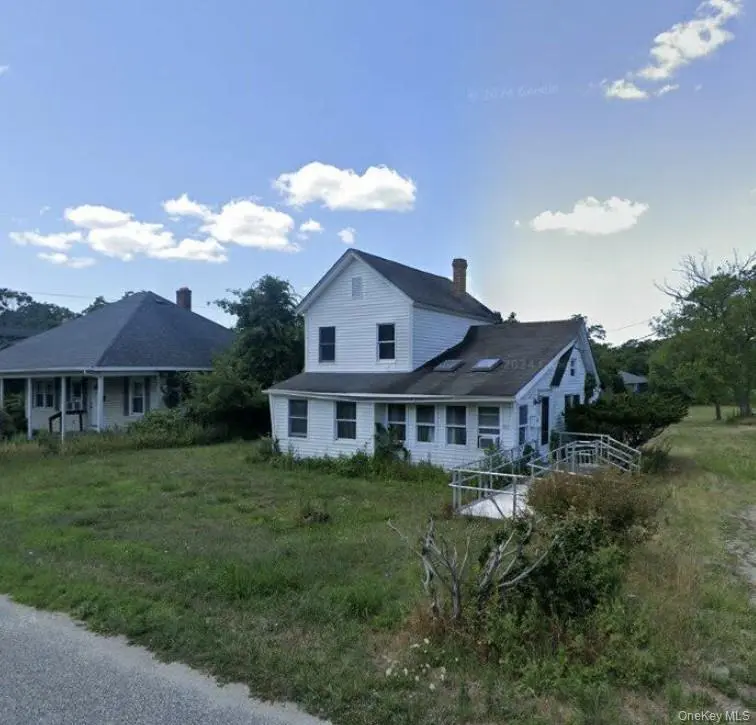
84 Chapel Ave · East Patchogue, NY
Flood risk 3/10 · Minor
- FEMA flood zone
- X (unshaded)
- Chance of flooding over 30 yrs
- 0.1%
- Est. flood insurance / yr
- $473 – $860
Fire risk 1/10 · Minimal
- Est. fire insurance / yr
- $691 – $1,283
Heat risk 4/10 · Minor
- Hot days now (above 92°F)
- 7 days/yr
- Hot days in 30 yrs
- 18 days/yr
Wind risk 8/10 · Major
- Chance of severe wind over 30 yrs
- 80.0%
Air-quality risk 3/10 · Minor
- Unhealthy air days now
- 3 days/yr
- Unhealthy air days in 30 yrs
- 4 days/yr
Risk factors via First Street. Map © Google.
Why this score? — see what drove the C- grade
The composite is a weighted blend of 9 inputs, each scored 0–100. Each bar is that input's sub-score; the figure is the points it added to the 100-point composite (weight × sub-score).
- Cash flow +15.3/30.0
- ARV discount +15.0/15.0
- Schools +6.7/10.0
- DSCR +4.7/10.0
- Rent growth +3.8/5.0
- 1% rule +3.3/10.0
- Livability +3.2/5.0
- Condition / age +2.5/5.0
- Appreciation +0.0/10.0
$399,900
🖨 Deal sheet 📄 Offer letter ✓ Due diligence
Listing remarks
Cash offers, Contract vendee, sold as is, occupied. Waterfront property with tremendous opportunity for builder, developer, investor or end user looking to put their touches on it. 3 Bed, 1 bath colonial, with partial basement.
Key facts
- 0.8 acre lot
- Built 1879
- Listed 8 days
Neighborhood map
What this means for you Summary
Snapshot
- This is a 3-bed/1.0-bath single-family listed at $400k.
Deal economics
- At list price, monthly cash flow is $147 ($2k/yr) — positive.
- The deal already cash-flows at list — no discount required.
- To meet the 1% rule (rent ≥ 1% of price), the offer needs to be $330k (17.4% below list).
- Recommended offer: $330k (17.4% below list) — sets the bar for 1% rule.
- Cap rate 6.7% vs local median 3.1% in East Patchogue — top-decile yield for the area; either an underpriced asset or a hidden risk that comps aren't pricing in. Stress-test before assuming the spread holds.
Location & tenants
- Location reads 64/100 on livability (#769 in NY) — a middle-class / working-renter tenant base. Strengths: employment A+, housing A+, health & safety B; Watch: schools D, amenities F, commute F.
- Patchogue-Medford Union Free School District (suburban): math 83% / reading 69% proficiency, ranked #73 of 590 in NY (top 12%) — strong family-tenant draw, lease renewals of 3-5y typical.
- Market conditions: Rents rising fast (+5.1%/yr); 216 active listings in the ZIP; 9 comparable units currently listed for rent nearby; rentals at typical pace (median 20d on market — plan ~3-4 weeks tenant-placement turnaround); solid renter incomes; 1,366 units permitted in Suffolk County in 2024 (216 in 5+ unit buildings).
- This rent runs 38% of the median local income ($105k/yr) — at the standard rent-burdened threshold; future hikes will face affordability resistance.
Forward outlook
- Local home prices are declining (-3.0%/yr); year-one equity from $3k of loan paydown is wiped out by about $12k of value loss. Plan a longer hold.
- Suffolk County population projected to shrink 5% by 2050 — rents likely to lag national; underwrite the cash flow, not the appreciation.
Negotiation context
- Only 8 days on market — expect competitive offers; lowballing is unlikely to land.
Risks & watch-outs
- Watch-outs: built in 1879 — expect roof / HVAC / electrical / plumbing capex.
- Climate carrying-cost: severe wind risk, 80% chance of damaging wind over 30y — expect insurance premiums to compound above CPI over the hold.
Questions for the listing agent
- Built in 1879 — when were the roof, HVAC, electrical panel, plumbing, and water heater last replaced?
- Is there a deadline driving the sale (1031 exchange, divorce, estate, relocation)? That informs how much negotiation room exists.
- Schools are D-rated, which usually means shorter tenancies and higher turnover. Who's the typical renter profile here, and what's been the actual vacancy rate?
- What's the average days-on-market for RENTAL listings here right now (not sales)? A rising rental-DOM trend means longer vacancies and softer asking-rent achievability than the comps imply.
- What's the recent tenant-quality profile in this submarket — average credit score on applications, eviction rate, late-payment / NSF rate, and stable-employment percentage? A property-management company in the area should have these aggregated.
- How much new for-sale + rental construction is in the pipeline within 1–3 miles? Heavy new supply typically softens prices + rents 12–24 months out; constrained supply supports both.
Investment metrics
- 1% rule
- 0.83% ✗
- Cap rate
- 6.73%
- Cash-on-cash
- 1.58%
- DSCR
- 1.07
- GRM
- 10.1
CMA / ARV
- ARV (on-the-fly)
- $532,440
- Comps found
- 1
Show comp detail 1 sale within ~0.75 mi
| Address | Dist | Beds/Ba | Sqft | Sold | Price | $/sf | Match |
|---|---|---|---|---|---|---|---|
| 72 Conklin Ave | 0.31mi | 2/1.0 (-1) | 754 (-1%) | 2mo | $525,000 | $696 | 76 |
Match score weights: distance 35% · size 25% · config 20% · recency 20%. Top-matched comps best support the ARV.
Projected returns pro-forma
-3.0% appreciation · 5.07% rent growth · sell at horizon
- IRR
- -11.8%
- Equity multiple
- 0.57×
- Total profit
- $-48,538
- Equity at exit
- $59,626
- IRR
- -0.1%
- Equity multiple
- 0.99×
- Total profit
- $-685
- Equity at exit
- $34,576
Cash invested: $111,972 (down + closing). Projections, not guarantees.
Landlord ↔ Tenant lean methodology
- Overall (STATE)
- 15 Strongly Tenant-Friendly
- State New York
- 15 Strongly Tenant-Friendly · D+10
- County
- — inherits STATE
- City
- — inherits STATE
ZIP-level market 11772
- Rents YoY
- 5.1%
- Active inventory
- 216
- Price-to-rent
- 10.1×
Monthly cashflow live
- Estimated rent
- $3,303 high interval (Pro) →
- Mortgage (P&I)
- −$2,097
- Tax from tax record
- −$198 /mo · $2,377/yr
- Insurance
- −$167
- HOA
- −$0
- Vacancy / Maint / Mgmt
- −$694
- Net cashflow
- $147
Break-even live
UW: 25.0% down · 7.5% · 30yr · 1.5% tax · 5.0% vac · 8.0% maint · 8.0% mgmt
Financing live
Cash to close
- Down payment
- $99,975
- Closing costs
- $11,997
- Reserves months
- —
- Total cash needed
- —
Loan-product check · same deal, 3 products live
Conventional
25% down · 7.5% · 30yr
- Down + closing
- —
- Monthly P&I
- —
- Monthly cashflow
- —
- DSCR
- —
- Eligible?
- —
Personal DTI + credit; lowest rate.
DSCR
20% down · 8.5% · 30yr
- Down + closing
- —
- Monthly P&I
- —
- Monthly cashflow
- —
- DSCR
- —
- Eligible?
- —
No personal income docs; deal must DSCR.
Hard money
10% down · 12.0% · 12mo
- Down + closing
- —
- Monthly P&I
- —
- Monthly cashflow
- —
- DSCR
- —
- Eligible?
- —
Short-term bridge; refi at stabilization.
Rent comps 9 comps
| Address | Beds | Baths | Sqft | Rent | $/sqft | DOM | Units | Dist |
|---|---|---|---|---|---|---|---|---|
| 39 Laurel St Patchogue, NY | 3.0 | 2.0 | 1100 | $3,400 | $3.09 | 24d | 1 | 1.11mi |
| 1 Village Green Way Patchogue, NY | 1.0–2.0 | 1.0–2.0 | 947 | $3,974 | $4.19 | 1d | 7 | 1.27mi |
| 80 Division St Unit 2B Patchogue, NY | 2.0 | 2.0 | 1100 | $3,500 | $3.18 | 43d | 1 | 1.28mi |
| 80 Division St Patchogue, NY | 2.0 | 1.0 | 1000 | $3,100 | $3.10 | 24d | 1 | 1.28mi |
| 22 Jennings Ave Unit B Patchogue, NY | 2.0 | 1.0 | 919 | $3,000 | $3.26 | 1d | 1 | 1.31mi |
| 309 Robinson Ave Unit 6 Patchogue, NY | 2.0 | 1.0 | 928 | $2,750 | $2.96 | 43d | 1 | 1.35mi |
| 301 Robinson Ave East Patchogue, NY | 1.0–2.0 | 1.0 | 785 | $2,850 | $3.63 | 19d | 1 | 1.37mi |
| 34 Union Ave Patchogue, NY | 2.0 | 1.0 | 1000 | $3,000 | $3.00 | 5d | 1 | 1.38mi |
| 9 Pondview Dr East Patchogue, NY | 1.0–2.0 | 1.0 | 864 | $3,033 | $3.51 | 1d | 18 | 1.39mi |
Listing history 2 events
-
2026-04-09status Pending
-
2026-04-01$399,900 Active
ⓘ Source: listings_history table (triggers on properties + properties_extension) + one-shot
backfill from property_details.listing_events for pre-trigger history.
Tax reassessment forecast NY · Partial reset (capped growth)
- Current annual tax
- $2,377 · $198/mo
- Projected year-2 tax
- $4,568 · $381/mo
- Expected delta
- +$2,191/yr (+$183/mo · 92.1%)
ⓘ Screening estimate from a state-policy table — verify with the county assessor before closing.
Climate risk First Street
- Flood 3/10 Moderate FEMA zone X (unshaded) · 10% chance over 30 yrs
- Wildfire 1/10 Low
- Heat 4/10 Moderate 7 d/yr ≥92°F today · 18 d/yr by 30 yrs out
- Wind 8/10 Severe 80% chance of damaging wind over 30 yrs
- Air quality 3/10 Moderate 3 unhealthy d/yr today · 4 by 30 yrs out
Nearby sold comps map
Loading sold comps map…
Walkable amenities ~0.75 mi
Loading nearby amenities…
Taxation est. · year 1
- Rental income
- $39,632
- − Mortgage interest
- −$22,401
- − Property taxes
- −$2,377
- − Insurance
- −$2,000
- − Repairs & maintenance
- −$3,171
- − Management
- −$3,171
- − Depreciation
- −$11,633
- Taxable loss
- −$5,120
- Est. tax savings @ 24.0%
- +$1,229
- After-tax cash flow
- $2,996/yr
For passive investors: Depreciation is non-cash, so a rental often shows a tax loss while cash-flowing — sheltering income. Rental losses are passive: they offset passive income freely, and up to $25,000/yr can offset ordinary (W-2) income if you actively participate and your MAGI is under $100k (phasing out to $0 by $150k); unused losses carry forward. On sale, claimed depreciation is recaptured at up to 25%, and gains may owe capital-gains tax (a 1031 exchange can defer both). Figures are a year-1 estimate at your 24.0% rate — not tax advice; consult a CPA.
Schools (NCES district)
- District
- Patchogue-Medford Union Free School District
- NCES district ID
- 3622470
- Math proficiency
- 83% ▲ 27.00%
- Reading proficiency
- 69% ▲ 15.00%
- Median HH income
- $75,120
- Composite
- 66.81/100
- National rank
- #405
- State rank
- #73 of 590 in NY
Livability — East Patchogue
- Score
- 64/100
- State rank
- #769
- US rank
- #14732
Category grades
Schools grade is shown separately in the Schools card above.
Census & demographics
- Census place
- East Patchogue, NY
- County
- Suffolk County · 679,920 people
- City population
- 45,006
- Metro
- New York-Newark-Jersey City, NY-NJ-PA
- Population (ZIP)
- 45,023
- Household income
- $105,245
- Rent vs Own
- Severe rent burden
- 1595.0
Population outlook (Suffolk County) Hauer SSP2
- Today (2025)
- 1,505,262 people
- By 2030
- 1,498,318 · -0.5%
- By 2040
- 1,471,101 · -2.3%
- By 2050
- 1,424,848 · -5.3%
- By 2075
- 1,337,157 · -11.2%
- By 2100
- 1,217,720 · -19.1%
Race, ethnicity, and origin ACS 2023
- Neighborhood character
- Predominantly White (66%)
- Race & ethnicity
- White 66% Hispanic / Latino 24% Two or more races 8% Black 4% Asian 3%
- Hispanic origin (detail)
- Mexican 1% Puerto Rican 5% Dominican 2%
- Common ancestry
- Romanian 4% Lithuanian 2% Scotch-Irish 2%
- Foreign-born
- 15% · Canada, Jamaica, China
- Languages at home
- 78% English-only · Spanish 15% Other Asian/Pacific 2% Other Indo-European 1%
Political lean MEDSL · Suffolk
- 2024 margin
- Lean R (+10.0) · D 45.0% · R 55.0%
- 2008→2024 swing
- -16.0pp toward R · 2008: 6.0pp · 2024: -10.0pp
- All cycles
- 2024: R+10.0 2020: R+0.0 2016: R+8.2 2012: D+2.9 2008: D+6.0
Not yet ingested
- Civics
- —
Market trends
- HPI YoY
- ▼ -578.02%
- Current HPI
- 375.1174
- Rent YoY
- ▲ 5.07%
- Metro
- New York-Newark-Jersey City, NY-NJ-PA
- State GDP YoY
- ▲ 2.60%
- F500 in state
- 92
Industry mix (Fortune 500 HQ in NY)
| Industry | F500 HQs | Revenue |
|---|---|---|
| Financial Services | 10 | $950B |
|
||
| Consumer Goods | 9 | $162B |
|
||
| Insurance | 4 | $225B |
|
||
| Telecommunications | 2 | $144B |
|
||
| Pharmaceuticals | 2 | $112B |
|
||
| Media / Entertainment | 2 | $69B |
|
||
Price history
2 events — show timeline
- 2026-04-09 Pending — OneKey® MLS as Distributed by MLS Grid
- 2026-04-01 Listed $399,900 OneKey® MLS as Distributed by MLS Grid
Property tax history
+3.1%/yrLatest (2025): $2,377 · +0.0% YoY. Source: county tax records.
Cash-flow waterfall
monthlySold comps — $/sqft
last 12 mo · ≤1 miLoading sold comps…