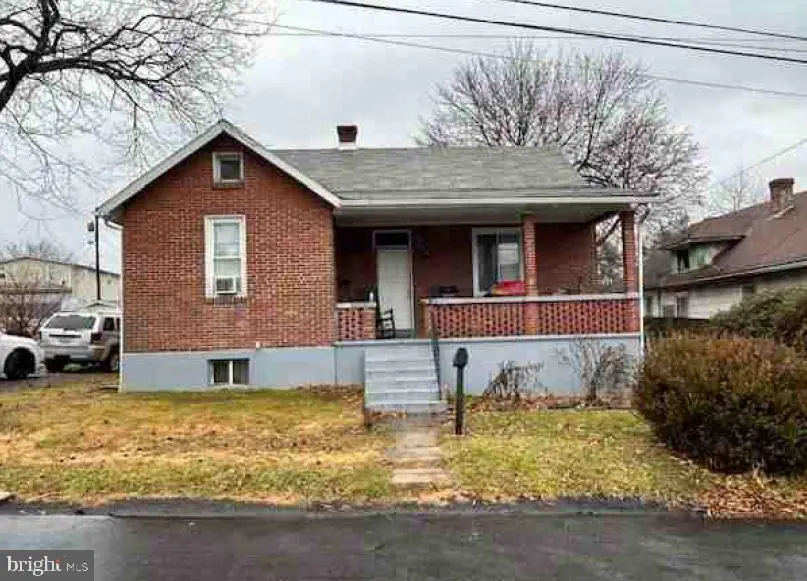
534 Eastern Ave · Cumberland, MD
Flood risk 1/10 · Minimal
- FEMA flood zone
- X (unshaded)
- Chance of flooding over 30 yrs
- 0.0%
- Est. flood insurance / yr
- $473 – $860
Fire risk 3/10 · Minor
- Est. fire insurance / yr
- $755 – $1,403
Heat risk 5/10 · Moderate
- Hot days now (above 101°F)
- 7 days/yr
- Hot days in 30 yrs
- 17 days/yr
Wind risk 2/10 · Minimal
- Chance of severe wind over 30 yrs
- —
Air-quality risk 2/10 · Minimal
- Unhealthy air days now
- 0 days/yr
- Unhealthy air days in 30 yrs
- 1 days/yr
Risk factors via First Street. Map © Google.
Why this score? — see what drove the C+ grade
The composite is a weighted blend of 9 inputs, each scored 0–100. Each bar is that input's sub-score; the figure is the points it added to the 100-point composite (weight × sub-score).
- Cash flow +26.6/30.0
- DSCR +9.1/10.0
- ARV discount +7.5/15.0
- 1% rule +6.5/10.0
- Rent growth +5.0/5.0
- Livability +3.9/5.0
- Condition / age +2.5/5.0
- Schools +1.9/10.0
- Appreciation +0.0/10.0
$105,900
🖨 Deal sheet 📄 Offer letter ✓ Due diligence
Listing remarks MLS
Great Opportunity to own this single-family home oozing with potential. This home was built in 1948 and features 3 bedrooms and 2 bathrooms, with plenty of living space. OCCUPIED, NO access. * * * SPECIAL NOTES: (1) This is a CASH ONLY transaction. (2) Seller to pay Taxes, HOA, and Municipal/Utility Liens. (3) Please read the Auction disclaimers carefully before placing a bid or submitting an offer. * * *
Key facts
- 9,600 sq ft lot
- Built 1948
- Listed 703 days
Neighborhood map
What this means for you Summary
Snapshot
- This is a 3-bed/2.0-bath single-family listed at $106k.
Deal economics
- At list price, monthly cash flow is $282 ($3k/yr) — positive.
- The deal already cash-flows at list — no discount required.
- Meets the 1% rule at list price ($1k rent vs $106k).
- Recommended offer: $93k (12.0% below list) — sets the bar for market timing.
- Cap rate 9.5% vs local median 6.7% in Cumberland — top-decile yield for the area; either an underpriced asset or a hidden risk that comps aren't pricing in. Stress-test before assuming the spread holds.
Location & tenants
- Location reads 78/100 on livability (#64 in MD, #2,385 nationally) — a middle-class / working-renter tenant base. Strengths: amenities A+, commute A+, cost of living A+; Watch: schools D+, crime F, employment F.
- Allegany County Public Schools (other): math 15% / reading 30% proficiency, ranked #18 of 24 in MD (top 75%) — low school quality limits family demand, transient renter base, plan for 1-2y turnover.
- Market conditions: Rents rising fast (+10.9%/yr); 235 active listings in the ZIP; 8 comparable units currently listed for rent nearby; rentals lingering (median 44d on market — plan ~5-8 weeks vacancy on turnover, expect pricing pressure); 100% of comp listings sitting > 30 days — soft ceiling on asking rent; 24 units permitted in Allegany County in 2024 (0 in 5+ unit buildings).
Forward outlook
- Local home prices are declining (-3.0%/yr); year-one equity from $732 of loan paydown is wiped out by about $3k of value loss. Plan a longer hold.
- Allegany County population projected at -14% by 2050 — secular population decline; favor cash flow + early exit over multi-decade hold.
- At projected returns (-3.0% appreciation + 8.0% rent growth), your $30k cash investment doubles in ~7 years — after that, you're playing with house money.
Negotiation context
- It's been on market 704 days — a 12% lower offer ($93k) is reasonable based on typical stale-listing flexibility.
- 5 sale attempts since 21y ago; this cycle's ask has dropped $23k (18%) from the opening price — seller is motivated, your offer sets the floor, not the list.
Risks & watch-outs
- Watch-outs: built in 1948 — expect roof / HVAC / electrical / plumbing capex.
- Climate carrying-cost: extreme-heat days projected 7→17/yr by 2055 (HVAC capex compounding) — expect insurance premiums to compound above CPI over the hold.
Questions for the listing agent
- It's been on market 704 days. Have you received any prior offers? Is the seller open to a 12% concession, seller financing, or rate buy-down credit?
- Built in 1948 — when were the roof, HVAC, electrical panel, plumbing, and water heater last replaced?
- Why hasn't it sold? Are there any deal-killer items the seller is aware of (foundation, flood, title, zoning, code violations)?
- Is there a deadline driving the sale (1031 exchange, divorce, estate, relocation)? That informs how much negotiation room exists.
- Schools are D-rated, which usually means shorter tenancies and higher turnover. Who's the typical renter profile here, and what's been the actual vacancy rate?
- Crime grade is F in this area — have there been break-ins, vandalism, or insurance claims at this property in the last 3 years? What carrier currently insures it and at what premium?
- What's the average days-on-market for RENTAL listings here right now (not sales)? A rising rental-DOM trend means longer vacancies and softer asking-rent achievability than the comps imply.
- What's the recent tenant-quality profile in this submarket — average credit score on applications, eviction rate, late-payment / NSF rate, and stable-employment percentage? A property-management company in the area should have these aggregated.
- How much new for-sale + rental construction is in the pipeline within 1–3 miles? Heavy new supply typically softens prices + rents 12–24 months out; constrained supply supports both.
Investment metrics
- 1% rule
- 1.15% ✓
- Cap rate
- 9.49%
- Cash-on-cash
- 11.43%
- DSCR
- 1.51
- GRM
- 7.2
CMA / ARV
- ARV (median comp)
- $67,369
- List price
- $105,900
- Delta
- 57.19%
- Verdict
- OVERPRICED
- Comps
- 20 within 1.0 mi
Show comp detail 11 sales within ~0.75 mi
| Address | Dist | Beds/Ba | Sqft | Sold | Price | $/sf | Match |
|---|---|---|---|---|---|---|---|
| 451 Baltimore Ave | 0.25mi | 3/1.0 | 1,044 (+3%) | 10mo | $60,000 | $57 | 71 |
| 317 E Reynolds St | 0.12mi | 2/1.0 (-1) | 1,074 (+6%) | 8mo | $65,000 | $61 | 69 |
| 472 Williams St | 0.65mi | 3/1.5 | 1,013 (-0%) | 1mo | $144,500 | $143 | 66 |
| 422 Pine Ave | 0.21mi | 3/1.0 | 1,150 (+13%) | 10mo | $82,000 | $71 | 56 |
| 618 Bedford St | 0.66mi | 3/1.0 | 1,044 (+3%) | 10mo | $130,000 | $125 | 52 |
| 346 Williams St | 0.63mi | 3/1.0 | 1,092 (+8%) | 4mo | $45,000 | $41 | 51 |
| 216 Frost Ave | 0.39mi | 4/1.0 (+1) | 1,113 (+10%) | 14mo | $74,900 | $67 | 45 |
| 406 Warwick Ave | 0.72mi | 2/2.0 (-1) | 1,023 (+1%) | 21mo | $107,300 | $105 | 43 |
| 812 Shades Ln | 0.47mi | 3/1.5 | 1,152 (+13%) | 14mo | $120,500 | $105 | 42 |
| 461 S Central Ave | 0.19mi | 2/1.0 (-1) | 864 (-15%) | 21mo | $25,000 | $29 | 40 |
| 906 Bedford St | 0.73mi | 3/1.0 | 1,110 (+9%) | 14mo | $55,000 | $50 | 34 |
Match score weights: distance 35% · size 25% · config 20% · recency 20%. Top-matched comps best support the ARV.
Projected returns pro-forma
-3.0% appreciation · 8.0% rent growth · sell at horizon
- IRR
- 6.0%
- Equity multiple
- 1.24×
- Total profit
- $7,253
- Equity at exit
- $15,790
- IRR
- 19.3%
- Equity multiple
- 2.98×
- Total profit
- $58,734
- Equity at exit
- $9,156
Cash invested: $29,652 (down + closing). Projections, not guarantees.
Landlord ↔ Tenant lean methodology
- Overall (STATE)
- 27 Tenant-Leaning
- State Maryland
- 27 Tenant-Leaning · D+14
- County
- — inherits STATE
- City
- — inherits STATE
ZIP-level market 21502
- Home prices YoY
- -17.4%
- Rents YoY
- 10.9%
- Active inventory
- 235
- Price-to-rent
- 7.2×
Monthly cashflow live
- Estimated rent
- $1,219 high interval (Pro) →
- Mortgage (P&I)
- −$555
- Tax from tax record
- −$81 /mo · $969/yr
- Insurance
- −$44
- HOA
- −$0
- Vacancy / Maint / Mgmt
- −$256
- Net cashflow
- $282
Break-even live
UW: 25.0% down · 7.5% · 30yr · 1.5% tax · 5.0% vac · 8.0% maint · 8.0% mgmt
Financing live
Cash to close
- Down payment
- $26,475
- Closing costs
- $3,177
- Reserves months
- —
- Total cash needed
- —
Loan-product check · same deal, 3 products live
Conventional
25% down · 7.5% · 30yr
- Down + closing
- —
- Monthly P&I
- —
- Monthly cashflow
- —
- DSCR
- —
- Eligible?
- —
Personal DTI + credit; lowest rate.
DSCR
20% down · 8.5% · 30yr
- Down + closing
- —
- Monthly P&I
- —
- Monthly cashflow
- —
- DSCR
- —
- Eligible?
- —
No personal income docs; deal must DSCR.
Hard money
10% down · 12.0% · 12mo
- Down + closing
- —
- Monthly P&I
- —
- Monthly cashflow
- —
- DSCR
- —
- Eligible?
- —
Short-term bridge; refi at stabilization.
Rent comps 8 comps
| Address | Beds | Baths | Sqft | Rent | $/sqft | DOM | Units | Dist |
|---|---|---|---|---|---|---|---|---|
| 516 Bedford St Cumberland, MD | 3.0 | 1.5 | 1500 | $1,195 | $0.80 | 43d | 1 | 0.64mi |
| 201 Spring St Cumberland, MD | 3.0 | 1.0 | 1332 | $950 | $0.71 | 43d | 1 | 0.70mi |
| 118 Independence St Cumberland, MD | 3.0 | 1.5 | 1260 | $1,250 | $0.99 | 44d | 1 | 0.71mi |
| 418 N Mechanic St Unit 1C Cumberland, MD | 3.0 | 1.0 | 1500 | $1,295 | $0.86 | 43d | 1 | 1.05mi |
| 418 N Mechanic St Unit 1B Cumberland, MD | 2.0 | 1.0 | 1000 | $1,195 | $1.20 | 43d | 1 | 1.05mi |
| 423 Furnace St Cumberland, MD | 3.0 | 1.5 | 1440 | $1,250 | $0.87 | 43d | 1 | 1.05mi |
| 529 N Centre St Unit Rear Cumberland, MD | 2.0 | 1.0 | 982 | $850 | $0.87 | 43d | 1 | 1.16mi |
| 131 Grand Ave Cumberland, MD | 3.0 | 2.0 | 1444 | $1,300 | $0.90 | 43d | 1 | 1.44mi |
Listing history 32 events
-
2026-06-19days on market $105,900 Active 704 DOM
-
2026-06-18days on market $105,900 Active 703 DOM
-
2026-06-17days on market $105,900 Active 702 DOM
-
2026-06-16days on market $105,900 Active 701 DOM
-
2026-06-15days on market $105,900 Active 700 DOM
-
2026-06-14days on market $105,900 Active 698 DOM
-
2026-06-12days on market $105,900 Active 697 DOM
-
2026-06-09days on market $105,900 Active 694 DOM
-
2026-06-08days on market $105,900 Active 693 DOM
-
2026-06-07days on market $105,900 Active 692 DOM
-
2026-06-02days on market $105,900 Active 687 DOM
-
2026-06-01days on market $105,900 Active 686 DOM
-
2026-05-31days on market $105,900 Active 685 DOM
-
2026-05-30days on market $105,900 Active 684 DOM
-
2025-04-01price $105,900 412-char remark
Show marketing remark (412 chars)
Great Opportunity to own this single-family home oozing with potential. This home was built in 1948 and features 3 bedrooms and 2 bathrooms, with plenty of living space. OCCUPIED, NO access. * * * SPECIAL NOTES: (1) This is a CASH ONLY transaction. (2) Seller to pay Taxes, HOA, and Municipal/Utility Liens. (3) Please read the Auction disclaimers carefully before placing a bid or submitting an offer. * * *
-
2024-07-15$129,000 Active 412-char remark
Show marketing remark (412 chars)
Great Opportunity to own this single-family home oozing with potential. This home was built in 1948 and features 3 bedrooms and 2 bathrooms, with plenty of living space. OCCUPIED, NO access. * * * SPECIAL NOTES: (1) This is a CASH ONLY transaction. (2) Seller to pay Taxes, HOA, and Municipal/Utility Liens. (3) Please read the Auction disclaimers carefully before placing a bid or submitting an offer. * * *
-
2021-04-16soldstatus $108,500
-
2021-04-07soldstatus $108,500 Closed 353-char remark
Show marketing remark (353 chars)
Solid brick home located in a very quite neighborhood. This home features 3 bedrooms, 2 baths and also has room to grow, with a partially finished basement area. The galley kitchen is combined with dinning area, as the whole main level and upstairs have been remodeled. This huge lot contains a driveway and large fenced in yard. Set up a Showing today!
-
2021-03-29status Pending 353-char remark
Show marketing remark (353 chars)
Solid brick home located in a very quite neighborhood. This home features 3 bedrooms, 2 baths and also has room to grow, with a partially finished basement area. The galley kitchen is combined with dinning area, as the whole main level and upstairs have been remodeled. This huge lot contains a driveway and large fenced in yard. Set up a Showing today!
-
2021-02-26historical Active Under Contract 353-char remark
Show marketing remark (353 chars)
Solid brick home located in a very quite neighborhood. This home features 3 bedrooms, 2 baths and also has room to grow, with a partially finished basement area. The galley kitchen is combined with dinning area, as the whole main level and upstairs have been remodeled. This huge lot contains a driveway and large fenced in yard. Set up a Showing today!
-
2021-02-23price $109,900 353-char remark
Show marketing remark (353 chars)
Solid brick home located in a very quite neighborhood. This home features 3 bedrooms, 2 baths and also has room to grow, with a partially finished basement area. The galley kitchen is combined with dinning area, as the whole main level and upstairs have been remodeled. This huge lot contains a driveway and large fenced in yard. Set up a Showing today!
-
2021-01-26price $114,900 353-char remark
Show marketing remark (353 chars)
Solid brick home located in a very quite neighborhood. This home features 3 bedrooms, 2 baths and also has room to grow, with a partially finished basement area. The galley kitchen is combined with dinning area, as the whole main level and upstairs have been remodeled. This huge lot contains a driveway and large fenced in yard. Set up a Showing today!
-
2021-01-13$121,000 Active 353-char remark
Show marketing remark (353 chars)
Solid brick home located in a very quite neighborhood. This home features 3 bedrooms, 2 baths and also has room to grow, with a partially finished basement area. The galley kitchen is combined with dinning area, as the whole main level and upstairs have been remodeled. This huge lot contains a driveway and large fenced in yard. Set up a Showing today!
-
2018-01-19historical Withdrawn
-
2018-01-19historical
-
2017-11-07Active
-
2017-11-07$78,000
-
2005-06-03soldstatus $78,000
-
2005-05-31soldstatus $78,000
-
2005-04-22$83,564
-
2005-04-22historical
-
1995-11-17soldstatus $52,500
ⓘ Source: listings_history table (triggers on properties + properties_extension) + one-shot
backfill from property_details.listing_events for pre-trigger history.
Tax reassessment forecast MD · Partial reset (capped growth)
- Current annual tax
- $969 · $81/mo
- Projected year-2 tax
- $1,062 · $88/mo
- Expected delta
- +$92/yr (+$8/mo · 9.5%)
ⓘ Screening estimate from a state-policy table — verify with the county assessor before closing.
Climate risk First Street
- Flood 1/10 Low FEMA zone X (unshaded) · 0% chance over 30 yrs
- Wildfire 3/10 Moderate
- Heat 5/10 Major 7 d/yr ≥101°F today · 17 d/yr by 30 yrs out
- Wind 2/10 Low
- Air quality 2/10 Low 0 unhealthy d/yr today · 1 by 30 yrs out
Nearby sold comps map
Loading sold comps map…
Walkable amenities ~0.75 mi
Loading nearby amenities…
Taxation est. · year 1
- Rental income
- $14,623
- − Mortgage interest
- −$5,932
- − Property taxes
- −$969
- − Insurance
- −$530
- − Repairs & maintenance
- −$1,170
- − Management
- −$1,170
- − Depreciation
- −$3,081
- Taxable income
- $1,772
- Est. tax owed @ 24.0%
- −$425
- After-tax cash flow
- $2,964/yr
For passive investors: Depreciation is non-cash, so a rental often shows a tax loss while cash-flowing — sheltering income. Rental losses are passive: they offset passive income freely, and up to $25,000/yr can offset ordinary (W-2) income if you actively participate and your MAGI is under $100k (phasing out to $0 by $150k); unused losses carry forward. On sale, claimed depreciation is recaptured at up to 25%, and gains may owe capital-gains tax (a 1031 exchange can defer both). Figures are a year-1 estimate at your 24.0% rate — not tax advice; consult a CPA.
Schools (NCES district)
- District
- Allegany County Public Schools
- NCES district ID
- 2400030
- Math proficiency
- 15% ▼ -26.00%
- Reading proficiency
- 30% ▼ -20.00%
- Median HH income
- $39,760
- Composite
- 18.95/100
- National rank
- #8854
- State rank
- #18 of 24 in MD
Livability — Cumberland
- Score
- 78/100
- State rank
- #64
- US rank
- #2385
Category grades
Schools grade is shown separately in the Schools card above.
Census & demographics
- Census place
- Cumberland, MD
- County
- Allegany County · 41,015 people
- City population
- 41,015
- Metro
- Cumberland, MD-WV
- Population (ZIP)
- 41,015
- Household income
- $60,725
- Rent vs Own
- Severe rent burden
- 824.0
Population outlook (Allegany County) Hauer SSP2
- Today (2025)
- 68,778 people
- By 2030
- 66,766 · -2.9%
- By 2040
- 62,784 · -8.7%
- By 2050
- 59,179 · -14.0%
- By 2075
- 50,732 · -26.2%
- By 2100
- 40,837 · -40.6%
Race, ethnicity, and origin ACS 2023
- Neighborhood character
- Predominantly White (83%)
- Race & ethnicity
- White 83% Black 9% Two or more races 5% Hispanic / Latino 2%
- Common ancestry
- Slovak 3% Romanian 2% Italian 1%
- Foreign-born
- 2% · Canada
- Languages at home
- 96% English-only · Spanish 2%
Political lean MEDSL · Allegany
- 2024 margin
- Solid R (+40.3) · D 28.9% · R 69.2% · Other 2.0%
- 2008→2024 swing
- -14.4pp toward R · 2008: -25.9pp · 2024: -40.3pp
- All cycles
- 2024: R+40.3 2020: R+38.3 2016: R+48.0 2012: R+32.9 2008: R+25.9
Not yet ingested
- Civics
- —
Market trends
- HPI YoY
- ▼ -54.33%
- Current HPI
- 258.6676
- Rent YoY
- ▲ 10.88%
- Metro
- Cumberland, MD-WV
- State GDP YoY
- ▲ 2.97%
- F500 in state
- 12
Industry mix (Fortune 500 HQ in MD)
| Industry | F500 HQs | Revenue |
|---|---|---|
| Aerospace / Defense | 1 | $71B |
|
||
| Utilities | 1 | $25B |
|
||
| Hotels | 1 | $24B |
|
||
| Consumer Goods | 1 | $7B |
|
||
| Real Estate | 1 | $6B |
|
||
| Chemicals | 1 | $2B |
|
||
Price history
+101.7% since first listed18 events — show timeline
- 2025-04-01 Price Changed $105,900 BRIGHT MLS
- 2024-07-15 Listed $129,000 BRIGHT MLS
- 2021-04-16 Sold (Public Records) $108,500 Public Records
- 2021-04-07 Sold (MLS) $108,500 BRIGHT MLS
- 2021-03-29 Pending — BRIGHT MLS
- 2021-02-26 Contingent — BRIGHT MLS
- 2021-02-23 Price Changed $109,900 BRIGHT MLS
- 2021-01-26 Price Changed $114,900 BRIGHT MLS
- 2021-01-13 Listed $121,000 BRIGHT MLS
- 2018-01-19 Listing Removed — BRIGHT MLS
- 2018-01-19 Delisted — MRIS
- 2017-11-07 Listed — MRIS
- 2017-11-07 Listed $78,000 BRIGHT MLS
- 2005-06-03 Sold (Public Records) $78,000 Public Records
- 2005-05-31 Sold (MLS) $78,000 MRIS
- 2005-04-22 Delisted — MRIS
- 2005-04-22 Listed $83,564 MRIS
- 1995-11-17 Sold (Public Records) $52,500 Public Records
Property tax history
+1.6%/yrLatest (2025): $969 · -0.2% YoY. Source: county tax records.
Cash-flow waterfall
monthlySold comps — $/sqft
last 12 mo · ≤1 miLoading sold comps…