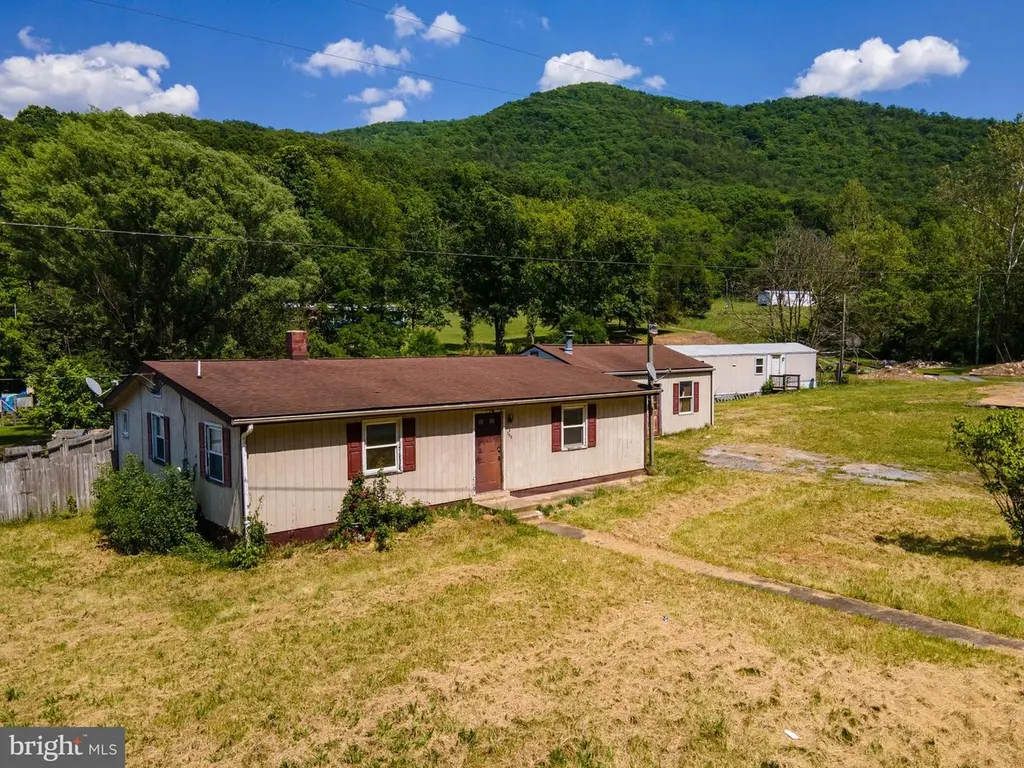
753 Steam Hollow Rd · Shenandoah, VA
Flood risk 8/10 · Major
- FEMA flood zone
- X (unshaded)
- Chance of flooding over 30 yrs
- 0.99%
- Est. flood insurance / yr
- $507 – $1,088
Fire risk 4/10 · Minor
- Est. fire insurance / yr
- $666 – $1,236
Heat risk 4/10 · Minor
- Hot days now (above 95°F)
- 8 days/yr
- Hot days in 30 yrs
- 20 days/yr
Wind risk 2/10 · Minimal
- Chance of severe wind over 30 yrs
- 1.0%
Air-quality risk 1/10 · Minimal
- Unhealthy air days now
- 0 days/yr
- Unhealthy air days in 30 yrs
- 0 days/yr
Risk factors via First Street. Map © Google.
Why this score? — see what drove the C- grade
The composite is a weighted blend of 9 inputs, each scored 0–100. Each bar is that input's sub-score; the figure is the points it added to the 100-point composite (weight × sub-score).
- Cash flow +22.6/30.0
- ARV discount +7.5/15.0
- DSCR +7.3/10.0
- 1% rule +4.8/10.0
- Schools +4.4/10.0
- Livability +3.4/5.0
- Rent growth +2.5/5.0
- Condition / age +2.5/5.0
- Appreciation +0.0/10.0
$178,000
🖨 Deal sheet (PDF) 📄 Offer letter ✓ Due diligence
Listing remarks
Multi Unit Property in Steam Hollow! This property consists of a 2 BR 1 BA house, a 3 BR 1.5 BA singlewide trailer and a 1 car detached garage! The potential is in place for this property to be income producing! All structures are in need of repair in order to be livable. The property is situated at the end of a state maintained road allowing for convenient access with privacy. This property is being sold strictly in "as-is" condition.
Key facts
- Privacy
- Convenient access
- Multi unit property
Tags
Property features AI
Exterior
- Parking: Detached garage with side entry (1-car)
- Utilities: Electric hot water; Septic system; Well water
- Home design: Detached structure; Year built estimated; Fee simple ownership
- Construction: Wood siding exterior; Block foundation
- Exterior features: Tidal water not present; Other structures above and below grade
Interior
- Bedrooms: Two bedrooms on the main level
- Bathrooms: One full bathroom (main level)
- Interior features: No basement; Finished above-grade living area (per assessor)
Neighborhood map
What this means for you Summary
Snapshot
- This is a 2-bed/1.0-bath single-family listed at $178k.
Deal economics
- At list price, monthly cash flow is $238 ($3k/yr) — positive.
- The deal already cash-flows at list — no discount required.
- To meet the 1% rule (rent ≥ 1% of price), the offer needs to be $174k (2.0% below list).
- Recommended offer: $173k (3.0% below list) — sets the bar for market timing.
- Cap rate 8.3% vs local median 3.6% in Shenandoah — top-decile yield for the area; either an underpriced asset or a hidden risk that comps aren't pricing in. Stress-test before assuming the spread holds.
Location & tenants
- Location reads 67/100 on livability (#304 in VA) — a middle-class / working-renter tenant base. Strengths: crime A+, cost of living A+, housing A+; Watch: amenities F, commute F, health & safety D-.
- Page County Public School District (rural): math 42% / reading 62% proficiency, ranked #96 of 131 in VA (top 73%) — acceptable for families but not a draw, mixed tenant base, ~2y average lease.
- Zoned schools: Shenandoah Elementary (math 42% / reading 62%, grade C-, #696 of 1,108 statewide, top 66%, 315 students, 81% FRL); Page County Middle (math 36% / reading 60%, grade C-, #247 of 342 statewide, top 74%, 352 students, 70% FRL); Page County High (math 67% / reading 67%, grade B, #185 of 319 statewide, top 61%, 495 students, 70% FRL) — zoned schools average 73% FRL vs 45% district-wide (29 pts higher); higher-poverty schools than district average — tighter screening recommended.
- Market conditions: 43 active listings in the ZIP; 164 units permitted in Page County in 2024 (0 in 5+ unit buildings).
Forward outlook
- Local home prices are declining (-3.0%/yr); year-one equity from $1k of loan paydown is wiped out by about $5k of value loss. Plan a longer hold.
- Page County population projected at -19% by 2050 — secular population decline; favor cash flow + early exit over multi-decade hold.
Negotiation context
- It's been on market 31 days — a 3% lower offer ($173k) is reasonable based on typical stale-listing flexibility.
- Current owner paid $60k; list at $178k implies a 197% gain — meaningful room to come down on a strong offer.
Risks & watch-outs
- Watch-outs: flood insurance adds $66/mo.
- Climate carrying-cost: severe flood risk — expect insurance premiums to compound above CPI over the hold.
Questions for the listing agent
- It's been on market 31 days. Have you received any prior offers? Is the seller open to a 3% concession, seller financing, or rate buy-down credit?
- Built in 1974 — when were the roof, HVAC, electrical panel, plumbing, and water heater last replaced?
- What's the actual annual flood-insurance premium (NFIP or private), and is the property in a SFHA with mandatory coverage?
- Is there a deadline driving the sale (1031 exchange, divorce, estate, relocation)? That informs how much negotiation room exists.
- Schools are B-rated — typically a magnet for longer-tenancy family renters. What's the average tenant stay here, and is there a school-zone premium baked into asking?
- What's the average days-on-market for RENTAL listings here right now (not sales)? A rising rental-DOM trend means longer vacancies and softer asking-rent achievability than the comps imply.
- What's the recent tenant-quality profile in this submarket — average credit score on applications, eviction rate, late-payment / NSF rate, and stable-employment percentage? A property-management company in the area should have these aggregated.
- How much new for-sale + rental construction is in the pipeline within 1–3 miles? Heavy new supply typically softens prices + rents 12–24 months out; constrained supply supports both.
Investment metrics
- 1% rule
- 0.98% ✗
- Cap rate
- 8.34%
- Cash-on-cash
- 7.32%
- DSCR
- 1.33
- GRM
- 8.5
CMA / ARV
No comps found within radius.
Projected returns pro-forma
-3.0% appreciation · 3.0% rent growth · sell at horizon
- IRR
- -7.5%
- Equity multiple
- 0.72×
- Total profit
- $-13,734
- Equity at exit
- $26,540
- IRR
- 2.1%
- Equity multiple
- 1.15×
- Total profit
- $7,418
- Equity at exit
- $15,390
Cash invested: $49,840 (down + closing). Projections, not guarantees.
Landlord ↔ Tenant lean methodology
- Overall (STATE)
- 55 Moderately Landlord-Leaning
- State Virginia
- 55 Moderately Landlord-Leaning · D+2
- County
- — inherits STATE
- City
- — inherits STATE
ZIP-level market 22849
- Home prices YoY
- -21.0%
- Active inventory
- 43
- Price-to-rent
- 8.5×
Monthly cashflow live
- Estimated rent
- $1,745 medium interval (Pro) →
- Mortgage (P&I)
- −$933
- Tax from tax record
- −$67 /mo · $799/yr
- Insurance
- −$74
- Flood insurance flood zone
- −$66 /mo · $798/yr
- HOA
- −$0
- Lot rent
- −$0
- Vacancy / Maint / Mgmt
- −$366
- Net cashflow
- $238
Break-even live
Sensitivity live
| Price | -10% $338 | -5% $288 | +0% $238 | +5% $187 | +10% $137 |
|---|---|---|---|---|---|
| Rent | -10% $100 | -5% $169 | +0% $238 | +5% $307 | +10% $376 |
| Rate | -1.0pp $327 | -0.5pp $283 | base $238 | +0.5pp $192 | +1.0pp $145 |
UW: 25.0% down · 7.5% · 30yr · 1.5% tax · 5.0% vac · 8.0% maint · 8.0% mgmt
Financing live
Cash to close
- Down payment
- $44,500
- Closing costs
- $5,340
- Reserves months
- —
- Total cash needed
- —
Loan-product check · same deal, 3 products live
Conventional
25% down · 7.5% · 30yr
- Down + closing
- —
- Monthly P&I
- —
- Monthly cashflow
- —
- DSCR
- —
- Eligible?
- —
Personal DTI + credit; lowest rate.
DSCR
20% down · 8.5% · 30yr
- Down + closing
- —
- Monthly P&I
- —
- Monthly cashflow
- —
- DSCR
- —
- Eligible?
- —
No personal income docs; deal must DSCR.
Hard money
10% down · 12.0% · 12mo
- Down + closing
- —
- Monthly P&I
- —
- Monthly cashflow
- —
- DSCR
- —
- Eligible?
- —
Short-term bridge; refi at stabilization.
Listing history 19 events
-
2026-06-23days on market $178,000 Active 31 DOM
-
2026-06-22days on market $178,000 Active 30 DOM
-
2026-06-19days on market $178,000 Active 28 DOM
-
2026-06-18days on market $178,000 Active 27 DOM
-
2026-06-17days on market $178,000 Active 26 DOM
-
2026-06-16days on market $178,000 Active 25 DOM
-
2026-06-15days on market $178,000 Active 24 DOM
-
2026-06-14days on market $178,000 Active 22 DOM
-
2026-06-13days on market $178,000 Active 21 DOM
-
2026-06-10days on market $178,000 Active 19 DOM
-
2026-06-09days on market $178,000 Active 18 DOM
-
2026-06-08days on market $178,000 Active 17 DOM
-
2026-06-07days on market $178,000 Active 16 DOM
-
2026-06-02days on market $178,000 Active 11 DOM
-
2026-06-01days on market $178,000 Active 10 DOM
-
2026-05-31days on market $178,000 Active 9 DOM
-
2026-05-30days on market $178,000 Active 8 DOM
-
2026-05-22$178,000 Active
-
1998-10-29soldstatus $60,000
ⓘ Source: listings_history table (triggers on properties + properties_extension) + one-shot
backfill from property_details.listing_events for pre-trigger history.
Tax reassessment forecast VA · Resets to sale price
- Current annual tax
- $799 · $67/mo
- Projected year-2 tax
- $1,460 · $122/mo
- Expected delta
- +$661/yr (+$55/mo · 82.8%)
ⓘ Screening estimate from a state-policy table — verify with the county assessor before closing.
Climate risk First Street
- Flood 8/10 Severe FEMA zone X (unshaded) · 99% chance over 30 yrs
- Wildfire 4/10 Moderate
- Heat 4/10 Moderate 8 d/yr ≥95°F today · 20 d/yr by 30 yrs out
- Wind 2/10 Low 100% chance of damaging wind over 30 yrs
- Air quality 1/10 Low 0 unhealthy d/yr today · 0 by 30 yrs out
Nearby sold comps map
Loading sold comps map…
Walkable amenities ~0.75 mi
Loading nearby amenities…
Taxation est. · year 1
- Rental income
- $20,937
- − Mortgage interest
- −$9,971
- − Property taxes
- −$799
- − Insurance
- −$1,688
- − Repairs & maintenance
- −$1,675
- − Management
- −$1,675
- − Depreciation
- −$5,178
- Taxable loss
- −$48
- Est. tax savings @ 24.0%
- +$12
- After-tax cash flow
- $2,864/yr
For passive investors: Depreciation is non-cash, so a rental often shows a tax loss while cash-flowing — sheltering income. Rental losses are passive: they offset passive income freely, and up to $25,000/yr can offset ordinary (W-2) income if you actively participate and your MAGI is under $100k (phasing out to $0 by $150k); unused losses carry forward. On sale, claimed depreciation is recaptured at up to 25%, and gains may owe capital-gains tax (a 1031 exchange can defer both). Figures are a year-1 estimate at your 24.0% rate — not tax advice; consult a CPA.
Schools (NCES district)
- District
- Page County Public School District
- NCES district ID
- 5102850
- Math proficiency
- 42% ▼ -35.00%
- Reading proficiency
- 62% ▼ -10.00%
- Median HH income
- $43,808
- Composite
- 43.77/100
- National rank
- #2943
- State rank
- #96 of 131 in VA
Livability — Shenandoah
- Score
- 67/100
- State rank
- #304
- US rank
- #10921
Category grades
Schools grade is shown separately in the Schools card above.
Census & demographics
- Population (ZIP)
- 5,291
Population outlook (Page County) Hauer SSP2
- Today (2025)
- 22,843 people
- By 2030
- 22,147 · -3.0%
- By 2040
- 20,427 · -10.6%
- By 2050
- 18,461 · -19.2%
- By 2075
- 14,363 · -37.1%
- By 2100
- 10,678 · -53.3%
Race, ethnicity, and origin ACS 2023
- Neighborhood character
- Predominantly White (89%)
- Race & ethnicity
- White 89% Two or more races 9% Hispanic / Latino 7%
- Hispanic origin (detail)
- Mexican 5% Puerto Rican 1%
- Common ancestry
- Serbian 2% Italian 2% Slovak 1%
- Foreign-born
- 6% · Canada
- Languages at home
- 94% English-only · Spanish 6%
Political lean MEDSL · Page
- 2024 margin
- Solid R (+54.1) · D 22.5% · R 76.6%
- 2008→2024 swing
- -36.7pp toward R · 2008: -17.4pp · 2024: -54.1pp
- All cycles
- 2024: R+54.1 2020: R+50.6 2016: R+49.8 2012: R+25.7 2008: R+17.4
Not yet ingested
- Civics
- —
Market trends
- HPI YoY
- ▼ -57.38%
- Current HPI
- 216.3367
- Rent YoY
- —
- Metro
- —
- State GDP YoY
- ▲ 2.40%
- F500 in state
- 50
Industry mix (Fortune 500 HQ in VA)
| Industry | F500 HQs | Revenue |
|---|---|---|
| Aerospace / Defense | 4 | $236B |
|
||
| Technology / Defense | 3 | $32B |
|
||
| Financial Services | 2 | $176B |
|
||
| Utilities | 2 | $27B |
|
||
| Insurance | 2 | $25B |
|
||
| Technology | 2 | $15B |
|
||
Price history
+196.7% since first listed2 events — show timeline
- 2026-05-22 Listed $178,000 BRIGHT MLS
- 1998-10-29 Sold (Public Records) $60,000 Public Records
Property tax history
+1.9%/yrLatest (2025): $799 · +0.0% YoY. Source: county tax records.
Cash-flow waterfall
monthlySold comps — $/sqft
last 12 mo · ≤1 miLoading sold comps…