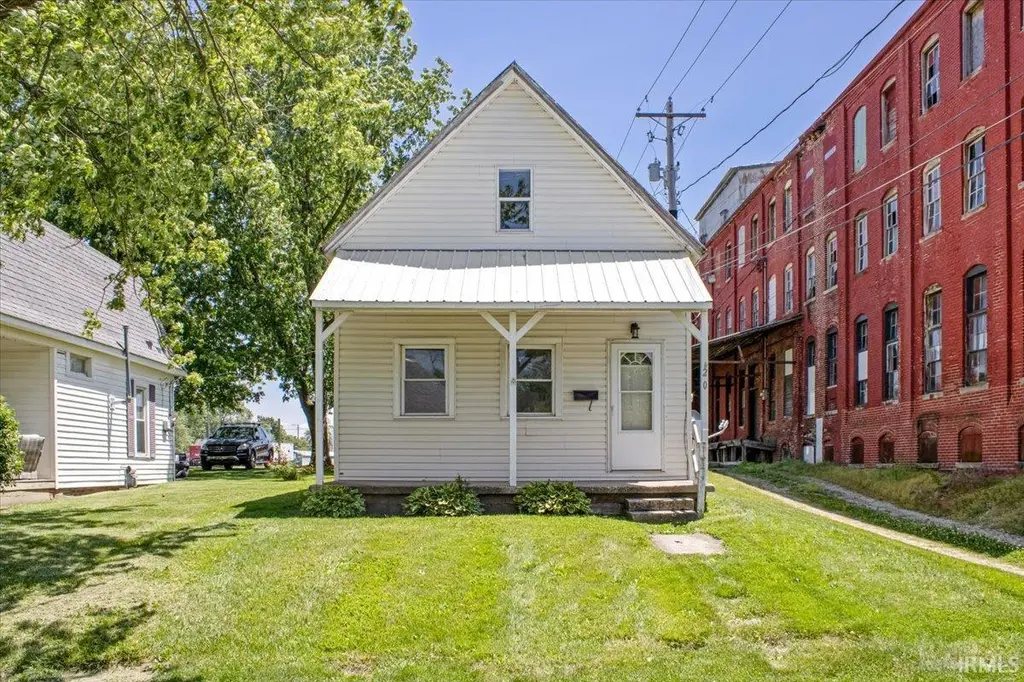
420 N West St · Winchester, IN
Flood risk 1/10 · Minimal
- FEMA flood zone
- X (unshaded)
- Chance of flooding over 30 yrs
- 0.0%
- Est. flood insurance / yr
- $507 – $1,088
Fire risk 1/10 · Minimal
- Est. fire insurance / yr
- $717 – $1,331
Heat risk 3/10 · Minor
- Hot days now (above 100°F)
- 7 days/yr
- Hot days in 30 yrs
- 18 days/yr
Wind risk 2/10 · Minimal
- Chance of severe wind over 30 yrs
- 0.0%
Air-quality risk 3/10 · Minor
- Unhealthy air days now
- 2 days/yr
- Unhealthy air days in 30 yrs
- 4 days/yr
Risk factors via First Street. Map © Google.
Why this score? — see what drove the B grade
The composite is a weighted blend of 9 inputs, each scored 0–100. Each bar is that input's sub-score; the figure is the points it added to the 100-point composite (weight × sub-score).
- Cash flow +22.9/30.0
- ARV discount +15.0/15.0
- Appreciation +10.0/10.0
- DSCR +7.4/10.0
- 1% rule +5.3/10.0
- Livability +3.4/5.0
- Schools +2.9/10.0
- Rent growth +2.5/5.0
- Condition / age +2.5/5.0
$94,900
🖨 Deal sheet 📄 Offer letter ✓ Due diligence
Listing remarks MLS
2BR/1BA home in Winchester featuring a welcoming front living room that flows through to the dining room and open kitchen with a laundry area. A full bath sits just off the dining room, and two connected bedrooms await upstairs. Close to town amenities and a great fit as a starter home or rental.
Key facts
- Laundry area
- Dining room
- Full bath
Tags
Property features AI
Finance
- Other: Lot dimensions approximately 39 x 108 (about 0.1 acre)
Exterior
- Parking: No dedicated parking listed
- Utilities: Public water; Public sewer
- Home design: Single-story, site-built single family residence; Residential property
- Construction: Vinyl siding
- Exterior features: Metal roof; No fencing; Yard shed(s)
Interior
- Kitchen: Electric range
- Bedrooms: Total rooms: 6
- Flooring: Carpet; Vinyl
- Bathrooms: One full bathroom (located on the main level)
- Heating & cooling: Baseboard heating; Window air conditioning unit(s)
- Interior features: Entrance foyer; One fireplace (none of the listed fireplace features apply)
- Laundry & utility: Electric dryer hookup on the main level; Crawl space basement
Neighborhood map
What this means for you Summary
Snapshot
- This is a 3-bed/1.0-bath single-family listed at $95k.
Deal economics
- At list price, monthly cash flow is $167 ($2k/yr) — positive.
- The deal already cash-flows at list — no discount required.
- Meets the 1% rule at list price ($980 rent vs $95k).
- Cap rate 8.4% vs local median 5.1% in Winchester — top-decile yield for the area; either an underpriced asset or a hidden risk that comps aren't pricing in. Stress-test before assuming the spread holds.
Location & tenants
- Location reads 67/100 on livability (#240 in IN) — a middle-class / working-renter tenant base. Strengths: cost of living A+, housing A+, crime B; Watch: health & safety D, amenities F, commute F.
- Randolph Central School Corporation (town): math 32% / reading 37% proficiency, ranked #201 of 301 in IN (top 67%) — families likely to look elsewhere, expect single-tenant / working-renter base with shorter leases.
- Zoned schools: Lee L Driver Middle School (math 27% / reading 33%, grade F, #208 of 330 statewide, top 64%, 291 students, 56% FRL); Winchester Community High School (math 17% / reading 47%, grade F, #295 of 369 statewide, top 82%, 414 students, 47% FRL).
- Market conditions: 52 active listings in the ZIP; 19 units permitted in Randolph County in 2024 (0 in 5+ unit buildings).
Forward outlook
- In year one you build about $10k of equity ($656 loan paydown + $9k appreciation (10.0% local appreciation)).
- Randolph County population projected at -26% by 2050 — secular population decline; favor cash flow + early exit over multi-decade hold.
- At projected returns (10.0% appreciation + 3.0% rent growth), your $27k cash investment doubles in ~3 years — after that, you're playing with house money.
- By year 4, paydown + projected appreciation supports a ~$36k cash-out refi (75% LTV) — recoverable capital for the next deal without selling this one.
Negotiation context
- Only 10 days on market — expect competitive offers; lowballing is unlikely to land.
- 5 sale attempts since 12y ago with the ask held roughly flat each time — persistent listings suggest the price (not the market) is what's stuck; bring a comps-based counter.
- Current owner paid $32k; list at $95k implies a 198% gain — meaningful room to come down on a strong offer.
Risks & watch-outs
- Watch-outs: built in 1900 — expect roof / HVAC / electrical / plumbing capex.
Questions for the listing agent
- Built in 1900 — when were the roof, HVAC, electrical panel, plumbing, and water heater last replaced?
- Is there a deadline driving the sale (1031 exchange, divorce, estate, relocation)? That informs how much negotiation room exists.
- Schools are D-rated, which usually means shorter tenancies and higher turnover. Who's the typical renter profile here, and what's been the actual vacancy rate?
- What's the average days-on-market for RENTAL listings here right now (not sales)? A rising rental-DOM trend means longer vacancies and softer asking-rent achievability than the comps imply.
- What's the recent tenant-quality profile in this submarket — average credit score on applications, eviction rate, late-payment / NSF rate, and stable-employment percentage? A property-management company in the area should have these aggregated.
- How much new for-sale + rental construction is in the pipeline within 1–3 miles? Heavy new supply typically softens prices + rents 12–24 months out; constrained supply supports both.
Investment metrics
- 1% rule
- 1.03% ✓
- Cap rate
- 8.41%
- Cash-on-cash
- 7.55%
- DSCR
- 1.34
- GRM
- 8.1
CMA / ARV
- ARV (on-the-fly)
- $116,220
- Comps found
- 10
Show comp detail 10 sales within ~0.75 mi
| Address | Dist | Beds/Ba | Sqft | Sold | Price | $/sf | Match |
|---|---|---|---|---|---|---|---|
| 315 W Orange St | 0.65mi | 2/1.0 (-1) | 948 (+6%) | 1mo | $85,000 | $90 | 54 |
| 419 E Carl St | 0.65mi | 2/1.0 (-1) | 877 (-2%) | 9mo | $103,900 | $118 | 54 |
| 407 Westwood Dr | 0.60mi | 2/1.0 (-1) | 806 (-10%) | 2mo | $120,000 | $149 | 49 |
| 840 N West St | 0.42mi | 3/1.0 | 768 (-14%) | 13mo | $108,000 | $141 | 46 |
| 865 N West St | 0.47mi | 3/1.0 | 1,008 (+13%) | 13mo | $52,400 | $52 | 46 |
| 542 S Wall St | 0.63mi | 2/1.0 (-1) | 834 (-7%) | 12mo | $15,000 | $18 | 44 |
| 534 S Western Ave | 0.64mi | 2/1.0 (-1) | 825 (-8%) | 10mo | $125,000 | $152 | 44 |
| 712 Wedgewood Dr | 0.74mi | 3/1.0 | 1,026 (+15%) | 6mo | $189,000 | $184 | 36 |
| 425 Western Ave | 0.51mi | 2/1.0 (-1) | 1,008 (+13%) | 17mo | $85,000 | $84 | 36 |
| 607 W Newton St | 0.63mi | 2/1.0 (-1) | 1,025 (+15%) | 12mo | $133,400 | $130 | 31 |
Match score weights: distance 35% · size 25% · config 20% · recency 20%. Top-matched comps best support the ARV.
Projected returns pro-forma
10.0% appreciation · 3.0% rent growth · sell at horizon
- IRR
- 29.8%
- Equity multiple
- 3.35×
- Total profit
- $62,321
- Equity at exit
- $85,493
- IRR
- 25.8%
- Equity multiple
- 7.59×
- Total profit
- $175,120
- Equity at exit
- $184,370
Cash invested: $26,572 (down + closing). Projections, not guarantees.
Landlord ↔ Tenant lean methodology
- Overall (STATE)
- 90 Strongly Landlord-Friendly
- State Indiana
- 90 Strongly Landlord-Friendly · R+11
- County
- — inherits STATE
- City
- — inherits STATE
ZIP-level market 47394
- Home prices YoY
- 6.8%
- Active inventory
- 52
- Price-to-rent
- 8.1×
Monthly cashflow live
- Estimated rent
- $980 medium interval (Pro) →
- Mortgage (P&I)
- −$498
- Tax from tax record
- −$70 /mo · $838/yr
- Insurance
- −$40
- HOA
- −$0
- Vacancy / Maint / Mgmt
- −$206
- Net cashflow
- $167
Break-even live
UW: 25.0% down · 7.5% · 30yr · 1.5% tax · 5.0% vac · 8.0% maint · 8.0% mgmt
Financing live
Cash to close
- Down payment
- $23,725
- Closing costs
- $2,847
- Reserves months
- —
- Total cash needed
- —
Loan-product check · same deal, 3 products live
Conventional
25% down · 7.5% · 30yr
- Down + closing
- —
- Monthly P&I
- —
- Monthly cashflow
- —
- DSCR
- —
- Eligible?
- —
Personal DTI + credit; lowest rate.
DSCR
20% down · 8.5% · 30yr
- Down + closing
- —
- Monthly P&I
- —
- Monthly cashflow
- —
- DSCR
- —
- Eligible?
- —
No personal income docs; deal must DSCR.
Hard money
10% down · 12.0% · 12mo
- Down + closing
- —
- Monthly P&I
- —
- Monthly cashflow
- —
- DSCR
- —
- Eligible?
- —
Short-term bridge; refi at stabilization.
Listing history 8 events
-
2026-06-18days on market $94,900 Active 10 DOM
-
2026-06-17days on market $94,900 Active 9 DOM
-
2026-06-16days on market $94,900 Active 8 DOM
-
2026-06-15days on market $94,900 Active 7 DOM
-
2026-06-13days on market $94,900 Active 5 DOM
-
2026-06-12days on market $94,900 Active 4 DOM
-
2026-06-09remarks 297-char remark
-
2026-06-09$94,900 Active 1 DOM
ⓘ Source: listings_history table (triggers on properties + properties_extension) + one-shot
backfill from property_details.listing_events for pre-trigger history.
Tax reassessment forecast IN · Partial reset (capped growth)
- Current annual tax
- $838 · $70/mo
- Projected year-2 tax
- $838 · $70/mo
- Expected delta
- $0/yr ($0/mo · 0.0%)
ⓘ Screening estimate from a state-policy table — verify with the county assessor before closing.
Climate risk First Street
- Flood 1/10 Low FEMA zone X (unshaded) · 0% chance over 30 yrs
- Wildfire 1/10 Low
- Heat 3/10 Moderate 7 d/yr ≥100°F today · 18 d/yr by 30 yrs out
- Wind 2/10 Low 0% chance of damaging wind over 30 yrs
- Air quality 3/10 Moderate 2 unhealthy d/yr today · 4 by 30 yrs out
Nearby sold comps map
Loading sold comps map…
Walkable amenities ~0.75 mi
Loading nearby amenities…
Taxation est. · year 1
- Rental income
- $11,761
- − Mortgage interest
- −$5,316
- − Property taxes
- −$838
- − Insurance
- −$474
- − Repairs & maintenance
- −$941
- − Management
- −$941
- − Depreciation
- −$2,761
- Taxable income
- $490
- Est. tax owed @ 24.0%
- −$118
- After-tax cash flow
- $1,889/yr
For passive investors: Depreciation is non-cash, so a rental often shows a tax loss while cash-flowing — sheltering income. Rental losses are passive: they offset passive income freely, and up to $25,000/yr can offset ordinary (W-2) income if you actively participate and your MAGI is under $100k (phasing out to $0 by $150k); unused losses carry forward. On sale, claimed depreciation is recaptured at up to 25%, and gains may owe capital-gains tax (a 1031 exchange can defer both). Figures are a year-1 estimate at your 24.0% rate — not tax advice; consult a CPA.
Schools (NCES district)
- District
- Randolph Central School Corporation
- NCES district ID
- 1801770
- Math proficiency
- 32% ▼ -7.00%
- Reading proficiency
- 37% ▼ -4.00%
- Median HH income
- $41,627
- Composite
- 29.12/100
- National rank
- #6589
- State rank
- #201 of 301 in IN
Livability — Winchester
- Score
- 67/100
- State rank
- #240
- US rank
- #10313
Category grades
Schools grade is shown separately in the Schools card above.
Census & demographics
- Census place
- Winchester, IN
- City population
- 8,137
- Population (ZIP)
- 8,137
Population outlook (Randolph County) Hauer SSP2
- Today (2025)
- 22,998 people
- By 2030
- 21,815 · -5.1%
- By 2040
- 19,360 · -15.8%
- By 2050
- 17,010 · -26.0%
- By 2075
- 12,491 · -45.7%
- By 2100
- 8,986 · -60.9%
Race, ethnicity, and origin ACS 2023
- Neighborhood character
- Predominantly White (96%)
- Race & ethnicity
- White 96% Two or more races 2% Hispanic / Latino 1%
- Common ancestry
- Lithuanian 2% Italian 2% Slovak 2%
- Foreign-born
- 1%
- Languages at home
- 99% English-only · Spanish 1% Other Asian/Pacific 1%
Political lean MEDSL · Randolph
- 2024 margin
- Solid R (+53.7) · D 22.3% · R 75.9% · Other 1.8%
- 2008→2024 swing
- -44.9pp toward R · 2008: -8.8pp · 2024: -53.7pp
- All cycles
- 2024: R+53.7 2020: R+52.4 2016: R+48.5 2012: R+24.1 2008: R+8.8
Not yet ingested
- Civics
- —
Market trends
- HPI YoY
- ▲ 14.76%
- Current HPI
- 233.216
- Rent YoY
- —
- Metro
- —
- State GDP YoY
- ▲ 2.90%
- F500 in state
- 18
Industry mix (Fortune 500 HQ in IN)
| Industry | F500 HQs | Revenue |
|---|---|---|
| Industrial Machinery | 2 | $37B |
|
||
| Healthcare | 1 | $177B |
|
||
| Pharmaceuticals | 1 | $45B |
|
||
| Metals / Steel | 1 | $18B |
|
||
| Agriculture | 1 | $17B |
|
||
| Packaging | 1 | $12B |
|
||
Price history
+281.1% since first listed7 events — show timeline
- 2026-06-08 Listed $94,900 IRMLS
- 2026-06-08 Listed $94,900 RRELMS
- 2019-03-29 Sold (MLS) $31,800 IRMLS
- 2019-03-29 Sold (MLS) $31,800 RRELMS
- 2018-12-17 Listed $29,900 RRELMS
- 2018-12-17 Listed $29,900 IRMLS
- 2014-08-19 Listed $24,900 IRMLS
Property tax history
+5.1%/yrLatest (2024): $838 · +4.0% YoY. Source: county tax records.
Cash-flow waterfall
monthlySold comps — $/sqft
last 12 mo · ≤1 miLoading sold comps…