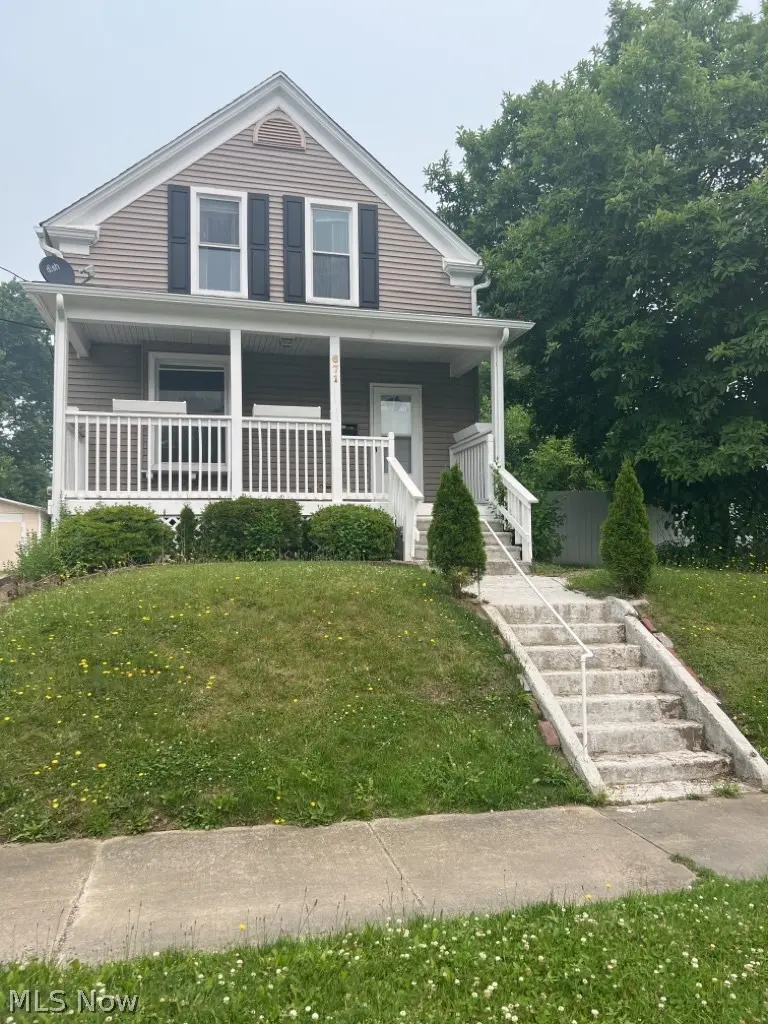
671 Kling St · Akron, OH
Flood risk 1/10 · Minimal
- FEMA flood zone
- X (unshaded)
- Chance of flooding over 30 yrs
- 0.0%
- Est. flood insurance / yr
- $473 – $860
Fire risk 1/10 · Minimal
- Est. fire insurance / yr
- $713 – $1,323
Heat risk 3/10 · Minor
- Hot days now (above 96°F)
- 7 days/yr
- Hot days in 30 yrs
- 16 days/yr
Wind risk 1/10 · Minimal
- Chance of severe wind over 30 yrs
- —
Air-quality risk 3/10 · Minor
- Unhealthy air days now
- 2 days/yr
- Unhealthy air days in 30 yrs
- 4 days/yr
Risk factors via First Street. Map © Google.
Why this score? — see what drove the D+ grade
The composite is a weighted blend of 9 inputs, each scored 0–100. Each bar is that input's sub-score; the figure is the points it added to the 100-point composite (weight × sub-score).
- Cash flow +21.1/30.0
- DSCR +6.7/10.0
- 1% rule +6.3/10.0
- Livability +4.0/5.0
- Rent growth +2.5/5.0
- Condition / age +2.5/5.0
- Schools +2.1/10.0
- ARV discount +1.2/15.0
- Appreciation +0.0/10.0
$89,900
🖨 Deal sheet 📄 Offer letter ✓ Due diligence
Listing remarks MLS
Motivated sellers. Move in condition. Many updates including huge covered rear porch. Well maintained.
Key facts
- Central ac
- Furnace replaced
- Detached garage
Tags
Neighborhood map
What this means for you Summary
Snapshot
- This is a 2-bed/2.0-bath single-family listed at $90k.
Deal economics
- At list price, monthly cash flow is $129 ($2k/yr) — positive.
- The deal already cash-flows at list — no discount required.
- Meets the 1% rule at list price ($1k rent vs $90k).
- Cap rate 8.0% vs local median 6.6% in Akron — meaningfully above typical; check what's discounted (condition, days-on-market, listing class) to confirm the premium yield is real.
Location & tenants
- Location reads 81/100 on livability (#104 in OH, #1,591 nationally) — a professional / high-income tenant draw. Strengths: amenities A+, commute A+, cost of living A+; Watch: crime F, employment F.
- Akron City (urban): math 22% / reading 30% proficiency, ranked #602 of 656 in OH (top 92%) — low school quality limits family demand, transient renter base, plan for 1-2y turnover; 66% free/reduced lunch — lower-income household profile, screen leases tightly.
- Market conditions: 54 active listings in the ZIP; 40 comparable units currently listed for rent nearby; rentals at typical pace (median 24d on market — plan ~3-4 weeks tenant-placement turnaround); 48% of comp listings sitting > 30 days — soft ceiling on asking rent; lower-income renter base — watch delinquency; 1,114 units permitted in Summit County in 2024 (397 in 5+ unit buildings).
- At $1,019/mo this rent would consume 50% of the median local household income ($24k/yr) (locally 659% of renters already pay >50% of income on rent) — very limited rent-growth headroom before tenants either downsize or default.
Forward outlook
- Local home prices are declining (-3.0%/yr); year-one equity from $622 of loan paydown is wiped out by about $3k of value loss. Plan a longer hold.
- Summit County population projected to shrink 6% by 2050 — rents likely to lag national; underwrite the cash flow, not the appreciation.
Negotiation context
- Only 13 days on market — expect competitive offers; lowballing is unlikely to land.
- 6 sale attempts since 15y ago with the ask held roughly flat each time — persistent listings suggest the price (not the market) is what's stuck; bring a comps-based counter.
Risks & watch-outs
- Watch-outs: built in 1904 — expect roof / HVAC / electrical / plumbing capex.
Questions for the listing agent
- Built in 1904 — when were the roof, HVAC, electrical panel, plumbing, and water heater last replaced?
- Is there a deadline driving the sale (1031 exchange, divorce, estate, relocation)? That informs how much negotiation room exists.
- Crime grade is F in this area — have there been break-ins, vandalism, or insurance claims at this property in the last 3 years? What carrier currently insures it and at what premium?
- The area grade is low — what's the realistic commute time and amenity access for the typical tenant pool here? Any planned neighborhood developments (good or bad) we should know about?
- What's the average days-on-market for RENTAL listings here right now (not sales)? A rising rental-DOM trend means longer vacancies and softer asking-rent achievability than the comps imply.
- What's the recent tenant-quality profile in this submarket — average credit score on applications, eviction rate, late-payment / NSF rate, and stable-employment percentage? A property-management company in the area should have these aggregated.
- How much new for-sale + rental construction is in the pipeline within 1–3 miles? Heavy new supply typically softens prices + rents 12–24 months out; constrained supply supports both.
Investment metrics
- 1% rule
- 1.13% ✓
- Cap rate
- 8.01%
- Cash-on-cash
- 6.15%
- DSCR
- 1.27
- GRM
- 7.4
CMA / ARV
- ARV (on-the-fly)
- $78,880
- Comps found
- 12
Show comp detail 12 sales within ~0.75 mi
| Address | Dist | Beds/Ba | Sqft | Sold | Price | $/sf | Match |
|---|---|---|---|---|---|---|---|
| 374 E Voris St | 0.10mi | 3/1.0 (+1) | 876 (-6%) | 5mo | $102,000 | $116 | 73 |
| 396 E Voris St | 0.06mi | 2/1.0 | 858 (-8%) | 9mo | $79,900 | $93 | 73 |
| 440 Tyner St | 0.18mi | 3/1.0 (+1) | 880 (-5%) | 9mo | $72,100 | $82 | 66 |
| 791 Allyn St | 0.25mi | 3/1.0 (+1) | 992 (+7%) | 4mo | $85,000 | $86 | 65 |
| 370 E Thornton St | 0.14mi | 3/1.0 (+1) | 1,015 (+9%) | 6mo | $75,500 | $74 | 64 |
| 912 Ashland Ave | 0.45mi | 2/1.0 | 864 (-7%) | 1mo | $87,000 | $101 | 63 |
| 348 Jewell Dr | 0.36mi | 2/1.0 | 999 (+8%) | 9mo | $59,500 | $60 | 59 |
| 917 Clay St | 0.47mi | 2/1.0 | 864 (-7%) | 8mo | $72,000 | $83 | 56 |
| 696 Merton Ave | 0.72mi | 2/1.0 | 816 (-12%) | 2mo | $70,000 | $86 | 40 |
| 484 Hammel St | 0.44mi | 3/1.0 (+1) | 792 (-15%) | 12mo | $67,000 | $85 | 36 |
| 720 Kipling St | 0.64mi | 2/1.0 | 800 (-14%) | 12mo | $51,500 | $64 | 33 |
| 560 Nash St | 0.70mi | 3/2.0 (+1) | 1,049 (+13%) | 11mo | $60,500 | $58 | 32 |
Match score weights: distance 35% · size 25% · config 20% · recency 20%. Top-matched comps best support the ARV.
Projected returns pro-forma
-3.0% appreciation · 3.0% rent growth · sell at horizon
- IRR
- -6.8%
- Equity multiple
- 0.75×
- Total profit
- $-6,307
- Equity at exit
- $13,404
- IRR
- 2.9%
- Equity multiple
- 1.21×
- Total profit
- $5,280
- Equity at exit
- $7,773
Cash invested: $25,172 (down + closing). Projections, not guarantees.
Landlord ↔ Tenant lean methodology
- Overall (STATE)
- 73 Landlord-Friendly
- State Ohio
- 73 Landlord-Friendly · R+6
- County
- — inherits STATE
- City
- — inherits STATE
ZIP-level market 44311
- Home prices YoY
- -28.4%
- Active inventory
- 54
- Price-to-rent
- 7.4×
Monthly cashflow live
- Estimated rent
- $1,019 high interval (Pro) →
- Mortgage (P&I)
- −$471
- Tax from tax record
- −$167 /mo · $2,003/yr
- Insurance
- −$37
- HOA
- −$0
- Vacancy / Maint / Mgmt
- −$214
- Net cashflow
- $129
Break-even live
UW: 25.0% down · 7.5% · 30yr · 1.5% tax · 5.0% vac · 8.0% maint · 8.0% mgmt
Financing live
Cash to close
- Down payment
- $22,475
- Closing costs
- $2,697
- Reserves months
- —
- Total cash needed
- —
Loan-product check · same deal, 3 products live
Conventional
25% down · 7.5% · 30yr
- Down + closing
- —
- Monthly P&I
- —
- Monthly cashflow
- —
- DSCR
- —
- Eligible?
- —
Personal DTI + credit; lowest rate.
DSCR
20% down · 8.5% · 30yr
- Down + closing
- —
- Monthly P&I
- —
- Monthly cashflow
- —
- DSCR
- —
- Eligible?
- —
No personal income docs; deal must DSCR.
Hard money
10% down · 12.0% · 12mo
- Down + closing
- —
- Monthly P&I
- —
- Monthly cashflow
- —
- DSCR
- —
- Eligible?
- —
Short-term bridge; refi at stabilization.
Rent comps 40 comps
| Address | Beds | Baths | Sqft | Rent | $/sqft | DOM | Units | Dist |
|---|---|---|---|---|---|---|---|---|
| 689 Kling St Akron, OH | 3.0 | 1.0 | 780 | $1,075 | $1.38 | 21d | 1 | 0.04mi |
| 429 Lovisa St Akron, OH | 1.0 | 1.0 | 600 | $900 | $1.50 | 43d | 1 | 0.07mi |
| 374 E Voris St Akron, OH | 3.0 | 1.0 | 876 | $1,150 | $1.31 | 23d | 1 | 0.11mi |
| 549 Brown St Unit 1 Akron, OH | 1.0 | 1.0 | 900 | $600 | $0.67 | 23d | 1 | 0.20mi |
| 549 Brown St Unit 3 Akron, OH | 1.0 | 1.0 | 900 | $900 | $1.00 | 23d | 1 | 0.20mi |
| 662 Sumner St Akron, OH | 2.0 | 1.0 | 915 | $999 | $1.09 | 43d | 1 | 0.24mi |
| 658 Sumner St Akron, OH | 2.0 | 1.0 | 915 | $999 | $1.09 | 43d | 1 | 0.24mi |
| 393 Cross St Unit 393 Akron, OH | 2.0 | 1.0 | 864 | $775 | $0.90 | 43d | 1 | 0.25mi |
| 375 Cross St Akron, OH | 1.0 | 1.0 | 800 | $820 | $1.02 | 43d | 1 | 0.26mi |
| 418 Power St Akron, OH | 3.0 | 1.0 | 1000 | $999 | $1.00 | 23d | 1 | 0.32mi |
| 420 Power St Akron, OH | 3.0 | 1.0 | 900 | $800 | $0.89 | 23d | 1 | 0.33mi |
| 600 Sherman St Akron, OH | 4.0 | 1.0–2.0 | 824 | $1,200 | $1.46 | 14d | 14 | 0.35mi |
| 467 Spicer St Akron, OH | 2.0 | 1.0 | 800 | $915 | $1.14 | 23d | 1 | 0.36mi |
| 461 Spicer St Akron, OH | 3.0 | 2.0 | 1000 | $995 | $0.99 | 43d | 1 | 0.37mi |
| 484 Hammel St Akron, OH | 2.0 | 1.0 | 792 | $1,100 | $1.39 | 43d | 1 | 0.43mi |
| 505 Rentschler St Unit Down Akron, OH | 2.0 | 1.0 | 825 | $850 | $1.03 | 14d | 1 | 0.45mi |
| 287 Wheeler St Akron, OH | 3.0 | 1.0 | 1100 | $1,350 | $1.23 | 23d | 1 | 0.47mi |
| 472 Sumner St Apt 3 Akron, OH | 1.0 | 1.0 | 600 | $850 | $1.42 | 23d | 1 | 0.50mi |
| 470 Sumner St Unit 2 Akron, OH | 2.0 | 1.0 | 560 | $900 | $1.61 | 23d | 1 | 0.50mi |
| 421 Allyn St Unit 2 Akron, OH | 3.0 | 1.0 | 743 | $850 | $1.14 | 43d | 1 | 0.51mi |
| 437 Sumner St Apt T Akron, OH | 3.0 | 1.5 | 600 | $960 | $1.60 | 23d | 1 | 0.52mi |
| 437 Sumner St Apt P Akron, OH | 3.0 | 1.5 | 600 | $750 | $1.25 | 23d | 1 | 0.52mi |
| 437 Sumner St Apt A Akron, OH | 3.0 | 1.5 | 750 | $1,200 | $1.60 | 23d | 1 | 0.52mi |
| 437 Sumner St Apt R Akron, OH | 2.0 | 1.5 | 600 | $500 | $0.83 | 23d | 1 | 0.52mi |
| 437 Sumner St Apt D Akron, OH | 2.0 | 1.5 | 750 | $900 | $1.20 | 23d | 1 | 0.52mi |
| 195 Wheeler St Apt 301 Akron, OH | 2.0 | 1.0 | 600 | $750 | $1.25 | 43d | 1 | 0.54mi |
| 195 Wheeler St Apt 104 Akron, OH | 1.0 | 1.0 | 600 | $700 | $1.17 | 43d | 1 | 0.54mi |
| 406 Sumner St Akron, OH | 2.0–4.0 | 1.0–2.0 | 836 | $875 | $1.05 | 14d | 3 | 0.59mi |
| 344 Lease St Akron, OH | 3.0 | 1.0 | 1000 | $1,199 | $1.20 | 43d | 1 | 0.62mi |
| 629 Morgan Ave Akron, OH | 2.0 | 1.0 | 960 | $1,200 | $1.25 | 43d | 1 | 0.65mi |
| 878 Clark St Akron, OH | 3.0 | 2.0 | 1029 | $1,440 | $1.40 | 43d | 1 | 0.67mi |
| 1036 Neptune Ave Akron, OH | 3.0 | 1.0 | 1000 | $1,350 | $1.35 | 43d | 1 | 0.83mi |
| 621 Hudson Ave Akron, OH | 3.0 | 1.0 | 780 | $1,100 | $1.41 | 14d | 1 | 0.84mi |
| 548 Winans Ave Akron, OH | 1.0 | 1.0 | 700 | $1,100 | $1.57 | 43d | 1 | 0.93mi |
| 530 S Main St Akron, OH | 1.0–2.0 | 1.0–2.0 | 937 | $2,195 | $2.34 | 43d | 2 | 0.94mi |
| 401 S Main St Akron, OH | 4.0 | 1.0–4.0 | 814 | $1,198 | $1.47 | 14d | 54 | 0.96mi |
| 1102 Neptune Ave Akron, OH | 3.0 | 1.0 | 1000 | $1,200 | $1.20 | 43d | 1 | 0.96mi |
| 783 E Exchange St Unit 2nd Akron, OH | 2.0 | 1.0 | 951 | $875 | $0.92 | 23d | 1 | 0.96mi |
| 22 E Exchange St Apt 123 Akron, OH | 1.0 | 1.0 | 525 | $1,164 | $2.22 | 43d | 1 | 0.96mi |
| 22 E Exchange St Unit 339 Akron, OH | 2.0 | 2.0 | 976 | $1,434 | $1.47 | 43d | 1 | 0.96mi |
Listing history 16 events
-
2026-04-23status Pending
-
2026-04-09$89,900 Active
-
2023-06-25historical
-
2022-03-14soldstatus $81,250
-
2022-03-10soldstatus $81,250 Closed 102-char remark
Show marketing remark (102 chars)
Motivated sellers. Move in condition. Many updates including huge covered rear porch. Well maintained.
-
2022-01-18status Pending 102-char remark
Show marketing remark (102 chars)
Motivated sellers. Move in condition. Many updates including huge covered rear porch. Well maintained.
-
2021-12-16$89,000 Active 102-char remark
Show marketing remark (102 chars)
Motivated sellers. Move in condition. Many updates including huge covered rear porch. Well maintained.
-
2013-01-01historical
-
2012-10-31$59,900
-
2012-10-17historical
-
2012-09-15historical
-
2012-09-14$59,900
-
2012-04-21$59,000
-
2011-06-21historical
-
2011-03-21$52,000
-
1987-08-28soldstatus $10,500
ⓘ Source: listings_history table (triggers on properties + properties_extension) + one-shot
backfill from property_details.listing_events for pre-trigger history.
Tax reassessment forecast OH · Partial reset (capped growth)
- Current annual tax
- $2,003 · $167/mo
- Projected year-2 tax
- $2,003 · $167/mo
- Expected delta
- $0/yr ($0/mo · 0.0%)
ⓘ Screening estimate from a state-policy table — verify with the county assessor before closing.
Climate risk First Street
- Flood 1/10 Low FEMA zone X (unshaded) · 0% chance over 30 yrs
- Wildfire 1/10 Low
- Heat 3/10 Moderate 7 d/yr ≥96°F today · 16 d/yr by 30 yrs out
- Wind 1/10 Low
- Air quality 3/10 Moderate 2 unhealthy d/yr today · 4 by 30 yrs out
Nearby sold comps map
Loading sold comps map…
Walkable amenities ~0.75 mi
Loading nearby amenities…
Taxation est. · year 1
- Rental income
- $12,224
- − Mortgage interest
- −$5,036
- − Property taxes
- −$2,003
- − Insurance
- −$450
- − Repairs & maintenance
- −$978
- − Management
- −$978
- − Depreciation
- −$2,615
- Taxable income
- $165
- Est. tax owed @ 24.0%
- −$40
- After-tax cash flow
- $1,508/yr
For passive investors: Depreciation is non-cash, so a rental often shows a tax loss while cash-flowing — sheltering income. Rental losses are passive: they offset passive income freely, and up to $25,000/yr can offset ordinary (W-2) income if you actively participate and your MAGI is under $100k (phasing out to $0 by $150k); unused losses carry forward. On sale, claimed depreciation is recaptured at up to 25%, and gains may owe capital-gains tax (a 1031 exchange can defer both). Figures are a year-1 estimate at your 24.0% rate — not tax advice; consult a CPA.
Schools (NCES district)
- District
- Akron City
- NCES district ID
- 3904348
- Math proficiency
- 22% ▼ -17.00%
- Reading proficiency
- 30% ▼ -12.00%
- Median HH income
- $33,811
- Composite
- 21.31/100
- National rank
- #8383
- State rank
- #602 of 656 in OH
Livability — Akron
- Score
- 81/100
- State rank
- #104
- US rank
- #1591
Category grades
Schools grade is shown separately in the Schools card above.
Census & demographics
- Census place
- Akron, OH
- County
- Summit County · 440,783 people
- City population
- 174,375
- Metro
- Akron, OH
- Population (ZIP)
- 7,547
- Household income
- $24,369
- Rent vs Own
- Severe rent burden
- 659.0
Population outlook (Summit County) Hauer SSP2
- Today (2025)
- 546,583 people
- By 2030
- 544,028 · -0.5%
- By 2040
- 531,363 · -2.8%
- By 2050
- 514,923 · -5.8%
- By 2075
- 481,765 · -11.9%
- By 2100
- 432,265 · -20.9%
Race, ethnicity, and origin ACS 2023
- Neighborhood character
- Diverse neighborhood (Simpson 0.60)
- Race & ethnicity
- White 53% Black 35% Two or more races 6% Hispanic / Latino 4% Asian 3%
- Common ancestry
- Lithuanian 2% Romanian 2% Slovak 2%
- Foreign-born
- 3% · Canada, Vietnam, Philippines
- Languages at home
- 95% English-only · Spanish 2% Other Asian/Pacific 1% Other Indo-European 1%
Political lean MEDSL · Summit
- 2024 margin
- Lean D (+7.0) · D 53.0% · R 46.0%
- 2008→2024 swing
- -9.6pp toward R · 2008: 16.6pp · 2024: 7.0pp
- All cycles
- 2024: D+7.0 2020: D+9.6 2016: D+8.2 2012: D+14.8 2008: D+16.6
Not yet ingested
- Civics
- —
Market trends
- HPI YoY
- ▼ -39.01%
- Current HPI
- 98.3809
- Rent YoY
- —
- Metro
- Akron, OH
- State GDP YoY
- ▲ 1.98%
- F500 in state
- 48
Industry mix (Fortune 500 HQ in OH)
| Industry | F500 HQs | Revenue |
|---|---|---|
| Insurance | 3 | $145B |
|
||
| Industrial Machinery | 3 | $49B |
|
||
| Financial Services | 3 | $24B |
|
||
| Consumer Goods | 2 | $93B |
|
||
| Aerospace / Defense | 2 | $47B |
|
||
| Utilities | 2 | $33B |
|
||
Price history
+756.2% since first listed16 events — show timeline
- 2026-04-23 Pending — MLSNOW
- 2026-04-09 Listed $89,900 MLSNOW
- 2023-06-25 Rental Removed — RENTEC
- 2022-03-14 Sold (Public Records) $81,250 Public Records
- 2022-03-10 Sold (MLS) $81,250 MLSNOW
- 2022-01-18 Pending — MLSNOW
- 2021-12-16 Listed $89,000 MLSNOW
- 2013-01-01 Listing Removed — MLSNOW
- 2012-10-31 Listed $59,900 MLSNOW
- 2012-10-17 Listing Removed — MLSNOW
- 2012-09-15 Listing Removed — MLSNOW
- 2012-09-14 Listed $59,900 MLSNOW
- 2012-04-21 Listed $59,000 MLSNOW
- 2011-06-21 Listing Removed — MLSNOW
- 2011-03-21 Listed $52,000 MLSNOW
- 1987-08-28 Sold (Public Records) $10,500 Public Records
Property tax history
+5.5%/yrLatest (2025): $2,003 · +0.1% YoY. Source: county tax records.
Cash-flow waterfall
monthlySold comps — $/sqft
last 12 mo · ≤1 miLoading sold comps…