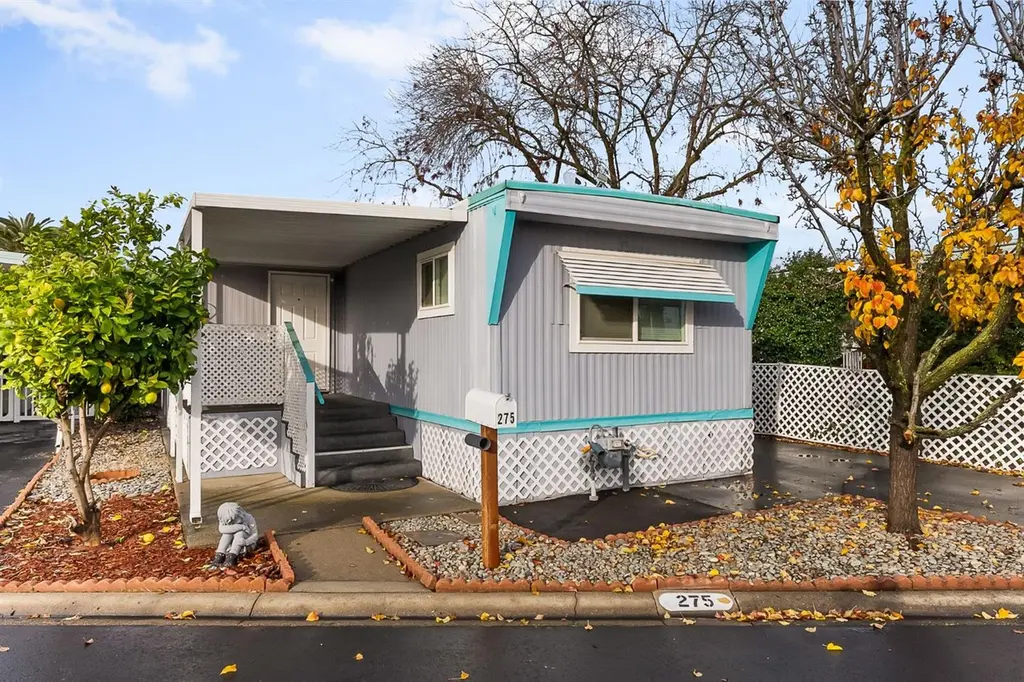
275 Heritage Glen Ln · Rancho Cordova, CA
Flood risk 4/10 · Minor
- FEMA flood zone
- X (unshaded)
- Chance of flooding over 30 yrs
- 0.22%
- Est. flood insurance / yr
- $507 – $1,088
Fire risk 4/10 · Minor
- Est. fire insurance / yr
- $659 – $1,223
Heat risk 7/10 · Major
- Hot days now (above 102°F)
- 7 days/yr
- Hot days in 30 yrs
- 16 days/yr
Wind risk 1/10 · Minimal
- Chance of severe wind over 30 yrs
- —
Air-quality risk 10/10 · Severe
- Unhealthy air days now
- 33 days/yr
- Unhealthy air days in 30 yrs
- 35 days/yr
Risk factors via First Street. Map © Google.
Why this score? — see what drove the C- grade
The composite is a weighted blend of 9 inputs, each scored 0–100. Each bar is that input's sub-score; the figure is the points it added to the 100-point composite (weight × sub-score).
- Cash flow +15.0/30.0
- ARV discount +15.0/15.0
- 1% rule +5.0/10.0
- DSCR +5.0/10.0
- Schools +4.4/10.0
- Livability +3.4/5.0
- Rent growth +2.7/5.0
- Condition / age +2.5/5.0
- Appreciation +0.0/10.0
$45,000
🖨 Deal sheet 📄 Offer letter ✓ Due diligence
Listing remarks
This charming 2 bedroom, 1 bath home is ideally located within a highly desirable 55+ Mobile Country Club community. Featuring newer flooring & updated windows, the home is truly move-in ready. Upon entering, you're welcomed into a spacious living room filled with abundant natural light from large windows, creating an inviting atmosphere. The well-appointed kitchen offers sleek white cabinetry, granite countertops & a stylish built-in coffee bar with additional storage. There is also ample space for casual dining, making the kitchen functional. In addition to two bedrooms, there is a good sized area ideal for a home office or den, providing flexibility to suit your needs. This w
Key facts
- Newer flooring
- Updated windows
- Natural light
Tags
Neighborhood map
What this means for you Summary
Snapshot
- This is a 2-bed/1.0-bath manufactured listed at $45k.
Deal economics
- At list price, monthly cash flow is $1k ($16k/yr) — positive.
- The deal already cash-flows at list — no discount required.
- Meets the 1% rule at list price ($2k rent vs $45k).
- Recommended offer: $40k (12.0% below list) — sets the bar for market timing.
- Cap rate 41.8% vs local median 3.0% in Rancho Cordova — top-decile yield for the area; either an underpriced asset or a hidden risk that comps aren't pricing in. Stress-test before assuming the spread holds.
Location & tenants
- Location reads 68/100 on livability (#268 in CA) — a middle-class / working-renter tenant base. Strengths: housing A+, employment B; Watch: schools C-, commute C-, crime D.
- San Juan Unified (suburban): math 40% / reading 62% proficiency, ranked #138 of 517 in CA (top 27%) — acceptable for families but not a draw, mixed tenant base, ~2y average lease.
- Market conditions: Rents flat; 223 active listings in the ZIP; 6 comparable units currently listed for rent nearby; rentals leasing fast (median 3d on market — plan ~1-2 weeks tenant-placement turnaround); solid renter incomes; 6,825 units permitted in Sacramento County in 2024 (1,752 in 5+ unit buildings).
Forward outlook
- Local home prices are declining (-3.0%/yr); year-one equity from $311 of loan paydown is wiped out by about $1k of value loss. Plan a longer hold.
- Sacramento County population projected at +17% by 2050 — long-run rental-demand tailwind backs the buy-and-hold thesis.
- At projected returns (-3.0% appreciation + 0.9% rent growth), your $13k cash investment doubles in ~1 year — after that, you're playing with house money.
Negotiation context
- It's been on market 177 days — a 12% lower offer ($40k) is reasonable based on typical stale-listing flexibility.
Risks & watch-outs
- Climate carrying-cost: extreme-heat days projected 7→16/yr by 2055 (HVAC capex compounding) — expect insurance premiums to compound above CPI over the hold.
Questions for the listing agent
- It's been on market 177 days. Have you received any prior offers? Is the seller open to a 12% concession, seller financing, or rate buy-down credit?
- Built in 1968 — when were the roof, HVAC, electrical panel, plumbing, and water heater last replaced?
- Why hasn't it sold? Are there any deal-killer items the seller is aware of (foundation, flood, title, zoning, code violations)?
- Is there a deadline driving the sale (1031 exchange, divorce, estate, relocation)? That informs how much negotiation room exists.
- Crime grade is D in this area — have there been break-ins, vandalism, or insurance claims at this property in the last 3 years? What carrier currently insures it and at what premium?
- What's the average days-on-market for RENTAL listings here right now (not sales)? A rising rental-DOM trend means longer vacancies and softer asking-rent achievability than the comps imply.
- What's the recent tenant-quality profile in this submarket — average credit score on applications, eviction rate, late-payment / NSF rate, and stable-employment percentage? A property-management company in the area should have these aggregated.
- How much new for-sale + rental construction is in the pipeline within 1–3 miles? Heavy new supply typically softens prices + rents 12–24 months out; constrained supply supports both.
Investment metrics
- 1% rule
- 4.62% ✓
- Cap rate
- 41.76%
- Cash-on-cash
- 126.67%
- DSCR
- 6.64
- GRM
- 1.8
CMA / ARV
- ARV (median comp)
- $68,722
- List price
- $45,000
- Delta
- -34.52%
- Verdict
- UNDERPRICED
- Comps
- 20 within 1.0 mi
Show comp detail 10 sales within ~0.75 mi
| Address | Dist | Beds/Ba | Sqft | Sold | Price | $/sf | Match |
|---|---|---|---|---|---|---|---|
| 318 Sunny Hills Dr | 0.08mi | 2/1.0 | 720 (0%) | 1mo | $41,500 | $58 | 96 |
| 247 Rocky Hills Ln | 0.07mi | 2/1.0 | 720 (0%) | 9mo | $72,000 | $100 | 89 |
| 97 97 Wilderness Rd | 0.17mi | 2/1.0 | 760 (+6%) | 1mo | $59,000 | $78 | 82 |
| 28 Golden Inn Way | 0.15mi | 2/1.0 | 700 (-3%) | 8mo | $49,000 | $70 | 82 |
| 245 Rocky Hills Ln | 0.09mi | 2/1.0 | 684 (-5%) | 8mo | $54,888 | $80 | 81 |
| 328 Sierra Vista Dr | 0.11mi | 2/1.0 | 660 (-8%) | 6mo | $96,000 | $145 | 76 |
| 234 Palm View Ln | 0.07mi | 2/1.0 | 624 (-13%) | 11mo | $56,800 | $91 | 65 |
| 117 Floral Hills Way | 0.10mi | 1/1.0 (-1) | 800 (+11%) | 11mo | $66,800 | $84 | 63 |
| 19 Golden Inn Way | 0.13mi | 2/2.0 | 816 (+13%) | 10mo | $120,000 | $147 | 60 |
| 249 Rocky Hills Ln | 0.06mi | 2/2.0 | 800 (+11%) | 24mo | $69,500 | $87 | 55 |
Match score weights: distance 35% · size 25% · config 20% · recency 20%. Top-matched comps best support the ARV.
Projected returns pro-forma
-3.0% appreciation · 0.9% rent growth · sell at horizon
- IRR
- —
- Equity multiple
- 6.81×
- Total profit
- $73,150
- Equity at exit
- $6,710
- IRR
- —
- Equity multiple
- 13.38×
- Total profit
- $155,990
- Equity at exit
- $3,891
Cash invested: $12,600 (down + closing). Projections, not guarantees.
Landlord ↔ Tenant lean methodology
- Overall (STATE)
- 18 Strongly Tenant-Friendly
- State California
- 18 Strongly Tenant-Friendly · D+13
- County
- — inherits STATE
- City
- — inherits STATE
ZIP-level market 95670
- Rents YoY
- 0.9%
- Active inventory
- 223
- Price-to-rent
- 1.8×
Monthly cashflow live
- Estimated rent
- $2,077 high interval (Pro) →
- Mortgage (P&I)
- −$236
- Tax est. 1.5%
- −$56 /mo · $675/yr
- Insurance
- −$19
- HOA
- −$0
- Vacancy / Maint / Mgmt
- −$436
- Net cashflow
- $1,330
Break-even live
UW: 25.0% down · 7.5% · 30yr · 1.5% tax · 5.0% vac · 8.0% maint · 8.0% mgmt
Financing live
Cash to close
- Down payment
- $11,250
- Closing costs
- $1,350
- Reserves months
- —
- Total cash needed
- —
Loan-product check · same deal, 3 products live
Conventional
25% down · 7.5% · 30yr
- Down + closing
- —
- Monthly P&I
- —
- Monthly cashflow
- —
- DSCR
- —
- Eligible?
- —
Personal DTI + credit; lowest rate.
DSCR
20% down · 8.5% · 30yr
- Down + closing
- —
- Monthly P&I
- —
- Monthly cashflow
- —
- DSCR
- —
- Eligible?
- —
No personal income docs; deal must DSCR.
Hard money
10% down · 12.0% · 12mo
- Down + closing
- —
- Monthly P&I
- —
- Monthly cashflow
- —
- DSCR
- —
- Eligible?
- —
Short-term bridge; refi at stabilization.
Rent comps 6 comps
| Address | Beds | Baths | Sqft | Rent | $/sqft | DOM | Units | Dist |
|---|---|---|---|---|---|---|---|---|
| 2330 Vehicle Dr Rancho Cordova, CA | 1.0–2.0 | 1.0–2.0 | 847 | $2,225 | $2.63 | 2d | 1 | 0.31mi |
| 2330 Vehicle Dr Rancho Cordova, CA | 1.0–2.0 | 1.0–2.0 | 847 | $2,230 | $2.63 | 20d | 9 | 0.31mi |
| 11260 Point East Dr Rancho Cordova, CA | 1.0–2.0 | 1.0 | 615 | $1,985 | $3.23 | 2d | 29 | 0.41mi |
| 11070 Hirschfeld Way Rancho Cordova, CA | 1.0–2.0 | 1.0 | 800 | $1,880 | $2.35 | 3d | 4 | 0.43mi |
| 10780 Coloma Rd Rancho Cordova, CA | 1.0–2.0 | 1.0 | 760 | $1,515 | $1.99 | 3d | 7 | 0.97mi |
| 10680 Coloma Rd Rancho Cordova, CA | 1.0–2.0 | 1.0 | 730 | $1,889 | $2.59 | 2d | 11 | 1.20mi |
Listing history 14 events
-
2026-06-18days on market $45,000 Active 177 DOM
-
2026-06-17days on market $45,000 Active 176 DOM
-
2026-06-16days on market $45,000 Active 175 DOM
-
2026-06-15days on market $45,000 Active 174 DOM
-
2026-06-13days on market $45,000 Active 172 DOM
-
2026-06-13pricedays on market $45,000 Active 171 DOM
-
2026-06-09days on market $50,000 Active 168 DOM
-
2026-06-08days on market $50,000 Active 167 DOM
-
2026-06-07days on market $50,000 Active 166 DOM
-
2026-06-05days on market $50,000 Active 163 DOM
-
2026-06-03days on market $50,000 Active 162 DOM
-
2026-06-02days on market $50,000 Active 161 DOM
-
2026-06-01days on market $50,000 Active 160 DOM
-
2026-05-31days on market $50,000 Active 159 DOM
ⓘ Source: listings_history table (triggers on properties + properties_extension) + one-shot
backfill from property_details.listing_events for pre-trigger history.
Climate risk First Street
- Flood 4/10 Moderate FEMA zone X (unshaded) · 22% chance over 30 yrs
- Wildfire 4/10 Moderate
- Heat 7/10 Severe 7 d/yr ≥102°F today · 16 d/yr by 30 yrs out
- Wind 1/10 Low
- Air quality 10/10 Extreme 33 unhealthy d/yr today · 35 by 30 yrs out
Nearby sold comps map
Loading sold comps map…
Walkable amenities ~0.75 mi
Loading nearby amenities…
Taxation est. · year 1
- Rental income
- $24,927
- − Mortgage interest
- −$2,521
- − Property taxes
- −$675
- − Insurance
- −$225
- − Repairs & maintenance
- −$1,994
- − Management
- −$1,994
- − Depreciation
- −$1,309
- Taxable income
- $16,209
- Est. tax owed @ 24.0%
- −$3,890
- After-tax cash flow
- $12,070/yr
For passive investors: Depreciation is non-cash, so a rental often shows a tax loss while cash-flowing — sheltering income. Rental losses are passive: they offset passive income freely, and up to $25,000/yr can offset ordinary (W-2) income if you actively participate and your MAGI is under $100k (phasing out to $0 by $150k); unused losses carry forward. On sale, claimed depreciation is recaptured at up to 25%, and gains may owe capital-gains tax (a 1031 exchange can defer both). Figures are a year-1 estimate at your 24.0% rate — not tax advice; consult a CPA.
Schools (NCES district)
- District
- San Juan Unified
- NCES district ID
- 0634620
- Math proficiency
- 40% ▲ 3.00%
- Reading proficiency
- 62% ▲ 16.00%
- Median HH income
- $55,655
- Composite
- 44.07/100
- National rank
- #2878
- State rank
- #138 of 517 in CA
Livability — Rancho Cordova
- Score
- 68/100
- State rank
- #268
- US rank
- #9126
Category grades
Schools grade is shown separately in the Schools card above.
Census & demographics
- Census place
- Rancho Cordova, CA
- County
- Sacramento County · 1,539,646 people
- City population
- 98,329
- Metro
- Sacramento-Roseville-Folsom, CA
- Population (ZIP)
- 58,819
- Household income
- $89,484
- Rent vs Own
- Severe rent burden
- 2389.0
Population outlook (Sacramento County) Hauer SSP2
- Today (2025)
- 1,660,763 people
- By 2030
- 1,732,990 · +4.3%
- By 2040
- 1,855,755 · +11.7%
- By 2050
- 1,941,335 · +16.9%
- By 2075
- 2,046,162 · +23.2%
- By 2100
- 1,961,444 · +18.1%
Race, ethnicity, and origin ACS 2023
- Neighborhood character
- Diverse neighborhood (Simpson 0.67)
- Race & ethnicity
- White 51% Hispanic / Latino 21% Two or more races 12% Asian 12% Black 10% Native American 1%
- Hispanic origin (detail)
- Mexican 17%
- Common ancestry
- Scotch-Irish 2% Subsaharan African 2% Italian 2%
- Foreign-born
- 24% · Canada, Vietnam, South Korea
- Languages at home
- 66% English-only · Spanish 13% Other Indo-European 7% Russian/Polish/Slavic 5%
Political lean MEDSL · Sacramento
- 2024 margin
- D (+19.7) · D 58.1% · R 38.4% · Other 3.5%
- 2008→2024 swing
- +0.7pp no change · 2008: 19.0pp · 2024: 19.7pp
- All cycles
- 2024: D+19.7 2020: D+25.3 2016: D+23.7 2012: D+16.3 2008: D+19.0
Not yet ingested
- Civics
- —
Market trends
- HPI YoY
- ▼ -263.38%
- Current HPI
- 300.0788
- Rent YoY
- ▲ 0.90%
- Metro
- Sacramento-Roseville-Folsom, CA
- State GDP YoY
- ▲ 3.21%
- F500 in state
- 116
Industry mix (Fortune 500 HQ in CA)
| Industry | F500 HQs | Revenue |
|---|---|---|
| Technology | 27 | $1,492B |
|
||
| Financial Services | 3 | $174B |
|
||
| Retail | 3 | $44B |
|
||
| Insurance | 3 | $26B |
|
||
| Media / Entertainment | 2 | $115B |
|
||
| Pharmaceuticals / Biotech | 2 | $62B |
|
||
Cash-flow waterfall
monthlySold comps — $/sqft
last 12 mo · ≤1 miLoading sold comps…