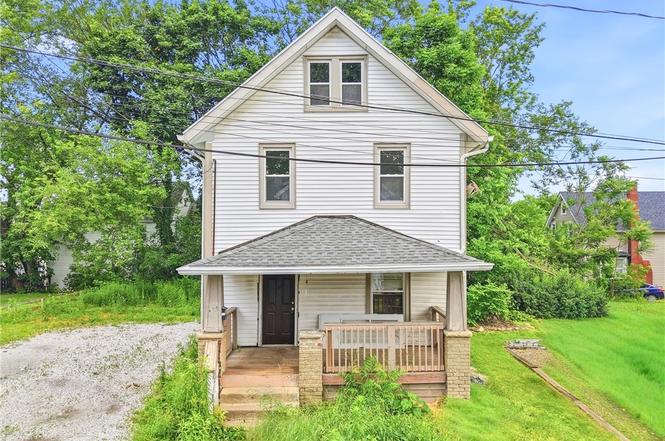
285 Sumner Ct · Akron, OH
Flood risk 1/10 · Minimal
- FEMA flood zone
- X (unshaded)
- Chance of flooding over 30 yrs
- 0.0%
- Est. flood insurance / yr
- $473 – $860
Fire risk 1/10 · Minimal
- Est. fire insurance / yr
- $713 – $1,323
Heat risk 3/10 · Minor
- Hot days now (above 97°F)
- 7 days/yr
- Hot days in 30 yrs
- 17 days/yr
Wind risk 1/10 · Minimal
- Chance of severe wind over 30 yrs
- —
Air-quality risk 3/10 · Minor
- Unhealthy air days now
- 2 days/yr
- Unhealthy air days in 30 yrs
- 4 days/yr
Risk factors via First Street. Map © Google.
Why this score? — see what drove the D+ grade
The composite is a weighted blend of 9 inputs, each scored 0–100. Each bar is that input's sub-score; the figure is the points it added to the 100-point composite (weight × sub-score).
- Cash flow +22.6/30.0
- DSCR +7.3/10.0
- 1% rule +6.0/10.0
- Livability +4.0/5.0
- Rent growth +2.5/5.0
- Condition / age +2.5/5.0
- Schools +2.1/10.0
- ARV discount +0.0/15.0
- Appreciation +0.0/10.0
$125,000
🖨 Deal sheet 📄 Offer letter ✓ Due diligence
Listing remarks MLS
This University of Akron rental property stands out for its recent updates and convenient location. The house features newer vinyl windows, roof, and vinyl siding. Significant improvements have been made including a fully updated kitchen. Both full bathrooms have newer counters and cabinets, the entire first floor has newer vinyl flooring, the electrical system has been upgraded including new wiring and electric panel, furnace and hot water tank have been replaced, plumbing upgrades have been made, the main support beam has been reinforced, and extensive insulation has been added. , The third floor has been divided into two bedrooms, bringing the total bedroom count to five. Additionally, the first-floor dining room could serve as a sixth bedroom, as it includes a closet. For security, most of the first-floor windows have additional frames to prevent unauthorized entry. The front porch has been updated with new decking, and the egress entry from the third floor has been rebuilt. , Located close to campus and situated on the Roo Line, this property offers a quiet setting on a dead-end court. The double lot provides ample off-street parking for 8-10 cars, and the fenced parking area includes high-security lighting and installed cameras that will remain with the house. Property currently has 4 tenants and provides good monthly cash flow. However, there is room for 2 more tenants and potential for even better monthly cash flow. .. hurry, this one is a great campus rental and won't last! GREAT OPPORTUNITY FOR AN INVESTOR OR PARENT OF A COLLEGE STUDENT!
Key facts
- 4,356 sq ft lot
- Parking
- Built 1919
Property features AI
Exterior
- Parking: Additional parking; Gravel parking area
- Utilities: Public water; Public sewer
- Home design: 2 stories (3 total levels); Asphalt roof; Aluminum siding construction; Block foundation; Built (year per public records)
- Exterior features: Front porch
Interior
- Bedrooms: 1 main-level bedroom
- Bathrooms: 2 full bathrooms; 1 main-level bathroom
- Heating & cooling: Gas heating; Ceiling fan cooling
- Interior features: Full basement
Neighborhood map
What this means for you Summary
Snapshot
- This is a 5-bed/2.0-bath single-family listed at $125k.
Deal economics
- At list price, monthly cash flow is $214 ($3k/yr) — positive.
- The deal already cash-flows at list — no discount required.
- Meets the 1% rule at list price ($1k rent vs $125k).
- Cap rate 8.3% vs local median 6.6% in Akron — meaningfully above typical; check what's discounted (condition, days-on-market, listing class) to confirm the premium yield is real.
Location & tenants
- Location reads 81/100 on livability (#104 in OH, #1,591 nationally) — a professional / high-income tenant draw. Strengths: amenities A+, commute A+, cost of living A+; Watch: crime F, employment F.
- Akron City (urban): math 22% / reading 30% proficiency, ranked #602 of 656 in OH (top 92%) — low school quality limits family demand, transient renter base, plan for 1-2y turnover; 66% free/reduced lunch — lower-income household profile, screen leases tightly.
- Market conditions: 54 active listings in the ZIP; 32 comparable units currently listed for rent nearby; rentals lingering (median 44d on market — plan ~5-8 weeks vacancy on turnover, expect pricing pressure); 66% of comp listings sitting > 30 days — soft ceiling on asking rent; lower-income renter base — watch delinquency; 1,114 units permitted in Summit County in 2024 (397 in 5+ unit buildings).
- At $1,381/mo this rent would consume 68% of the median local household income ($24k/yr) (locally 659% of renters already pay >50% of income on rent) — very limited rent-growth headroom before tenants either downsize or default.
Forward outlook
- Local home prices are declining (-3.0%/yr); year-one equity from $864 of loan paydown is wiped out by about $4k of value loss. Plan a longer hold.
- Summit County population projected to shrink 6% by 2050 — rents likely to lag national; underwrite the cash flow, not the appreciation.
Negotiation context
- Only 1 days on market — expect competitive offers; lowballing is unlikely to land.
- 16 sale attempts since 32y ago with the ask held roughly flat each time — persistent listings suggest the price (not the market) is what's stuck; bring a comps-based counter.
Risks & watch-outs
- Watch-outs: built in 1919 — expect roof / HVAC / electrical / plumbing capex.
Questions for the listing agent
- Built in 1919 — when were the roof, HVAC, electrical panel, plumbing, and water heater last replaced?
- Is there a deadline driving the sale (1031 exchange, divorce, estate, relocation)? That informs how much negotiation room exists.
- Crime grade is F in this area — have there been break-ins, vandalism, or insurance claims at this property in the last 3 years? What carrier currently insures it and at what premium?
- The area grade is low — what's the realistic commute time and amenity access for the typical tenant pool here? Any planned neighborhood developments (good or bad) we should know about?
- What's the average days-on-market for RENTAL listings here right now (not sales)? A rising rental-DOM trend means longer vacancies and softer asking-rent achievability than the comps imply.
- What's the recent tenant-quality profile in this submarket — average credit score on applications, eviction rate, late-payment / NSF rate, and stable-employment percentage? A property-management company in the area should have these aggregated.
- How much new for-sale + rental construction is in the pipeline within 1–3 miles? Heavy new supply typically softens prices + rents 12–24 months out; constrained supply supports both.
Investment metrics
- 1% rule
- 1.10% ✓
- Cap rate
- 8.34%
- Cash-on-cash
- 7.33%
- DSCR
- 1.33
- GRM
- 7.5
CMA / ARV
- ARV (on-the-fly)
- $99,684
- Comps found
- 12
Show comp detail 12 sales within ~0.75 mi
| Address | Dist | Beds/Ba | Sqft | Sold | Price | $/sf | Match |
|---|---|---|---|---|---|---|---|
| 661 Sumner St | 0.11mi | 5/2.0 | 1,449 (+3%) | 12mo | $50,000 | $35 | 79 |
| 647 Sherman St | 0.11mi | 4/2.0 (-1) | 1,428 (+2%) | 11mo | $64,000 | $45 | 78 |
| 650 Kling St | 0.24mi | 4/2.0 (-1) | 1,456 (+4%) | 3mo | $158,000 | $109 | 75 |
| 463 Allyn St | 0.25mi | 5/2.0 | 1,476 (+5%) | 8mo | $105,000 | $71 | 73 |
| 424 E Thornton St | 0.25mi | 4/1.5 (-1) | 1,445 (+3%) | 15mo | $115,000 | $80 | 64 |
| 682 Brown St | 0.37mi | 4/1.5 (-1) | 1,375 (-2%) | 11mo | $125,000 | $91 | 63 |
| 508 Crouse St | 0.57mi | 4/2.0 (-1) | 1,370 (-2%) | 2mo | $62,500 | $46 | 63 |
| 289 Sumner Ct | 0.01mi | 4/2.0 (-1) | 1,233 (-12%) | 14mo | $87,650 | $71 | 62 |
| 642 Brown St | 0.32mi | 4/1.0 (-1) | 1,457 (+4%) | 11mo | $101,028 | $69 | 60 |
| 713 Kling St | 0.35mi | 4/1.0 (-1) | 1,302 (-7%) | 5mo | $75,000 | $58 | 58 |
| 885 Brown St | 0.70mi | 4/2.0 (-1) | 1,280 (-9%) | 2mo | $93,500 | $73 | 46 |
| 275 Fountain St | 0.74mi | 5/2.0 | 1,578 (+12%) | 9mo | $109,000 | $69 | 37 |
Match score weights: distance 35% · size 25% · config 20% · recency 20%. Top-matched comps best support the ARV.
Projected returns pro-forma
-3.0% appreciation · 3.0% rent growth · sell at horizon
- IRR
- -5.1%
- Equity multiple
- 0.81×
- Total profit
- $-6,617
- Equity at exit
- $18,638
- IRR
- 4.6%
- Equity multiple
- 1.34×
- Total profit
- $11,880
- Equity at exit
- $10,808
Cash invested: $35,000 (down + closing). Projections, not guarantees.
Landlord ↔ Tenant lean methodology
- Overall (STATE)
- 73 Landlord-Friendly
- State Ohio
- 73 Landlord-Friendly · R+6
- County
- — inherits STATE
- City
- — inherits STATE
ZIP-level market 44311
- Home prices YoY
- -28.4%
- Active inventory
- 54
- Price-to-rent
- 7.5×
Monthly cashflow live
- Estimated rent
- $1,381 high interval (Pro) →
- Mortgage (P&I)
- −$656
- Tax from tax record
- −$169 /mo · $2,034/yr
- Insurance
- −$52
- HOA
- −$0
- Vacancy / Maint / Mgmt
- −$290
- Net cashflow
- $214
Break-even live
UW: 25.0% down · 7.5% · 30yr · 1.5% tax · 5.0% vac · 8.0% maint · 8.0% mgmt
Financing live
Cash to close
- Down payment
- $31,250
- Closing costs
- $3,750
- Reserves months
- —
- Total cash needed
- —
Loan-product check · same deal, 3 products live
Conventional
25% down · 7.5% · 30yr
- Down + closing
- —
- Monthly P&I
- —
- Monthly cashflow
- —
- DSCR
- —
- Eligible?
- —
Personal DTI + credit; lowest rate.
DSCR
20% down · 8.5% · 30yr
- Down + closing
- —
- Monthly P&I
- —
- Monthly cashflow
- —
- DSCR
- —
- Eligible?
- —
No personal income docs; deal must DSCR.
Hard money
10% down · 12.0% · 12mo
- Down + closing
- —
- Monthly P&I
- —
- Monthly cashflow
- —
- DSCR
- —
- Eligible?
- —
Short-term bridge; refi at stabilization.
Rent comps 32 comps
| Address | Beds | Baths | Sqft | Rent | $/sqft | DOM | Units | Dist |
|---|---|---|---|---|---|---|---|---|
| 288 Cross St Akron, OH | 4.0 | 2.0 | 1512 | $1,295 | $0.86 | 43d | 1 | 0.05mi |
| 566 Sumner St Akron, OH | 4.0 | 1.0 | 1170 | $1,200 | $1.03 | 43d | 1 | 0.06mi |
| 600 Sherman St Akron, OH | 4.0 | 1.0–2.0 | 824 | $1,600 | $1.94 | 14d | 14 | 0.09mi |
| 497 Sumner St Akron, OH | 5.0 | 2.0 | 1776 | $1,295 | $0.73 | 43d | 1 | 0.19mi |
| 356 Rankin St Akron, OH | 4.0 | 1.5 | 1186 | $1,197 | $1.01 | 23d | 1 | 0.21mi |
| 548 Spicer St Akron, OH | 4.0 | 2.0 | 1487 | $1,100 | $0.74 | 23d | 1 | 0.33mi |
| 406 Sumner St Akron, OH | 2.0–4.0 | 1.0–2.0 | 836 | $1,295 | $1.55 | 14d | 3 | 0.35mi |
| 768 Beardsley St Akron, OH | 5.0 | 1.5 | 1714 | $1,500 | $0.88 | 14d | 1 | 0.41mi |
| 490 Gage St Akron, OH | 4.0 | 1.0 | 1326 | $1,053 | $0.79 | 43d | 1 | 0.43mi |
| 796 Brown St Akron, OH | 4.0 | 2.0 | 1200 | $900 | $0.75 | 43d | 1 | 0.54mi |
| 401 S Main St Akron, OH | 4.0 | 1.0–4.0 | 814 | $1,871 | $2.30 | 14d | 54 | 0.66mi |
| 885 Brown St Akron, OH | 4.0 | 2.0 | 1280 | $1,400 | $1.09 | 23d | 1 | 0.70mi |
| 1139 Marcy St Akron, OH | 4.0 | 1.5 | 1300 | $1,300 | $1.00 | 43d | 1 | 0.82mi |
| 1012 Brown St Akron, OH | 4.0 | 2.0 | 1518 | $1,295 | $0.85 | 43d | 1 | 0.92mi |
| 1028 Kling St Akron, OH | 4.0 | 2.0 | 1500 | $1,450 | $0.97 | 43d | 1 | 0.92mi |
| 783 Boulevard St Akron, OH | 4.0 | 1.0 | 1440 | $999 | $0.69 | 23d | 1 | 1.06mi |
| 466 Adkins Ave Akron, OH | 4.0 | 1.5 | 1800 | $1,450 | $0.81 | 43d | 1 | 1.07mi |
| 1282 Andrus St Akron, OH | 4.0 | 1.0 | 1242 | $1,195 | $0.96 | 43d | 1 | 1.10mi |
| 1040 Neptune Ave Akron, OH | 4.0 | 1.0 | 1400 | $1,300 | $0.93 | 43d | 1 | 1.10mi |
| 1085 Herberich Ave Akron, OH | 4.0 | 1.0 | 1350 | $1,400 | $1.04 | 43d | 1 | 1.10mi |
| 1114 Herberich Ave Akron, OH | 4.0 | 1.0 | 1308 | $1,200 | $0.92 | 43d | 1 | 1.17mi |
| 1071 Ackley St Akron, OH | 4.0 | 2.0 | 1164 | $1,175 | $1.01 | 43d | 1 | 1.24mi |
| 516 Whitney Ave Akron, OH | 4.0 | 2.0 | 1676 | $1,500 | $0.89 | 43d | 1 | 1.27mi |
| 1368 Moore St Akron, OH | 4.0 | 1.0 | 1575 | $1,300 | $0.83 | 43d | 1 | 1.27mi |
| 1289 Girard St Akron, OH | 5.0 | 1.0 | 1119 | $1,350 | $1.21 | 43d | 1 | 1.33mi |
| 949 Raymond St Akron, OH | 5.0 | 1.0 | 1564 | $1,150 | $0.74 | 43d | 1 | 1.35mi |
| 846 Lee Dr Akron, OH | 4.0 | 1.0 | 1433 | $1,325 | $0.92 | 14d | 1 | 1.40mi |
| 846 Lee Dr Akron, OH | 4.0 | 1.5 | 1433 | $1,325 | $0.92 | 23d | 1 | 1.40mi |
| 488 Alexander St Akron, OH | 4.0 | 2.0 | 1311 | $1,350 | $1.03 | 23d | 1 | 1.42mi |
| 67 E Archwood Ave Unit B Akron, OH | 4.0 | 1.0 | 1200 | $1,050 | $0.88 | 43d | 1 | 1.48mi |
| 207 Crosby St Akron, OH | 4.0 | 1.0 | 1200 | $1,395 | $1.16 | 43d | 1 | 1.50mi |
| 77 Kent Ct Akron, OH | 4.0 | 1.0 | 1300 | $1,200 | $0.92 | 43d | 1 | 1.50mi |
Listing history 1 events
-
2026-06-17$125,000 Active 1 DOM
ⓘ Source: listings_history table (triggers on properties + properties_extension) + one-shot
backfill from property_details.listing_events for pre-trigger history.
Tax reassessment forecast OH · Partial reset (capped growth)
- Current annual tax
- $2,034 · $169/mo
- Projected year-2 tax
- $2,034 · $169/mo
- Expected delta
- $0/yr ($0/mo · 0.0%)
ⓘ Screening estimate from a state-policy table — verify with the county assessor before closing.
Climate risk First Street
- Flood 1/10 Low FEMA zone X (unshaded) · 0% chance over 30 yrs
- Wildfire 1/10 Low
- Heat 3/10 Moderate 7 d/yr ≥97°F today · 17 d/yr by 30 yrs out
- Wind 1/10 Low
- Air quality 3/10 Moderate 2 unhealthy d/yr today · 4 by 30 yrs out
Nearby sold comps map
Loading sold comps map…
Walkable amenities ~0.75 mi
Loading nearby amenities…
Taxation est. · year 1
- Rental income
- $16,568
- − Mortgage interest
- −$7,002
- − Property taxes
- −$2,034
- − Insurance
- −$625
- − Repairs & maintenance
- −$1,325
- − Management
- −$1,325
- − Depreciation
- −$3,636
- Taxable income
- $620
- Est. tax owed @ 24.0%
- −$149
- After-tax cash flow
- $2,415/yr
For passive investors: Depreciation is non-cash, so a rental often shows a tax loss while cash-flowing — sheltering income. Rental losses are passive: they offset passive income freely, and up to $25,000/yr can offset ordinary (W-2) income if you actively participate and your MAGI is under $100k (phasing out to $0 by $150k); unused losses carry forward. On sale, claimed depreciation is recaptured at up to 25%, and gains may owe capital-gains tax (a 1031 exchange can defer both). Figures are a year-1 estimate at your 24.0% rate — not tax advice; consult a CPA.
Schools (NCES district)
- District
- Akron City
- NCES district ID
- 3904348
- Math proficiency
- 22% ▼ -17.00%
- Reading proficiency
- 30% ▼ -12.00%
- Median HH income
- $33,811
- Composite
- 21.31/100
- National rank
- #8383
- State rank
- #602 of 656 in OH
Livability — Akron
- Score
- 81/100
- State rank
- #104
- US rank
- #1591
Category grades
Schools grade is shown separately in the Schools card above.
Census & demographics
- Census place
- Akron, OH
- County
- Summit County · 440,783 people
- City population
- 174,375
- Metro
- Akron, OH
- Population (ZIP)
- 7,547
- Household income
- $24,369
- Rent vs Own
- Severe rent burden
- 659.0
Population outlook (Summit County) Hauer SSP2
- Today (2025)
- 546,583 people
- By 2030
- 544,028 · -0.5%
- By 2040
- 531,363 · -2.8%
- By 2050
- 514,923 · -5.8%
- By 2075
- 481,765 · -11.9%
- By 2100
- 432,265 · -20.9%
Race, ethnicity, and origin ACS 2023
- Neighborhood character
- Diverse neighborhood (Simpson 0.60)
- Race & ethnicity
- White 53% Black 35% Two or more races 6% Hispanic / Latino 4% Asian 3%
- Common ancestry
- Lithuanian 2% Romanian 2% Slovak 2%
- Foreign-born
- 3% · Canada, Vietnam, Philippines
- Languages at home
- 95% English-only · Spanish 2% Other Asian/Pacific 1% Other Indo-European 1%
Political lean MEDSL · Summit
- 2024 margin
- Lean D (+7.0) · D 53.0% · R 46.0%
- 2008→2024 swing
- -9.6pp toward R · 2008: 16.6pp · 2024: 7.0pp
- All cycles
- 2024: D+7.0 2020: D+9.6 2016: D+8.2 2012: D+14.8 2008: D+16.6
Not yet ingested
- Civics
- —
Market trends
- HPI YoY
- ▼ -39.01%
- Current HPI
- 98.3809
- Rent YoY
- —
- Metro
- Akron, OH
- State GDP YoY
- ▲ 1.98%
- F500 in state
- 48
Industry mix (Fortune 500 HQ in OH)
| Industry | F500 HQs | Revenue |
|---|---|---|
| Insurance | 3 | $145B |
|
||
| Industrial Machinery | 3 | $49B |
|
||
| Financial Services | 3 | $24B |
|
||
| Consumer Goods | 2 | $93B |
|
||
| Aerospace / Defense | 2 | $47B |
|
||
| Utilities | 2 | $33B |
|
||
Price history
+481.4% since first listed46 events — show timeline
- 2026-06-17 Listed $125,000 MLSNOW
- 2024-10-09 Rental Removed $995 RENTALBEAST
- 2024-09-21 Price Changed $995 RENTALBEAST
- 2024-09-08 Price Changed $1,095 RENTALBEAST
- 2024-09-05 Listed for Rent $1,195 RENTALBEAST
- 2024-09-05 Rental Removed $1,095 RENTEC
- 2024-09-05 Price Changed $1,095 RENTEC
- 2024-08-15 Listed for Rent $1,195 RENTEC
- 2024-05-03 Sold (Public Records) $113,001 Public Records
- 2024-05-03 Sold (MLS) $113,001 MLSNOW
- 2024-03-26 Pending — MLSNOW
- 2024-03-20 Listed $114,900 MLSNOW
- 2021-04-01 Sold (Public Records) $76,400 Public Records
- 2021-03-29 Sold (MLS) $76,900 MLSNOW
- 2021-03-03 Pending — MLSNOW
- 2021-02-12 Listed $74,900 MLSNOW
- 2015-08-31 Sold (Public Records) $34,900 Public Records
- 2015-08-28 Sold (MLS) $34,900 MLSNOW
- 2015-06-01 Relisted — MLSNOW
- 2015-05-07 Pending — MLSNOW
- 2015-03-04 Listed $34,900 MLSNOW
- 2012-12-21 Sold (Public Records) $20,000 Public Records
- 2012-12-21 Sold (MLS) $20,000 MLSNOW
- 2012-10-08 Listed $24,900 MLSNOW
- 2008-05-12 Sold (Public Records) $38,100 Public Records
- 2005-11-04 Sold (MLS) $20,000 MLSNOW
- 2005-11-03 Sold (Public Records) $20,000 Public Records
- 2005-08-09 Listing Removed — MLSNOW
- 2005-02-09 Listed $27,900 MLSNOW
- 2004-05-25 Sold (Public Records) $22,500 Public Records
- 1999-09-30 Listed $39,900 MLSNOW
- 1997-01-22 Sold (Public Records) $34,815 Public Records
- 1996-12-04 Listed $39,900 MLSNOW
- 1996-10-10 Listing Removed — MLSNOW
- 1996-04-03 Listed $47,900 MLSNOW
- 1996-04-01 Sold (Public Records) $33,500 Public Records
- 1996-02-29 Listed $36,900 MLSNOW
- 1995-08-04 Listing Removed — MLSNOW
- 1995-08-04 Listing Removed — MLSNOW
- 1995-05-06 Listed $34,900 MLSNOW
- 1995-02-07 Listed $34,900 MLSNOW
- 1994-12-06 Listing Removed — MLSNOW
- 1994-06-08 Listed $39,900 MLSNOW
- 1992-09-03 Sold (Public Records) $35,000 Public Records
- 1990-05-04 Sold (Public Records) $20,000 Public Records
- 1985-05-29 Sold (Public Records) $21,500 Public Records
Property tax history
+3.9%/yrLatest (2025): $2,034 · +0.2% YoY. Source: county tax records.
Cash-flow waterfall
monthlySold comps — $/sqft
last 12 mo · ≤1 miLoading sold comps…