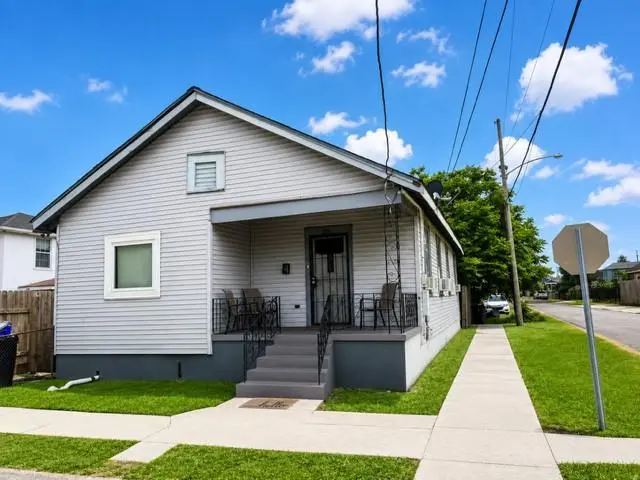
1901 Independence St · New Orleans, LA
Flood risk 9/10 · Severe
- FEMA flood zone
- X (shaded)
- Chance of flooding over 30 yrs
- 0.99%
- Est. flood insurance / yr
- $507 – $1,088
Fire risk 3/10 · Minor
- Est. fire insurance / yr
- $1,269 – $2,357
Heat risk 10/10 · Severe
- Hot days now (above 108°F)
- 7 days/yr
- Hot days in 30 yrs
- 22 days/yr
Wind risk 10/10 · Severe
- Chance of severe wind over 30 yrs
- 99.0%
Air-quality risk 3/10 · Minor
- Unhealthy air days now
- 3 days/yr
- Unhealthy air days in 30 yrs
- 3 days/yr
Risk factors via First Street. Map © Google.
Why this score? — see what drove the C+ grade
The composite is a weighted blend of 9 inputs, each scored 0–100. Each bar is that input's sub-score; the figure is the points it added to the 100-point composite (weight × sub-score).
- Cash flow +24.3/30.0
- ARV discount +15.0/15.0
- DSCR +7.8/10.0
- 1% rule +5.6/10.0
- Livability +4.0/5.0
- Rent growth +3.1/5.0
- Condition / age +2.5/5.0
- Schools +1.6/10.0
- Appreciation +0.0/10.0
$157,500
🖨 Deal sheet 📄 Offer letter ✓ Due diligence
Listing remarks MLS
Opportunity Knocks! This 3-bedroom, 1-bath home sits on a desirable corner lot and offers approximately 1,250 sq ft of living space plus a versatile flex room perfect for an office, playroom, guest space, or extra storage. With solid bones and endless potential, this property is ideal for investors, renovators, or buyers ready to bring their vision to life. A little TLC will go a long way in transforming this home into something special. Don't miss the chance to make it your own!
Key facts
- 2,944 sq ft lot
- Built 1961
- Listed 22 days
Property features AI
Finance
- Other: Information not provided
- Financial info: Information not provided
- HOA & community: Information not provided
Exterior
- Parking: Information not provided
- Security: Information not provided
- Utilities: Public water; Public sewer
- Home design: Single-story home; Raised foundation; Shingle roof
- Construction: Information not provided
- Exterior features: City lot; Rectangular lot; Lot dimensions approximately 31 x 95
Interior
- Kitchen: Information not provided
- Bedrooms: Information not provided
- Flooring: Information not provided
- Bathrooms: 1 full bathroom
- Heating & cooling: Window unit heating; Window unit cooling
- Interior features: 6 total rooms; Average condition
- Laundry & utility: Information not provided
Neighborhood map
What this means for you Summary
Snapshot
- This is a 3-bed/1.0-bath single-family listed at $158k.
Deal economics
- At list price, monthly cash flow is $250 ($3k/yr) — positive.
- The deal already cash-flows at list — no discount required.
- Meets the 1% rule at list price ($2k rent vs $158k).
- Recommended offer: $155k (1.5% below list) — sets the bar for market timing.
- Cap rate 8.7% vs local median 4.4% in New Orleans — top-decile yield for the area; either an underpriced asset or a hidden risk that comps aren't pricing in. Stress-test before assuming the spread holds.
Location & tenants
- Location reads 81/100 on livability (#3 in LA, #1,383 nationally) — a professional / high-income tenant draw. Strengths: amenities A+, commute A+, health & safety A+; Watch: crime C-, employment D.
- Orleans Parish (urban): math 11% / reading 27% proficiency, ranked #69 of 98 in LA (top 70%) — low school quality limits family demand, transient renter base, plan for 1-2y turnover; 68% free/reduced lunch — lower-income household profile, screen leases tightly.
- Market conditions: Rents rising (+2.5%/yr); 581 active listings in the ZIP; 40 comparable units currently listed for rent nearby; rentals at typical pace (median 24d on market — plan ~3-4 weeks tenant-placement turnaround); 710 units permitted in Orleans Parish in 2024 (244 in 5+ unit buildings).
- This rent runs 44% of the median local income ($46k/yr) — at the standard rent-burdened threshold; future hikes will face affordability resistance.
Forward outlook
- Local home prices are declining (-3.0%/yr); year-one equity from $1k of loan paydown is wiped out by about $5k of value loss. Plan a longer hold.
- Orleans County population projected at +61% by 2050 — long-run rental-demand tailwind backs the buy-and-hold thesis.
Negotiation context
- It's been on market 22 days — a 2% lower offer ($155k) is reasonable based on typical stale-listing flexibility.
- 8 sale attempts since 31y ago with the ask held roughly flat each time — persistent listings suggest the price (not the market) is what's stuck; bring a comps-based counter.
- Current owner paid $25k; list at $158k implies a 533% gain — meaningful room to come down on a strong offer.
Risks & watch-outs
- Watch-outs: flood insurance adds $66/mo.
- Climate carrying-cost: severe flood risk; severe wind risk, 99% chance of damaging wind over 30y; extreme-heat days projected 7→22/yr by 2055 (HVAC capex compounding) — expect insurance premiums to compound above CPI over the hold.
Questions for the listing agent
- Built in 1961 — when were the roof, HVAC, electrical panel, plumbing, and water heater last replaced?
- What's the actual annual flood-insurance premium (NFIP or private), and is the property in a SFHA with mandatory coverage?
- Is there a deadline driving the sale (1031 exchange, divorce, estate, relocation)? That informs how much negotiation room exists.
- What's the average days-on-market for RENTAL listings here right now (not sales)? A rising rental-DOM trend means longer vacancies and softer asking-rent achievability than the comps imply.
- What's the recent tenant-quality profile in this submarket — average credit score on applications, eviction rate, late-payment / NSF rate, and stable-employment percentage? A property-management company in the area should have these aggregated.
- How much new for-sale + rental construction is in the pipeline within 1–3 miles? Heavy new supply typically softens prices + rents 12–24 months out; constrained supply supports both.
Investment metrics
- 1% rule
- 1.06% ✓
- Cap rate
- 8.71%
- Cash-on-cash
- 8.62%
- DSCR
- 1.38
- GRM
- 7.9
CMA / ARV
- ARV (on-the-fly)
- $223,428
- Comps found
- 12
Show comp detail 12 sales within ~0.75 mi
| Address | Dist | Beds/Ba | Sqft | Sold | Price | $/sf | Match |
|---|---|---|---|---|---|---|---|
| 1639 Independence St | 0.16mi | 3/2.0 | 1,340 (+3%) | 7mo | $220,000 | $164 | 77 |
| 4006 N Miro St | 0.27mi | 3/2.0 | 1,272 (-2%) | 4mo | $179,900 | $141 | 77 |
| 1621 Congress St | 0.20mi | 3/2.0 | 1,237 (-5%) | 4mo | $190,000 | $154 | 75 |
| 1933 France St | 0.29mi | 3/2.0 | 1,358 (+4%) | 9mo | $45,000 | $33 | 68 |
| 3130 N Tonti St | 0.44mi | 3/2.0 | 1,252 (-4%) | 5mo | $235,000 | $188 | 66 |
| 1231 Gallier St | 0.48mi | 2/1.0 (-1) | 1,236 (-5%) | 4mo | $212,000 | $172 | 61 |
| 1431 Clouet St | 0.50mi | 3/2.0 | 1,404 (+8%) | 1mo | $307,000 | $219 | 59 |
| 1131 Bartholomew St | 0.56mi | 2/2.0 (-1) | 1,248 (-4%) | 1mo | $253,000 | $203 | 58 |
| 1437 Gallier St | 0.33mi | 3/2.0 | 1,451 (+12%) | 9mo | $65,000 | $45 | 53 |
| 3120 Urquhart St | 0.58mi | 3/1.0 | 1,134 (-13%) | 1mo | $90,000 | $79 | 51 |
| 3028 Marais St | 0.70mi | 3/1.5 | 1,391 (+7%) | 9mo | $328,000 | $236 | 46 |
| 1027 Louisa St | 0.69mi | 2/2.0 (-1) | 1,460 (+12%) | 1mo | $450,000 | $308 | 38 |
Match score weights: distance 35% · size 25% · config 20% · recency 20%. Top-matched comps best support the ARV.
Projected returns pro-forma
-3.0% appreciation · 2.49% rent growth · sell at horizon
- IRR
- -6.4%
- Equity multiple
- 0.76×
- Total profit
- $-10,420
- Equity at exit
- $23,484
- IRR
- 2.6%
- Equity multiple
- 1.18×
- Total profit
- $8,044
- Equity at exit
- $13,618
Cash invested: $44,100 (down + closing). Projections, not guarantees.
Landlord ↔ Tenant lean methodology
- Overall (STATE)
- 90 Strongly Landlord-Friendly
- State Louisiana
- 90 Strongly Landlord-Friendly · R+12
- County
- — inherits STATE
- City
- — inherits STATE
ZIP-level market 70117
- Rents YoY
- 2.5%
- Active inventory
- 581
- Price-to-rent
- 7.9×
Monthly cashflow live
- Estimated rent
- $1,662 high interval (Pro) →
- Mortgage (P&I)
- −$826
- Tax from tax record
- −$105 /mo · $1,259/yr
- Insurance
- −$66
- Flood insurance flood zone
- −$66 /mo · $798/yr
- HOA
- −$0
- Vacancy / Maint / Mgmt
- −$349
- Net cashflow
- $250
Break-even live
UW: 25.0% down · 7.5% · 30yr · 1.5% tax · 5.0% vac · 8.0% maint · 8.0% mgmt
Financing live
Cash to close
- Down payment
- $39,375
- Closing costs
- $4,725
- Reserves months
- —
- Total cash needed
- —
Loan-product check · same deal, 3 products live
Conventional
25% down · 7.5% · 30yr
- Down + closing
- —
- Monthly P&I
- —
- Monthly cashflow
- —
- DSCR
- —
- Eligible?
- —
Personal DTI + credit; lowest rate.
DSCR
20% down · 8.5% · 30yr
- Down + closing
- —
- Monthly P&I
- —
- Monthly cashflow
- —
- DSCR
- —
- Eligible?
- —
No personal income docs; deal must DSCR.
Hard money
10% down · 12.0% · 12mo
- Down + closing
- —
- Monthly P&I
- —
- Monthly cashflow
- —
- DSCR
- —
- Eligible?
- —
Short-term bridge; refi at stabilization.
Rent comps 40 comps
| Address | Beds | Baths | Sqft | Rent | $/sqft | DOM | Units | Dist |
|---|---|---|---|---|---|---|---|---|
| 1715 Gallier St Unit B New Orleans, LA | 2.0 | 1.0 | 1000 | $1,099 | $1.10 | 23d | 1 | 0.16mi |
| 1713 Gallier St Unit B New Orleans, LA | 2.0 | 1.0 | 1000 | $1,099 | $1.10 | 23d | 1 | 0.17mi |
| 2019 Gallier St New Orleans, LA | 4.0 | 2.0 | 1400 | $2,200 | $1.57 | 23d | 1 | 0.17mi |
| 1634 Bartholomew St New Orleans, LA | 2.0 | 1.0 | 900 | $1,300 | $1.44 | 23d | 1 | 0.18mi |
| 1628 Bartholomew St New Orleans, LA | 3.0 | 2.0 | 1050 | $1,600 | $1.52 | 23d | 1 | 0.19mi |
| 1904 Desire St New Orleans, LA | 3.0 | 1.0 | 1200 | $1,400 | $1.17 | 10d | 1 | 0.21mi |
| 2028 Desire St New Orleans, LA | 3.0 | 1.0 | 1300 | $1,300 | $1.00 | 23d | 1 | 0.25mi |
| 1822 Piety St New Orleans, LA | 3.0 | 1.5 | 1200 | $1,500 | $1.25 | 15d | 1 | 0.28mi |
| 4222 N Johnson St New Orleans, LA | 3.0 | 2.0 | 1100 | $1,895 | $1.72 | 23d | 1 | 0.28mi |
| 1942 Piety St New Orleans, LA | 3.0 | 1.0 | 1100 | $1,500 | $1.36 | 23d | 1 | 0.29mi |
| 2129 Desire St Unit 1B New Orleans, LA | 3.0 | 1.0 | 1105 | $1,200 | $1.09 | 2d | 1 | 0.29mi |
| 2129 Desire St Unit 1B New Orleans, LA | 3.0 | 1.0 | 1105 | $1,200 | $1.09 | 3d | 1 | 0.29mi |
| 4217 N Johnson St New Orleans, LA | 3.0 | 2.0 | 904 | $1,650 | $1.83 | 23d | 1 | 0.29mi |
| 1835 Louisa St New Orleans, LA | 3.0 | 2.5 | 1800 | $2,350 | $1.31 | 3d | 1 | 0.30mi |
| 1839 Louisa St New Orleans, LA | 3.0 | 2.0 | 1500 | $2,095 | $1.40 | 15d | 1 | 0.30mi |
| 1437 Gallier St New Orleans, LA | 3.0 | 2.0 | 1451 | $1,875 | $1.29 | 21d | 1 | 0.31mi |
| 5624-5626 Saint Claude ST New Orleans, LA | 4.0 | 3.0 | 1521 | $2,300 | $1.51 | 23d | 1 | 0.34mi |
| 4230 N Claiborne Ave New Orleans, LA | 3.0 | 2.5 | 1296 | $1,750 | $1.35 | 23d | 1 | 0.36mi |
| 1325 Pauline St New Orleans, LA | 3.0 | 2.0 | 1792 | $2,250 | $1.26 | 2d | 1 | 0.38mi |
| 1325 Pauline St New Orleans, LA | 3.0 | 2.0 | 1792 | $2,250 | $1.26 | 3d | 1 | 0.38mi |
| 1323 Pauline St New Orleans, LA | 3.0 | 2.0 | 1792 | $2,250 | $1.26 | 3d | 1 | 0.39mi |
| 3125 Industrial Ct New Orleans, LA | 2.0 | 2.5 | 1100 | $1,450 | $1.32 | 23d | 1 | 0.39mi |
| 3915 N Rocheblave St New Orleans, LA | 2.0 | 2.0 | 1005 | $1,700 | $1.69 | 23d | 1 | 0.41mi |
| 3915 N Rocheblave St New Orleans, LA | 2.0 | 2.0 | 1005 | $1,700 | $1.69 | 15d | 1 | 0.41mi |
| 1411 France St New Orleans, LA | 3.0 | 2.0 | 1525 | $2,000 | $1.31 | 23d | 1 | 0.42mi |
| 4318 N Robertson St New Orleans, LA | 3.0 | 1.0 | 1250 | $1,150 | $0.92 | 3d | 1 | 0.44mi |
| 4318 1/2 N Robertson St New Orleans, LA | 3.0 | 1.0 | 1250 | $1,150 | $0.92 | 2d | 1 | 0.45mi |
| 1319 France St New Orleans, LA | 2.0 | 1.0 | 923 | $975 | $1.06 | 21d | 1 | 0.46mi |
| 1403 Lesseps St New Orleans, LA | 3.0 | 3.0 | 1700 | $1,800 | $1.06 | 11d | 1 | 0.46mi |
| 2027 Feliciana St New Orleans, LA | 2.0 | 1.0 | 1104 | $1,100 | $1.00 | 15d | 1 | 0.48mi |
| 1211 Gallier St New Orleans, LA | 2.0 | 1.0 | 900 | $1,000 | $1.11 | 23d | 1 | 0.50mi |
| 2423 Louisa St New Orleans, LA | 2.0 | 1.0 | 1050 | $1,300 | $1.24 | 11d | 1 | 0.52mi |
| 2421 Louisa St New Orleans, LA | 2.0 | 1.0 | 1050 | $1,300 | $1.24 | 11d | 1 | 0.52mi |
| 4317 Urquhart St New Orleans, LA | 3.0 | 2.0 | 1300 | $1,650 | $1.27 | 23d | 1 | 0.52mi |
| 2114 Feliciana St Unit A New Orleans, LA | 3.0 | 2.0 | 1134 | $1,500 | $1.32 | 23d | 1 | 0.53mi |
| 2114 Feliciana St Unit A New Orleans, LA | 3.0 | 2.0 | 1134 | $1,500 | $1.32 | 15d | 1 | 0.53mi |
| 1119 Bartholomew St Unit 1119 New Orleans, LA | 2.0 | 2.0 | 1410 | $2,500 | $1.77 | 43d | 1 | 0.54mi |
| 2509 Piety St New Orleans, LA | 2.0 | 2.0 | 1056 | $1,450 | $1.37 | 23d | 1 | 0.54mi |
| 1121 Bartholomew St Unit 1121 New Orleans, LA | 2.0 | 1.0 | 893 | $2,000 | $2.24 | 23d | 1 | 0.54mi |
| 4021 St Claude Ave New Orleans, LA | 4.0 | 2.0 | 1016 | $1,275 | $1.25 | 3d | 1 | 0.56mi |
Listing history 27 events
-
2026-06-18days on market $157,500 Active 22 DOM
-
2026-06-17days on market $157,500 Active 21 DOM
-
2026-06-16days on market $157,500 Active 20 DOM
-
2026-06-15days on market $157,500 Active 19 DOM
-
2026-06-13days on market $157,500 Active 17 DOM
-
2026-06-10days on market $157,500 Active 14 DOM
-
2026-06-09days on market $157,500 Active 13 DOM
-
2026-06-08days on market $157,500 Active 12 DOM
-
2026-06-07days on market $157,500 Active 11 DOM
-
2026-06-05days on market $157,500 Active 8 DOM
-
2026-06-03days on market $157,500 Active 7 DOM
-
2026-06-02days on market $157,500 Active 6 DOM
-
2026-06-01days on market $157,500 Active 5 DOM
-
2026-05-31days on market $157,500 Active 4 DOM
-
2026-05-22$157,500 Active 484-char remark
Show marketing remark (484 chars)
Opportunity Knocks! This 3-bedroom, 1-bath home sits on a desirable corner lot and offers approximately 1,250 sq ft of living space plus a versatile flex room perfect for an office, playroom, guest space, or extra storage. With solid bones and endless potential, this property is ideal for investors, renovators, or buyers ready to bring their vision to life. A little TLC will go a long way in transforming this home into something special. Don't miss the chance to make it your own!
-
2026-05-22$157,500 Active
Show marketing remark (484 chars)
Opportunity Knocks! This 3-bedroom, 1-bath home sits on a desirable corner lot and offers approximately 1,250 sq ft of living space plus a versatile flex room perfect for an office, playroom, guest space, or extra storage. With solid bones and endless potential, this property is ideal for investors, renovators, or buyers ready to bring their vision to life. A little TLC will go a long way in transforming this home into something special. Don't miss the chance to make it your own!
-
2012-03-09soldstatus $24,900
-
2012-01-26soldstatus $66,667
-
2011-12-09$24,900
-
2011-12-09$24,900
-
2011-04-04$54,300
-
2011-04-04$54,300
-
1995-07-27soldstatus $21,900
-
1995-07-18soldstatus $21,900
-
1995-06-15$21,900
-
1995-06-15$21,900
-
1985-08-21soldstatus $40,000
ⓘ Source: listings_history table (triggers on properties + properties_extension) + one-shot
backfill from property_details.listing_events for pre-trigger history.
Tax reassessment forecast LA · Resets to sale price
- Current annual tax
- $1,259 · $105/mo
- Projected year-2 tax
- $1,259 · $105/mo
- Expected delta
- $0/yr ($0/mo · 0.0%)
ⓘ Screening estimate from a state-policy table — verify with the county assessor before closing.
Climate risk First Street
- Flood 9/10 Extreme FEMA zone X (shaded) · 99% chance over 30 yrs
- Wildfire 3/10 Moderate
- Heat 10/10 Extreme 7 d/yr ≥108°F today · 22 d/yr by 30 yrs out
- Wind 10/10 Extreme 99% chance of damaging wind over 30 yrs
- Air quality 3/10 Moderate 3 unhealthy d/yr today · 3 by 30 yrs out
Nearby sold comps map
Loading sold comps map…
Walkable amenities ~0.75 mi
Loading nearby amenities…
Taxation est. · year 1
- Rental income
- $19,947
- − Mortgage interest
- −$8,822
- − Property taxes
- −$1,259
- − Insurance
- −$1,585
- − Repairs & maintenance
- −$1,596
- − Management
- −$1,596
- − Depreciation
- −$4,582
- Taxable income
- $508
- Est. tax owed @ 24.0%
- −$122
- After-tax cash flow
- $2,882/yr
For passive investors: Depreciation is non-cash, so a rental often shows a tax loss while cash-flowing — sheltering income. Rental losses are passive: they offset passive income freely, and up to $25,000/yr can offset ordinary (W-2) income if you actively participate and your MAGI is under $100k (phasing out to $0 by $150k); unused losses carry forward. On sale, claimed depreciation is recaptured at up to 25%, and gains may owe capital-gains tax (a 1031 exchange can defer both). Figures are a year-1 estimate at your 24.0% rate — not tax advice; consult a CPA.
Schools (NCES district)
- District
- Orleans Parish
- NCES district ID
- 2201170
- Math proficiency
- 11% ▼ -52.00%
- Reading proficiency
- 27% ▼ -46.00%
- Median HH income
- $37,011
- Composite
- 15.78/100
- National rank
- #9271
- State rank
- #69 of 98 in LA
Livability — New Orleans
- Score
- 81/100
- State rank
- #3
- US rank
- #1383
Category grades
Schools grade is shown separately in the Schools card above.
Census & demographics
- Census place
- New Orleans, LA
- County
- Orleans Parish · 338,817 people
- City population
- 338,817
- Metro
- New Orleans-Metairie, LA
- Population (ZIP)
- 25,652
- Household income
- $45,764
- Rent vs Own
- Severe rent burden
- 1988.0
Population outlook (Orleans County) Hauer SSP2
- Today (2025)
- 513,025 people
- By 2030
- 575,781 · +12.2%
- By 2040
- 700,174 · +36.5%
- By 2050
- 826,541 · +61.1%
- By 2075
- 1,123,374 · +119.0%
- By 2100
- 1,355,609 · +164.2%
Race, ethnicity, and origin ACS 2023
- Neighborhood character
- Majority Black (60%)
- Race & ethnicity
- Black 60% White 30% Two or more races 6% Hispanic / Latino 5%
- Common ancestry
- Lithuanian 5% Italian 1% Romanian 1%
- Foreign-born
- 5% · Canada, South Korea
- Languages at home
- 93% English-only · Spanish 3% Other Indo-European 1% French/Haitian/Cajun 1%
Political lean MEDSL · Orleans
- 2024 margin
- Solid D (+67.0) · D 82.2% · R 15.2% · Other 2.7%
- 2008→2024 swing
- +6.7pp toward D · 2008: 60.3pp · 2024: 67.0pp
- All cycles
- 2024: D+67.0 2020: D+68.2 2016: D+66.2 2012: D+62.5 2008: D+60.3
Not yet ingested
- Civics
- —
Market trends
- HPI YoY
- ▼ -177.22%
- Current HPI
- 184.6061
- Rent YoY
- ▲ 2.49%
- Metro
- New Orleans-Metairie, LA
- State GDP YoY
- ▲ 3.29%
- F500 in state
- 10
Industry mix (Fortune 500 HQ in LA)
| Industry | F500 HQs | Revenue |
|---|---|---|
| Telecommunications | 2 | $23B |
|
||
| Utilities | 1 | $12B |
|
||
| Wholesale / Distribution | 1 | $5B |
|
||
| Advertising | 1 | $2B |
|
||
Price history
+293.8% since first listed13 events — show timeline
- 2026-05-22 Listed $157,500 GSREIN
- 2026-05-22 Listed $157,500 AcadianaMLS
- 2012-03-09 Sold (MLS) $24,900 GSREIN
- 2012-01-26 Sold (Public Records) $66,667 Public Records
- 2011-12-09 Listed $24,900 AcadianaMLS
- 2011-12-09 Listed $24,900 GSREIN
- 2011-04-04 Listed $54,300 GSREIN
- 2011-04-04 Listed $54,300 AcadianaMLS
- 1995-07-27 Sold (MLS) $21,900 GSREIN
- 1995-07-18 Sold (Public Records) $21,900 Public Records
- 1995-06-15 Listed $21,900 GSREIN
- 1995-06-15 Listed $21,900 AcadianaMLS
- 1985-08-21 Sold (Public Records) $40,000 Public Records
Property tax history
+5.1%/yrLatest (2026): $1,259 · +1.1% YoY. Source: county tax records.
Cash-flow waterfall
monthlySold comps — $/sqft
last 12 mo · ≤1 miLoading sold comps…