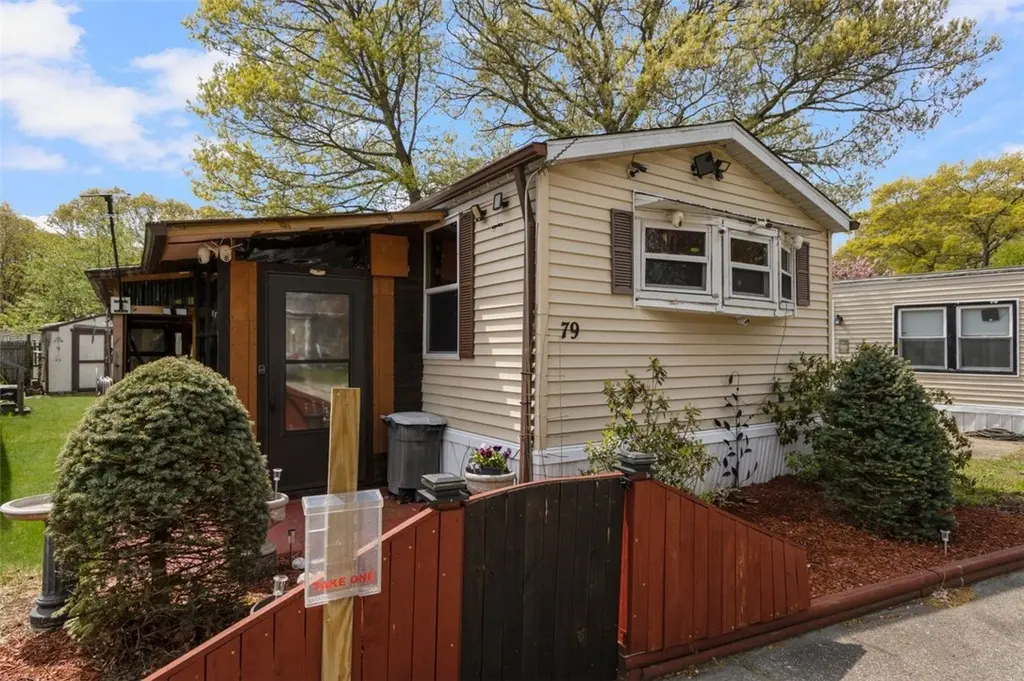
6101 79 Post Rd · Warwick, RI
Flood risk 1/10 · Minimal
- FEMA flood zone
- X (unshaded)
- Chance of flooding over 30 yrs
- 0.0%
- Est. flood insurance / yr
- $507 – $1,088
Fire risk 2/10 · Minimal
- Est. fire insurance / yr
- $835 – $1,551
Heat risk 5/10 · Moderate
- Hot days now (above 94°F)
- 7 days/yr
- Hot days in 30 yrs
- 17 days/yr
Wind risk 8/10 · Major
- Chance of severe wind over 30 yrs
- 80.0%
Air-quality risk 2/10 · Minimal
- Unhealthy air days now
- 2 days/yr
- Unhealthy air days in 30 yrs
- 2 days/yr
Risk factors via First Street. Map © Google.
Why this score? — see what drove the B grade
The composite is a weighted blend of 9 inputs, each scored 0–100. Each bar is that input's sub-score; the figure is the points it added to the 100-point composite (weight × sub-score).
- Cash flow +30.0/30.0
- 1% rule +10.0/10.0
- DSCR +10.0/10.0
- ARV discount +7.5/15.0
- Schools +5.0/10.0
- Livability +3.9/5.0
- Rent growth +2.5/5.0
- Condition / age +2.2/5.0
- Appreciation +0.0/10.0
$140,000
🖨 Deal sheet (PDF) 📄 Offer letter ✓ Due diligence
Listing remarks MLS
MUST SEE! REMODELED WITH UPGRADES! ALL NEW HARDWOODS! SOME WINDOWS. ALTERNATIVE TO CONDO LIVING. DEN/STUDY W/ LAVETTE! SHED & PATIO. PETS ALLOWED W/ PARK APPROVAL.
Key facts
- Three-season room
- Storage shed
- Walk-in shower
Tags
Property features AI
Finance
- HOA & community: Association fee $510 monthly; Has land lease
Exterior
- Parking: No garage; 2 parking spaces
- Utilities: 100 amp electrical service; Generator; Connected water with water tap fee; Septic tank
- Home design: Single-story; Above-grade finished living area
- Construction: Vinyl siding
- Exterior features: No garage; 2 parking spaces
Interior
- Flooring: Laminate
- Bathrooms: 1 full bathroom; 1 half bathroom
- Heating & cooling: Forced air heating (propane); Central air conditioning
- Interior features: Laminate flooring; Electric water heater
Neighborhood map
What this means for you Summary
Snapshot
- This is a 2-bed/1.0-bath manufactured listed at $140k. Condition is rated fair.
Deal economics
- At list price, monthly cash flow is $794 ($10k/yr) — positive.
- The deal already cash-flows at list — no discount required.
- Meets the 1% rule at list price ($3k rent vs $140k).
- Recommended offer: $138k (1.5% below list) — sets the bar for market timing.
- Cap rate 13.1% vs local median 3.3% in Warwick — top-decile yield for the area; either an underpriced asset or a hidden risk that comps aren't pricing in. Stress-test before assuming the spread holds.
Location & tenants
- Location reads 78/100 on livability (#6 in RI, #2,425 nationally) — a middle-class / working-renter tenant base. Strengths: crime A+, commute A+, housing A+; Watch: amenities F.
- North Kingstown (suburban): math 47% / reading 63% proficiency, ranked #5 of 39 in RI (top 13%) — acceptable for families but not a draw, mixed tenant base, ~2y average lease; only 19% free/reduced lunch — higher-income household profile.
- Zoned schools: Forest Park El. School (math 67% / reading 67%, grade B+, #5 of 167 statewide, top 3%, 260 students, 16% FRL); Davisville Middle School (math 33% / reading 48%, grade F, #9 of 57 statewide, top 14%, 450 students, 28% FRL); North Kingstown Sr. High (math 55% / reading 83%, grade B, #4 of 58 statewide, top 5%, 1,374 students, 17% FRL) — zoned schools at 20% FRL track the district average.
- Market conditions: 103 active listings in the ZIP; 2 comparable units currently listed for rent nearby; high-income renter base; 311 units permitted in Washington County in 2024 (45 in 5+ unit buildings).
Forward outlook
- Local home prices are declining (-3.0%/yr); year-one equity from $968 of loan paydown is wiped out by about $4k of value loss. Plan a longer hold.
- Washington County population projected at -14% by 2050 — secular population decline; favor cash flow + early exit over multi-decade hold.
- At projected returns (-3.0% appreciation + 3.0% rent growth), your $39k cash investment doubles in ~5 years — after that, you're playing with house money.
Negotiation context
- It's been on market 24 days — a 2% lower offer ($138k) is reasonable based on typical stale-listing flexibility.
- 6 sale attempts since 22y ago with the ask held roughly flat each time — persistent listings suggest the price (not the market) is what's stuck; bring a comps-based counter.
- Current owner paid $69k; list at $140k implies a 103% gain — meaningful room to come down on a strong offer.
Risks & watch-outs
- Climate carrying-cost: severe wind risk, 80% chance of damaging wind over 30y; extreme-heat days projected 7→17/yr by 2055 (HVAC capex compounding) — expect insurance premiums to compound above CPI over the hold.
Questions for the listing agent
- Have any recent inspections been done? Can we get a copy of the seller's disclosures and any deferred-maintenance estimates?
- What does the HOA fee cover, when was the last increase, and are there any pending special assessments or reserve-fund shortfalls?
- Is there a deadline driving the sale (1031 exchange, divorce, estate, relocation)? That informs how much negotiation room exists.
- Schools are D-rated, which usually means shorter tenancies and higher turnover. Who's the typical renter profile here, and what's been the actual vacancy rate?
- What's the average days-on-market for RENTAL listings here right now (not sales)? A rising rental-DOM trend means longer vacancies and softer asking-rent achievability than the comps imply.
- What's the recent tenant-quality profile in this submarket — average credit score on applications, eviction rate, late-payment / NSF rate, and stable-employment percentage? A property-management company in the area should have these aggregated.
- How much new for-sale + rental construction is in the pipeline within 1–3 miles? Heavy new supply typically softens prices + rents 12–24 months out; constrained supply supports both.
Investment metrics
- 1% rule
- 1.97% ✓
- Cap rate
- 13.10%
- Cash-on-cash
- 24.30%
- DSCR
- 2.08
- GRM
- 4.2
CMA / ARV
- ARV (median comp)
- $461,679
- List price
- $140,000
- Delta
- -69.68%
- Verdict
- UNDERPRICED
- Comps
- 20 within 1.0 mi
Projected returns pro-forma
-3.0% appreciation · 3.0% rent growth · sell at horizon
- IRR
- 17.7%
- Equity multiple
- 1.72×
- Total profit
- $28,165
- Equity at exit
- $20,874
- IRR
- 26.3%
- Equity multiple
- 3.32×
- Total profit
- $90,825
- Equity at exit
- $12,105
Cash invested: $39,200 (down + closing). Projections, not guarantees.
Landlord ↔ Tenant lean methodology
- Overall (STATE)
- 31 Tenant-Leaning
- State Rhode Island
- 31 Tenant-Leaning · D+8
- County
- — inherits STATE
- City
- — inherits STATE
ZIP-level market 02852
- Active inventory
- 103
- Price-to-rent
- 4.2×
Monthly cashflow live
- Estimated rent
- $2,754 medium interval (Pro) →
- Mortgage (P&I)
- −$734
- Tax from tax record
- −$79 /mo · $948/yr
- Insurance
- −$58
- HOA
- −$510
- Vacancy / Maint / Mgmt
- −$578
- Net cashflow
- $794
Break-even live
Sensitivity live
| Price | -10% $873 | -5% $833 | +0% $794 | +5% $754 | +10% $715 |
|---|---|---|---|---|---|
| Rent | -10% $576 | -5% $685 | +0% $794 | +5% $903 | +10% $1,011 |
| Rate | -1.0pp $864 | -0.5pp $829 | base $794 | +0.5pp $757 | +1.0pp $721 |
UW: 25.0% down · 7.5% · 30yr · 1.5% tax · 5.0% vac · 8.0% maint · 8.0% mgmt
Financing live
Cash to close
- Down payment
- $35,000
- Closing costs
- $4,200
- Reserves months
- —
- Total cash needed
- —
Loan-product check · same deal, 3 products live
Conventional
25% down · 7.5% · 30yr
- Down + closing
- —
- Monthly P&I
- —
- Monthly cashflow
- —
- DSCR
- —
- Eligible?
- —
Personal DTI + credit; lowest rate.
DSCR
20% down · 8.5% · 30yr
- Down + closing
- —
- Monthly P&I
- —
- Monthly cashflow
- —
- DSCR
- —
- Eligible?
- —
No personal income docs; deal must DSCR.
Hard money
10% down · 12.0% · 12mo
- Down + closing
- —
- Monthly P&I
- —
- Monthly cashflow
- —
- DSCR
- —
- Eligible?
- —
Short-term bridge; refi at stabilization.
Rent comps 2 comps
| Address | Beds | Baths | Sqft | Rent | $/sqft | DOM | Units | Dist |
|---|---|---|---|---|---|---|---|---|
| 25 Mitola Dr Unit 1 North Kingstown, RI | 3.0 | 1.0 | 1050 | $3,100 | $2.95 | 3d | 1 | 1.13mi |
| 71 Ranger Rd North Kingstown, RI | 2.0 | 1.0 | 1100 | $2,800 | $2.55 | 3d | 1 | 1.45mi |
HOA detail
- Monthly dues
- $510 · $6,120/yr
Listing history 24 events
-
2026-06-21days on market $140,000 Active 24 DOM
-
2026-06-18days on market $140,000 Active 21 DOM
-
2026-06-17days on market $140,000 Active 20 DOM
-
2026-06-16days on market $140,000 Active 19 DOM
-
2026-06-15days on market $140,000 Active 18 DOM
-
2026-06-13days on market $140,000 Active 16 DOM
-
2026-06-13days on market $140,000 Active 15 DOM
-
2026-06-09days on market $140,000 Active 12 DOM
-
2026-06-08days on market $140,000 Active 11 DOM
-
2026-06-07statusdays on market $140,000 Active 10 DOM
-
2026-05-15status Pending 535-char remark
-
2026-05-07$140,000 Active 535-char remark
-
2019-09-20price $74,700 172-char remark
Show marketing remark (172 chars)
MUST SEE! REMODELED WITH UPGRADES! ALL NEW HARDWOODS! SOME WINDOWS. ALTERNATIVE TO CONDO LIVING. DEN/STUDY W/ LAVETTE! SHED & PATIO. PETS ALLOWED W/ PARK APPROVAL.
-
2016-11-08price $69,900
-
2013-12-19price $24,000
-
2011-11-28historical
-
2011-09-23$24,000
-
2011-09-18historical
-
2011-02-18$50,000
-
2005-12-01soldstatus $68,900 172-char remark
Show marketing remark (172 chars)
MUST SEE! REMODELED WITH UPGRADES! ALL NEW HARDWOODS! SOME WINDOWS. ALTERNATIVE TO CONDO LIVING. DEN/STUDY W/ LAVETTE! SHED & PATIO. PETS ALLOWED W/ PARK APPROVAL.
-
2005-10-18historical 172-char remark
Show marketing remark (172 chars)
MUST SEE! REMODELED WITH UPGRADES! ALL NEW HARDWOODS! SOME WINDOWS. ALTERNATIVE TO CONDO LIVING. DEN/STUDY W/ LAVETTE! SHED & PATIO. PETS ALLOWED W/ PARK APPROVAL.
-
2005-08-04$77,700 172-char remark
Show marketing remark (172 chars)
MUST SEE! REMODELED WITH UPGRADES! ALL NEW HARDWOODS! SOME WINDOWS. ALTERNATIVE TO CONDO LIVING. DEN/STUDY W/ LAVETTE! SHED & PATIO. PETS ALLOWED W/ PARK APPROVAL.
-
2004-08-18historical
-
2004-05-04$79,900
ⓘ Source: listings_history table (triggers on properties + properties_extension) + one-shot
backfill from property_details.listing_events for pre-trigger history.
Tax reassessment forecast RI · Partial reset (capped growth)
- Current annual tax
- $948 · $79/mo
- Projected year-2 tax
- $1,615 · $135/mo
- Expected delta
- +$667/yr (+$56/mo · 70.4%)
ⓘ Screening estimate from a state-policy table — verify with the county assessor before closing.
Climate risk First Street
- Flood 1/10 Low FEMA zone X (unshaded) · 0% chance over 30 yrs
- Wildfire 2/10 Low
- Heat 5/10 Major 7 d/yr ≥94°F today · 17 d/yr by 30 yrs out
- Wind 8/10 Severe 80% chance of damaging wind over 30 yrs
- Air quality 2/10 Low 2 unhealthy d/yr today · 2 by 30 yrs out
Nearby sold comps map
Loading sold comps map…
Walkable amenities ~0.75 mi
Loading nearby amenities…
Taxation est. · year 1
- Rental income
- $33,042
- − Mortgage interest
- −$7,842
- − Property taxes
- −$948
- − Insurance
- −$700
- − Repairs & maintenance
- −$2,643
- − Management
- −$2,643
- − HOA
- −$6,120
- − Depreciation
- −$4,073
- Taxable income
- $8,072
- Est. tax owed @ 24.0%
- −$1,937
- After-tax cash flow
- $7,588/yr
For passive investors: Depreciation is non-cash, so a rental often shows a tax loss while cash-flowing — sheltering income. Rental losses are passive: they offset passive income freely, and up to $25,000/yr can offset ordinary (W-2) income if you actively participate and your MAGI is under $100k (phasing out to $0 by $150k); unused losses carry forward. On sale, claimed depreciation is recaptured at up to 25%, and gains may owe capital-gains tax (a 1031 exchange can defer both). Figures are a year-1 estimate at your 24.0% rate — not tax advice; consult a CPA.
Condition & rehab AI · 2 photos
The home is in fair condition with moderate repairs and maintenance needed, primarily focusing on exterior and interior updates to enhance its value.
Repairs flagged
- Moderate Siding — Weathered and discoloration visible.
- Minor Landscaping — Shrubs appear somewhat unkempt.
- Minor Roof — No visible signs of major issues, but may need inspection.
Value-add opportunities
- Both Painting — Fresh paint can improve curb appeal and interior aesthetics.
- Both Landscaping — Well-maintained landscaping can enhance curb appeal and property value.
- Both Siding repair — Repairing weathered siding can improve the home's appearance and increase its value.
- Both Interior updates — Updating the interior can make the home more attractive and increase its value for both resale and rental.
- Both Kitchen and bathroom updates — Updating these spaces can significantly increase the home's value and appeal to potential buyers or renters.
Renovation cost estimate screening
| Repair item | Severity | Est. cost |
|---|---|---|
| Siding · Weathered and discoloration visible. | Moderate | $3,000–15,000 |
| Landscaping · Shrubs appear somewhat unkempt. | Minor | $500–3,000 |
| Roof · No visible signs of major issues, but may need inspection. | Minor | $500–3,000 |
| Total estimated repair cost · 3 items | $4,000–21,000 |
Value-add ROI direction
- Both Painting — Fresh paint can improve curb appeal and interior aesthetics. ↑
- Both Landscaping — Well-maintained landscaping can enhance curb appeal and property value. ↑
- Both Siding repair — Repairing weathered siding can improve the home's appearance and increase its value. ↑
- Both Interior updates — Updating the interior can make the home more attractive and increase its value for both resale and rental. ↑
- Both Kitchen and bathroom updates — Updating these spaces can significantly increase the home's value and appeal to potential buyers or renters. ↑
ⓘ Cost ranges are severity-bucket heuristics (US national rule-of-thumb). Get contractor quotes + a written scope before underwriting a rehab budget.
Schools (NCES district)
- District
- North Kingstown
- NCES district ID
- 4400750
- Math proficiency
- 47% ▼ -5.00%
- Reading proficiency
- 63% ▬ 0.00%
- Median HH income
- $80,380
- Composite
- 49.77/100
- National rank
- #1962
- State rank
- #5 of 39 in RI
Livability — Warwick
- Score
- 78/100
- State rank
- #6
- US rank
- #2425
Category grades
Schools grade is shown separately in the Schools card above.
Census & demographics
- County
- Washington County · 79,886 people
- City population
- 108,434
- Metro
- Providence-Warwick, RI-MA
- Population (ZIP)
- 23,406
- Household income
- $118,643
- Rent vs Own
- Severe rent burden
- 505.0
Population outlook (Washington County) Hauer SSP2
- Today (2025)
- 123,856 people
- By 2030
- 121,962 · -1.5%
- By 2040
- 115,902 · -6.4%
- By 2050
- 107,078 · -13.5%
- By 2075
- 92,575 · -25.3%
- By 2100
- 77,407 · -37.5%
Race, ethnicity, and origin ACS 2023
- Neighborhood character
- Predominantly White (89%)
- Race & ethnicity
- White 89% Two or more races 6% Hispanic / Latino 3% Asian 3%
- Common ancestry
- Lithuanian 9% Russian 6% Romanian 4%
- Foreign-born
- 6% · China, Canada
- Languages at home
- 93% English-only · Other Indo-European 2% Other Asian/Pacific 2% Spanish 1%
Political lean MEDSL · Washington
- 2024 margin
- D (+15.0) · D 56.4% · R 41.4% · Other 2.3%
- 2008→2024 swing
- -24.3pp toward R · 2008: 39.3pp · 2024: 15.0pp
- All cycles
- 2024: D+15.0 2020: D+19.4 2016: D+10.0 2012: D+16.8 2008: D+39.3
Not yet ingested
- Civics
- —
Market trends
- HPI YoY
- ▼ -548.20%
- Current HPI
- 367.4748
- Rent YoY
- —
- Metro
- Providence-Warwick, RI-MA
- State GDP YoY
- ▲ 2.25%
- F500 in state
- 10
Industry mix (Fortune 500 HQ in RI)
| Industry | F500 HQs | Revenue |
|---|---|---|
| Healthcare | 1 | $373B |
|
||
| Food Distribution | 1 | $31B |
|
||
| Aerospace / Defense | 1 | $14B |
|
||
| Financial Services | 1 | $8B |
|
||
| Consumer Goods | 1 | $4B |
|
||
Price history
+75.2% since first listed15 events — show timeline
- 2026-06-05 Relisted — RIS
- 2026-05-15 Pending — RIS
- 2026-05-07 Listed $140,000 RIS
- 2019-09-20 Price Changed $74,700 RIS
- 2016-11-08 Price Changed $69,900 RIS
- 2013-12-19 Price Changed $24,000 RIS
- 2011-11-28 Listing Removed — RIS
- 2011-09-23 Listed $24,000 RIS
- 2011-09-18 Listing Removed — RIS
- 2011-02-18 Listed $50,000 RIS
- 2005-12-01 Sold (MLS) $68,900 RIS
- 2005-10-18 Listing Removed — RIS
- 2005-08-04 Listed $77,700 RIS
- 2004-08-18 Listing Removed — RIS
- 2004-05-04 Listed $79,900 RIS
Property tax history
+7.7%/yrLatest (2025): $948 · +22.6% YoY. Source: county tax records.
Cash-flow waterfall
monthlySold comps — $/sqft
last 12 mo · ≤1 miLoading sold comps…