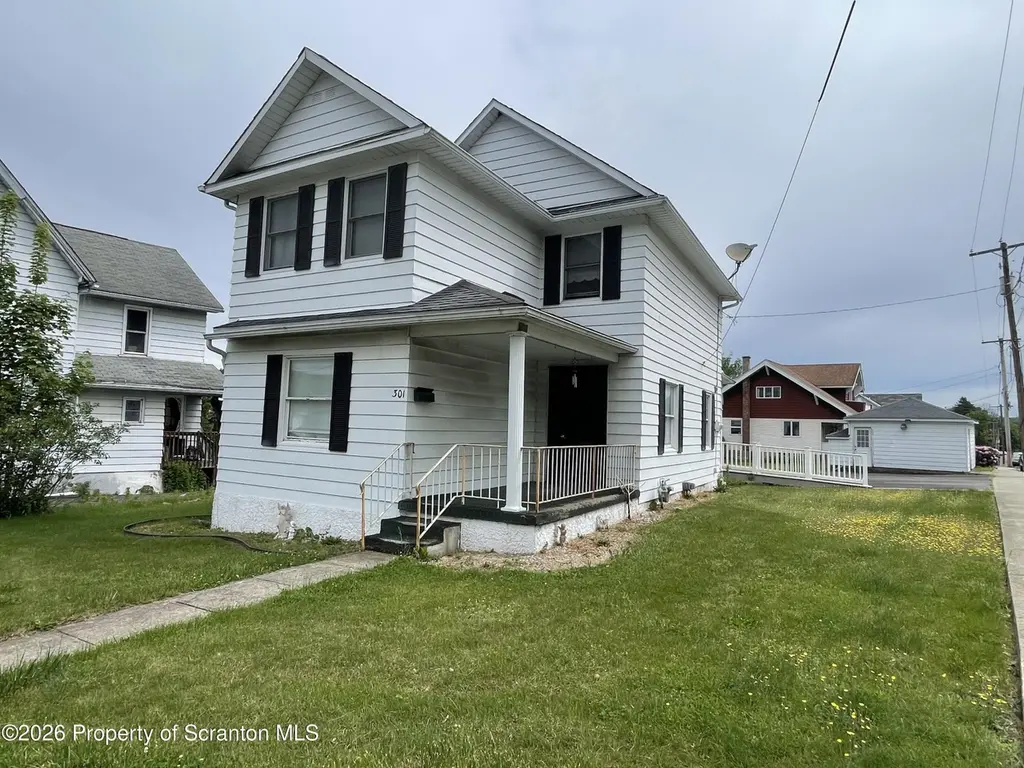
301 Milwaukee Ave · Old Forge, PA
Flood risk 1/10 · Minimal
- FEMA flood zone
- X (unshaded)
- Chance of flooding over 30 yrs
- 0.0%
- Est. flood insurance / yr
- $473 – $860
Fire risk 4/10 · Minor
- Est. fire insurance / yr
- $511 – $949
Heat risk 3/10 · Minor
- Hot days now (above 96°F)
- 7 days/yr
- Hot days in 30 yrs
- 15 days/yr
Wind risk 2/10 · Minimal
- Chance of severe wind over 30 yrs
- 3.0%
Air-quality risk 2/10 · Minimal
- Unhealthy air days now
- 0 days/yr
- Unhealthy air days in 30 yrs
- 1 days/yr
Risk factors via First Street. Map © Google.
Why this score? — see what drove the B+ grade
The composite is a weighted blend of 9 inputs, each scored 0–100. Each bar is that input's sub-score; the figure is the points it added to the 100-point composite (weight × sub-score).
- Cash flow +25.5/30.0
- ARV discount +15.0/15.0
- DSCR +8.4/10.0
- Appreciation +7.6/10.0
- 1% rule +6.7/10.0
- Livability +3.9/5.0
- Schools +3.1/10.0
- Rent growth +2.5/5.0
- Condition / age +2.5/5.0
$184,900
🖨 Deal sheet 📄 Offer letter ✓ Due diligence
Listing remarks
Sweet Old Forge home with lots to offer. Large yard including a parking pad for cars or bikes, an oversized garage, perfect for a workshop. Make this home your own by building off all this home has to offer. Hardwood flooring, a living room, family room, kitchen and laundry room with a bathroom modification are all on the main floor. The second floor has a full bathroom, three bedrooms and steps for the attic, great for storage. Central air conditioning and other updates were installed over the years but it's time for someone new to bring this home back to its glory.
Key facts
- Hardwood flooring
- Living room
- Large yard
Tags
Property features AI
Exterior
- Parking: Detached garage with 1 garage space; Asphalt-paved parking
- Utilities: Public water; Public sewer; Electricity connected (circuit breakers); Natural gas connected
- Home design: Single-family residence; Two levels; Built about 1925; Stone construction; Stone foundation; Shingle roof; Corner lot
- Construction: Stone construction; Stone foundation; Shingle roof; Estimated year built 1925
- Exterior features: Front porch; No additional exterior features listed
Interior
- Kitchen: Refrigerator; Electric oven; Dishwasher
- Bedrooms: 3 bedrooms (one primary and two additional bedrooms)
- Flooring: Carpet; Wood
- Bathrooms: 2 bathrooms total — 1 full and 1 half
- Heating & cooling: Forced-air heating (natural gas); Central air conditioning
- Interior features: Attic with walk-up access; Unfinished basement
- Laundry & utility: Washer and dryer; Main-level laundry
Neighborhood map
What this means for you Summary
Snapshot
- This is a 3-bed/1.5-bath single-family listed at $185k.
Deal economics
- At list price, monthly cash flow is $430 ($5k/yr) — positive.
- The deal already cash-flows at list — no discount required.
- Meets the 1% rule at list price ($2k rent vs $185k).
- Cap rate 9.1% vs local median 6.1% in Old Forge — top-decile yield for the area; either an underpriced asset or a hidden risk that comps aren't pricing in. Stress-test before assuming the spread holds.
Location & tenants
- Location reads 78/100 on livability (#287 in PA, #2,531 nationally) — a middle-class / working-renter tenant base. Strengths: crime A+, cost of living A+, housing A+; Watch: employment C-, amenities F, commute F.
- Old Forge SD (suburban): math 22% / reading 49% proficiency, ranked #409 of 539 in PA (top 76%) — families likely to look elsewhere, expect single-tenant / working-renter base with shorter leases.
- Market conditions: 39 active listings in the ZIP; 6 comparable units currently listed for rent nearby; rentals leasing fast (median 14d on market — plan ~1-2 weeks tenant-placement turnaround); 251 units permitted in Lackawanna County in 2024 (0 in 5+ unit buildings).
Forward outlook
- In year one you build about $11k of equity ($1k loan paydown + $10k appreciation (5.2% local appreciation)).
- Lackawanna County population projected to shrink 4% by 2050 — rents likely to lag national; underwrite the cash flow, not the appreciation.
- At projected returns (5.2% appreciation + 3.0% rent growth), your $52k cash investment doubles in ~4 years — after that, you're playing with house money.
- By year 4, paydown + projected appreciation supports a ~$37k cash-out refi (75% LTV) — recoverable capital for the next deal without selling this one.
Negotiation context
- Only 5 days on market — expect competitive offers; lowballing is unlikely to land.
Risks & watch-outs
- Watch-outs: built in 1925 — expect roof / HVAC / electrical / plumbing capex.
Questions for the listing agent
- Built in 1925 — when were the roof, HVAC, electrical panel, plumbing, and water heater last replaced?
- Is there a deadline driving the sale (1031 exchange, divorce, estate, relocation)? That informs how much negotiation room exists.
- Schools are B-rated — typically a magnet for longer-tenancy family renters. What's the average tenant stay here, and is there a school-zone premium baked into asking?
- What's the average days-on-market for RENTAL listings here right now (not sales)? A rising rental-DOM trend means longer vacancies and softer asking-rent achievability than the comps imply.
- What's the recent tenant-quality profile in this submarket — average credit score on applications, eviction rate, late-payment / NSF rate, and stable-employment percentage? A property-management company in the area should have these aggregated.
- How much new for-sale + rental construction is in the pipeline within 1–3 miles? Heavy new supply typically softens prices + rents 12–24 months out; constrained supply supports both.
Investment metrics
- 1% rule
- 1.17% ✓
- Cap rate
- 9.08%
- Cash-on-cash
- 9.97%
- DSCR
- 1.44
- GRM
- 7.1
CMA / ARV
- ARV (on-the-fly)
- $226,800
- Comps found
- 12
Show comp detail 12 sales within ~0.75 mi
| Address | Dist | Beds/Ba | Sqft | Sold | Price | $/sf | Match |
|---|---|---|---|---|---|---|---|
| 122 W Morton St | 0.14mi | 2/2.0 (-1) | 1,589 (-5%) | 2mo | $285,000 | $179 | 76 |
| 108 Mary St | 0.43mi | 3/2.5 | 1,705 (+2%) | 1mo | $153,000 | $90 | 72 |
| 201 Alicia St | 0.52mi | 3/2.0 | 1,700 (+1%) | 1mo | $230,000 | $135 | 71 |
| 702 Main St | 0.31mi | 4/2.0 (+1) | 1,620 (-4%) | 9mo | $70,000 | $43 | 65 |
| 603 Milwaukee Ave | 0.23mi | 3/2.0 | 1,867 (+11%) | 6mo | $345,000 | $185 | 64 |
| 127 Broadhead St | 0.29mi | 3/2.0 | 1,900 (+13%) | 1mo | $275,000 | $145 | 62 |
| 305 W Grace St | 0.59mi | 3/2.0 | 1,584 (-6%) | 1mo | $164,900 | $104 | 60 |
| 322 Bridge St | 0.40mi | 3/1.0 | 1,529 (-9%) | 8mo | $116,000 | $76 | 58 |
| 600 Center St | 0.74mi | 3/1.5 | 1,550 (-8%) | 2mo | $365,000 | $235 | 51 |
| 237 Main St | 0.57mi | 4/1.0 (+1) | 1,825 (+9%) | 6mo | $115,000 | $63 | 46 |
| 162 Taroli St | 0.57mi | 3/1.5 | 1,854 (+10%) | 13mo | $250,000 | $135 | 46 |
| 232 232 Main St | 0.60mi | 4/1.0 (+1) | 1,824 (+9%) | 7mo | $70,000 | $38 | 45 |
Match score weights: distance 35% · size 25% · config 20% · recency 20%. Top-matched comps best support the ARV.
Projected returns pro-forma
5.15% appreciation · 3.0% rent growth · sell at horizon
- IRR
- 21.8%
- Equity multiple
- 2.38×
- Total profit
- $71,595
- Equity at exit
- $106,427
- IRR
- 21.3%
- Equity multiple
- 4.71×
- Total profit
- $192,132
- Equity at exit
- $185,054
Cash invested: $51,772 (down + closing). Projections, not guarantees.
Landlord ↔ Tenant lean methodology
- Overall (STATE)
- 62 Landlord-Friendly
- State Pennsylvania
- 62 Landlord-Friendly · EVEN
- County
- — inherits STATE
- City
- — inherits STATE
ZIP-level market 18518
- Home prices YoY
- 2.2%
- Active inventory
- 39
- Price-to-rent
- 7.1×
Monthly cashflow live
- Estimated rent
- $2,162 high interval (Pro) →
- Mortgage (P&I)
- −$970
- Tax est. 1.5%
- −$231 /mo · $2,774/yr
- Insurance
- −$77
- HOA
- −$0
- Vacancy / Maint / Mgmt
- −$454
- Net cashflow
- $430
Break-even live
UW: 25.0% down · 7.5% · 30yr · 1.5% tax · 5.0% vac · 8.0% maint · 8.0% mgmt
Financing live
Cash to close
- Down payment
- $46,225
- Closing costs
- $5,547
- Reserves months
- —
- Total cash needed
- —
Loan-product check · same deal, 3 products live
Conventional
25% down · 7.5% · 30yr
- Down + closing
- —
- Monthly P&I
- —
- Monthly cashflow
- —
- DSCR
- —
- Eligible?
- —
Personal DTI + credit; lowest rate.
DSCR
20% down · 8.5% · 30yr
- Down + closing
- —
- Monthly P&I
- —
- Monthly cashflow
- —
- DSCR
- —
- Eligible?
- —
No personal income docs; deal must DSCR.
Hard money
10% down · 12.0% · 12mo
- Down + closing
- —
- Monthly P&I
- —
- Monthly cashflow
- —
- DSCR
- —
- Eligible?
- —
Short-term bridge; refi at stabilization.
Rent comps 6 comps
| Address | Beds | Baths | Sqft | Rent | $/sqft | DOM | Units | Dist |
|---|---|---|---|---|---|---|---|---|
| 75 Marimar Dr Old Forge, PA | 2.0 | 2.0 | 1300 | $2,500 | $1.92 | 13d | 1 | 0.31mi |
| 163 Bianca Way Old Forge, PA | 2.0 | 2.0 | 1194 | $2,500 | $2.09 | 13d | 1 | 0.32mi |
| 200 Oak St Unit 2 Old Forge, PA | 3.0 | 1.5 | 1500 | $1,800 | $1.20 | 43d | 1 | 0.85mi |
| 230 Swetland St Duryea, PA | 2.0 | 1.0 | 1092 | $1,400 | $1.28 | 21d | 1 | 0.97mi |
| 1418 Grove St Moosic, PA | 3.0 | 2.0 | 1820 | $1,850 | $1.02 | 13d | 1 | 1.12mi |
| 114 Dickson St Duryea, PA | 3.0 | 1.0 | 1836 | $1,600 | $0.87 | 13d | 1 | 1.15mi |
Listing history 1 events
-
2026-05-20$184,900 Active
ⓘ Source: listings_history table (triggers on properties + properties_extension) + one-shot
backfill from property_details.listing_events for pre-trigger history.
Climate risk First Street
- Flood 1/10 Low FEMA zone X (unshaded) · 0% chance over 30 yrs
- Wildfire 4/10 Moderate
- Heat 3/10 Moderate 7 d/yr ≥96°F today · 15 d/yr by 30 yrs out
- Wind 2/10 Low 3% chance of damaging wind over 30 yrs
- Air quality 2/10 Low 0 unhealthy d/yr today · 1 by 30 yrs out
Nearby sold comps map
Loading sold comps map…
Walkable amenities ~0.75 mi
Loading nearby amenities…
Taxation est. · year 1
- Rental income
- $25,944
- − Mortgage interest
- −$10,357
- − Property taxes
- −$2,774
- − Insurance
- −$924
- − Repairs & maintenance
- −$2,076
- − Management
- −$2,076
- − Depreciation
- −$5,379
- Taxable income
- $2,359
- Est. tax owed @ 24.0%
- −$566
- After-tax cash flow
- $4,596/yr
For passive investors: Depreciation is non-cash, so a rental often shows a tax loss while cash-flowing — sheltering income. Rental losses are passive: they offset passive income freely, and up to $25,000/yr can offset ordinary (W-2) income if you actively participate and your MAGI is under $100k (phasing out to $0 by $150k); unused losses carry forward. On sale, claimed depreciation is recaptured at up to 25%, and gains may owe capital-gains tax (a 1031 exchange can defer both). Figures are a year-1 estimate at your 24.0% rate — not tax advice; consult a CPA.
Schools (NCES district)
- District
- Old Forge SD
- NCES district ID
- 4218120
- Math proficiency
- 22% ▼ -19.00%
- Reading proficiency
- 49% ▼ -17.00%
- Median HH income
- $49,409
- Composite
- 30.6/100
- National rank
- #6196
- State rank
- #409 of 539 in PA
Livability — Old Forge
- Score
- 78/100
- State rank
- #287
- US rank
- #2531
Category grades
Schools grade is shown separately in the Schools card above.
Census & demographics
- Census place
- Old Forge, PA
- City population
- 8,533
- Population (ZIP)
- 8,533
Population outlook (Lackawanna County) Hauer SSP2
- Today (2025)
- 210,652 people
- By 2030
- 208,623 · -1.0%
- By 2040
- 203,980 · -3.2%
- By 2050
- 201,069 · -4.5%
- By 2075
- 205,026 · -2.7%
- By 2100
- 210,851 · +0.1%
Race, ethnicity, and origin ACS 2023
- Neighborhood character
- Predominantly White (84%)
- Race & ethnicity
- White 84% Two or more races 13% Hispanic / Latino 9% Asian 1%
- Hispanic origin (detail)
- Puerto Rican 9%
- Common ancestry
- Romanian 17% Scotch-Irish 4% Subsaharan African 2%
- Foreign-born
- 2% · Canada
- Languages at home
- 95% English-only · Spanish 3% Other Indo-European 1% Other Asian/Pacific 1%
Political lean MEDSL · Lackawanna
- 2024 margin
- Toss-up / Even · D 51.0% · R 48.3%
- 2008→2024 swing
- -23.2pp toward R · 2008: 26.0pp · 2024: 2.8pp
- All cycles
- 2024: D+2.8 2020: D+8.4 2016: D+3.4 2012: D+27.4 2008: D+26.0
Not yet ingested
- Civics
- —
Market trends
- HPI YoY
- ▲ 5.15%
- Current HPI
- 242.2839
- Rent YoY
- —
- Metro
- —
- State GDP YoY
- ▲ 1.68%
- F500 in state
- 34
Industry mix (Fortune 500 HQ in PA)
| Industry | F500 HQs | Revenue |
|---|---|---|
| Healthcare | 2 | $309B |
|
||
| Insurance | 2 | $27B |
|
||
| Telecommunications / Media | 1 | $124B |
|
||
| Industrial Distribution | 1 | $22B |
|
||
| Financial Services | 1 | $20B |
|
||
| Chemicals / Materials | 1 | $18B |
|
||
Price history
1 event — show timeline
- 2026-05-20 Listed $184,900 GSBR as distributed by MLS GRID
Property tax history
+39.6%/yrLatest (2026): $43,206 · +3214.0% YoY. Source: county tax records.
Cash-flow waterfall
monthlySold comps — $/sqft
last 12 mo · ≤1 miLoading sold comps…