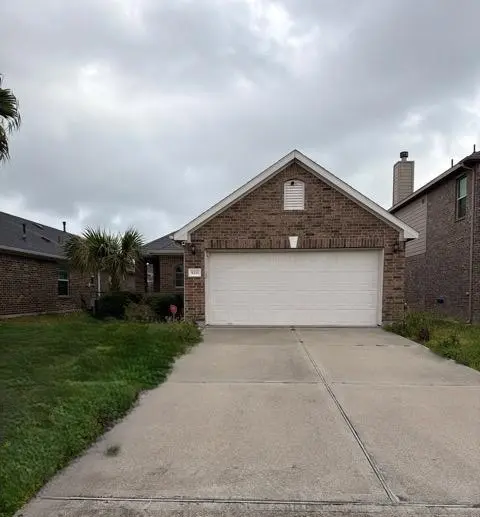
5211 Lagoon Ct · Bacliff, TX
Flood risk 7/10 · Major
- FEMA flood zone
- X (shaded)
- Chance of flooding over 30 yrs
- 0.76%
- Est. flood insurance / yr
- $507 – $1,088
Fire risk 3/10 · Minor
- Est. fire insurance / yr
- $1,222 – $2,270
Heat risk 10/10 · Severe
- Hot days now (above 108°F)
- 7 days/yr
- Hot days in 30 yrs
- 28 days/yr
Wind risk 10/10 · Severe
- Chance of severe wind over 30 yrs
- 99.0%
Air-quality risk 2/10 · Minimal
- Unhealthy air days now
- 1 days/yr
- Unhealthy air days in 30 yrs
- 1 days/yr
Risk factors via First Street. Map © Google.
Why this score? — see what drove the D grade
The composite is a weighted blend of 9 inputs, each scored 0–100. Each bar is that input's sub-score; the figure is the points it added to the 100-point composite (weight × sub-score).
- ARV discount +12.4/15.0
- Cash flow +11.1/30.0
- 1% rule +4.2/10.0
- Schools +3.5/10.0
- DSCR +3.2/10.0
- Livability +2.9/5.0
- Rent growth +2.5/5.0
- Condition / age +2.5/5.0
- Appreciation +0.0/10.0
$224,500
🖨 Deal sheet (PDF) 📄 Offer letter ✓ Due diligence
Listing remarks MLS
Tucked in Edgewater Park, this well-kept 1-story hits the sweet spot—3 bedrooms, 2 baths, and a 2-car attached garage with a layout that actually works. You’ve got an open flow, great natural light, and a dedicated study for work-from-home flexibility. Minutes to local shops, dining, and everyday essentials, with easy access to major routes and nearby industry hubs. Enjoy close proximity to parks, neighborhood amenities, and coastal spots along the bay—ideal for evening walks, weekend downtime, or entertaining at home.
Key facts
- Great natural light
- Open flow
- Dedicated study
Tags
Neighborhood map
What this means for you Summary
Snapshot
- This is a 3-bed/2.0-bath single-family listed at $224k.
Deal economics
- At list price, monthly cash flow is $-158 ($-2k/yr) — negative.
- To cash-flow at today's rent, offer at most $197k (12.4% below list).
- To meet the 1% rule (rent ≥ 1% of price), the offer needs to be $208k (7.5% below list).
- Recommended offer: $197k (12.4% below list) — sets the bar for cash-flow.
Location & tenants
- Location reads 57/100 on livability (#1,252 in TX) — a working-class tenant base; expect higher turnover. Strengths: cost of living A+, housing A+; Watch: employment D+, crime D, amenities F.
- Dickinson ISD (suburban): math 39% / reading 40% proficiency, ranked #366 of 826 in TX (top 44%) — families likely to look elsewhere, expect single-tenant / working-renter base with shorter leases; 60% free/reduced lunch — lower-income household profile, screen leases tightly.
- Zoned schools: Kenneth E Little El (math 32% / reading 25%, grade F, #2,706 of 4,322 statewide, top 63%, 648 students, 88% FRL); R D Mcadams J H (math 32% / reading 40%, grade F, #805 of 1,662 statewide, top 50%, 950 students, 65% FRL); Dickinson H S (math 30% / reading 46%, grade F, #880 of 1,632 statewide, top 54%, 3,619 students, 64% FRL).
- Market conditions: 62 active listings in the ZIP; 5 comparable units currently listed for rent nearby; rentals leasing fast (median 12d on market — plan ~1-2 weeks tenant-placement turnaround); 3,258 units permitted in Galveston County in 2024 (0 in 5+ unit buildings).
- At $2,076/mo this rent would consume 48% of the median local household income ($51k/yr) (locally 672% of renters already pay >50% of income on rent) — very limited rent-growth headroom before tenants either downsize or default.
Forward outlook
- Local home prices are declining (-3.0%/yr); year-one equity from $2k of loan paydown is wiped out by about $7k of value loss. Plan a longer hold.
- Galveston County population projected at +43% by 2050 — long-run rental-demand tailwind backs the buy-and-hold thesis.
Negotiation context
- It's been on market 46 days — a 3% lower offer ($218k) is reasonable based on typical stale-listing flexibility.
- 4 sale attempts since 10y ago; this cycle's ask has dropped $34k (13%) from the opening price — seller is motivated, your offer sets the floor, not the list.
Risks & watch-outs
- Watch-outs: flood insurance adds $66/mo.
- Climate carrying-cost: major flood risk; severe wind risk, 99% chance of damaging wind over 30y; extreme-heat days projected 7→28/yr by 2055 (HVAC capex compounding) — expect insurance premiums to compound above CPI over the hold.
Questions for the listing agent
- What do current leases actually rent for vs. the listed asking? Can we see a recent rent roll and the last 12 months of T-12 income?
- It's been on market 46 days. Have you received any prior offers? Is the seller open to a 12% concession, seller financing, or rate buy-down credit?
- What's the actual annual flood-insurance premium (NFIP or private), and is the property in a SFHA with mandatory coverage?
- What does the HOA fee cover, when was the last increase, and are there any pending special assessments or reserve-fund shortfalls?
- Is there a deadline driving the sale (1031 exchange, divorce, estate, relocation)? That informs how much negotiation room exists.
- Schools are F-rated, which usually means shorter tenancies and higher turnover. Who's the typical renter profile here, and what's been the actual vacancy rate?
- Crime grade is D in this area — have there been break-ins, vandalism, or insurance claims at this property in the last 3 years? What carrier currently insures it and at what premium?
- The area grade is low — what's the realistic commute time and amenity access for the typical tenant pool here? Any planned neighborhood developments (good or bad) we should know about?
- What's the average days-on-market for RENTAL listings here right now (not sales)? A rising rental-DOM trend means longer vacancies and softer asking-rent achievability than the comps imply.
- What's the recent tenant-quality profile in this submarket — average credit score on applications, eviction rate, late-payment / NSF rate, and stable-employment percentage? A property-management company in the area should have these aggregated.
- How much new for-sale + rental construction is in the pipeline within 1–3 miles? Heavy new supply typically softens prices + rents 12–24 months out; constrained supply supports both.
Investment metrics
- 1% rule
- 0.92% ✗
- Cap rate
- 5.80%
- Cash-on-cash
- -1.75%
- DSCR
- 0.92
- GRM
- 9.0
CMA / ARV
- ARV (median comp)
- $252,101
- List price
- $224,500
- Delta
- -10.95%
- Verdict
- UNDERPRICED
- Comps
- 20 within 1.0 mi
Show comp detail 12 sales within ~0.75 mi
| Address | Dist | Beds/Ba | Sqft | Sold | Price | $/sf | Match |
|---|---|---|---|---|---|---|---|
| 5211 Lagoon Ct | 0.00mi | 3/2.0 | 1,608 (0%) | 1mo | $224,500 | $140 | 99 |
| 5206 Misty Ln | 0.03mi | 3/2.0 | 1,608 (0%) | 5mo | $270,000 | $168 | 94 |
| 5219 Misty Ln | 0.06mi | 3/2.5 | 1,641 (+2%) | 1mo | $263,000 | $160 | 91 |
| 5127 Misty Ln | 0.07mi | 3/2.5 | 1,641 (+2%) | 1mo | $264,900 | $161 | 90 |
| 5203 Lagoon Ct | 0.02mi | 3/2.5 | 1,641 (+2%) | 5mo | $259,000 | $158 | 90 |
| 207 Sea Breeze Dr | 0.17mi | 3/2.5 | 1,457 (-9%) | 6mo | $235,000 | $161 | 69 |
| 5011 Gulf Stream Ln | 0.27mi | 3/2.0 | 1,457 (-9%) | 4mo | $270,000 | $185 | 68 |
| 4835 Chase More Dr | 0.69mi | 3/2.0 | 1,604 (-0%) | 4mo | $249,000 | $155 | 64 |
| 4722 Palmetto St | 0.35mi | 3/2.0 | 1,496 (-7%) | 9mo | $219,999 | $147 | 64 |
| 4734 Oleander St | 0.35mi | 4/2.0 (+1) | 1,753 (+9%) | 6mo | $249,999 | $143 | 58 |
| 5114 Chase Court Dr | 0.73mi | 3/2.5 | 1,729 (+8%) | 4mo | $189,900 | $110 | 48 |
| 4403 2nd St | 0.72mi | 2/2.0 (-1) | 1,368 (-15%) | 8mo | $212,000 | $155 | 30 |
Match score weights: distance 35% · size 25% · config 20% · recency 20%. Top-matched comps best support the ARV.
Projected returns pro-forma
-3.0% appreciation · 3.0% rent growth · sell at horizon
- IRR
- -21.2%
- Equity multiple
- 0.26×
- Total profit
- $-46,251
- Equity at exit
- $33,474
- IRR
- -14.5%
- Equity multiple
- 0.17×
- Total profit
- $-52,481
- Equity at exit
- $19,411
Cash invested: $62,860 (down + closing). Projections, not guarantees.
Landlord ↔ Tenant lean methodology
- Overall (STATE)
- 87 Strongly Landlord-Friendly
- State Texas
- 87 Strongly Landlord-Friendly · R+5
- County
- — inherits STATE
- City
- — inherits STATE
ZIP-level market 77518
- Home prices YoY
- -7.6%
- Active inventory
- 62
- Price-to-rent
- 9.0×
Monthly cashflow live
- Estimated rent
- $2,076 medium interval (Pro) →
- Mortgage (P&I)
- −$1,177
- Tax from tax record
- −$424 /mo · $5,083/yr
- Insurance
- −$94
- Flood insurance flood zone
- −$66 /mo · $798/yr
- HOA
- −$37
- Vacancy / Maint / Mgmt
- −$436
- Net cashflow
- $-158
Break-even live
Sensitivity live
| Price | -10% $-31 | -5% $-94 | +0% $-158 | +5% $-221 | +10% $-285 |
|---|---|---|---|---|---|
| Rent | -10% $-322 | -5% $-240 | +0% $-158 | +5% $-76 | +10% $6 |
| Rate | -1.0pp $-45 | -0.5pp $-101 | base $-158 | +0.5pp $-216 | +1.0pp $-275 |
UW: 25.0% down · 7.5% · 30yr · 1.5% tax · 5.0% vac · 8.0% maint · 8.0% mgmt
Financing live
Cash to close
- Down payment
- $56,125
- Closing costs
- $6,735
- Reserves months
- —
- Total cash needed
- —
Loan-product check · same deal, 3 products live
Conventional
25% down · 7.5% · 30yr
- Down + closing
- —
- Monthly P&I
- —
- Monthly cashflow
- —
- DSCR
- —
- Eligible?
- —
Personal DTI + credit; lowest rate.
DSCR
20% down · 8.5% · 30yr
- Down + closing
- —
- Monthly P&I
- —
- Monthly cashflow
- —
- DSCR
- —
- Eligible?
- —
No personal income docs; deal must DSCR.
Hard money
10% down · 12.0% · 12mo
- Down + closing
- —
- Monthly P&I
- —
- Monthly cashflow
- —
- DSCR
- —
- Eligible?
- —
Short-term bridge; refi at stabilization.
Rent comps 5 comps
| Address | Beds | Baths | Sqft | Rent | $/sqft | DOM | Units | Dist |
|---|---|---|---|---|---|---|---|---|
| 339 Sea Breeze Dr Bacliff, TX | 3.0 | 2.5 | 1456 | $1,985 | $1.36 | 5d | 1 | 0.05mi |
| 5139 Misty Ln Bacliff, TX | 3.0 | 2.0 | 1794 | $1,970 | $1.10 | 12d | 1 | 0.09mi |
| 5223 Gulf Stream Ln Bacliff, TX | 3.0 | 2.5 | 1778 | $2,080 | $1.17 | 12d | 1 | 0.19mi |
| 2735 Broadway St Unit 1546437P San Leon, TX | 3.0 | 2.0 | 1819 | $4,994 | $2.75 | 14d | 1 | 1.01mi |
| 1118 Chase Park Dr Bacliff, TX | 3.0 | 2.0 | 1854 | $2,046 | $1.10 | 0d | 1 | 1.12mi |
HOA detail
- Monthly dues
- $37 · $444/yr
- Likely covers
- water
Listing history 15 events
-
2026-05-15status Pending 542-char remark
Show marketing remark (542 chars)
Tucked in Edgewater Park, this well-kept 1-story hits the sweet spot—3 bedrooms, 2 baths, and a 2-car attached garage with a layout that actually works. You’ve got an open flow, great natural light, and a dedicated study for work-from-home flexibility. Minutes to local shops, dining, and everyday essentials, with easy access to major routes and nearby industry hubs. Enjoy close proximity to parks, neighborhood amenities, and coastal spots along the bay—ideal for evening walks, weekend downtime, or entertaining at home.
-
2026-04-28price $224,500 542-char remark
Show marketing remark (542 chars)
Tucked in Edgewater Park, this well-kept 1-story hits the sweet spot—3 bedrooms, 2 baths, and a 2-car attached garage with a layout that actually works. You’ve got an open flow, great natural light, and a dedicated study for work-from-home flexibility. Minutes to local shops, dining, and everyday essentials, with easy access to major routes and nearby industry hubs. Enjoy close proximity to parks, neighborhood amenities, and coastal spots along the bay—ideal for evening walks, weekend downtime, or entertaining at home.
-
2026-03-29$258,000 Active 542-char remark
Show marketing remark (542 chars)
Tucked in Edgewater Park, this well-kept 1-story hits the sweet spot—3 bedrooms, 2 baths, and a 2-car attached garage with a layout that actually works. You’ve got an open flow, great natural light, and a dedicated study for work-from-home flexibility. Minutes to local shops, dining, and everyday essentials, with easy access to major routes and nearby industry hubs. Enjoy close proximity to parks, neighborhood amenities, and coastal spots along the bay—ideal for evening walks, weekend downtime, or entertaining at home.
-
2025-10-08historical
-
2025-07-08$265,000 Active
-
2025-04-02status Pending
-
2025-03-21status Option Pending
-
2025-03-21historical
-
2025-03-11$260,000 Active
-
2016-04-01soldstatus
-
2016-03-30soldstatus Sold
-
2016-02-28status Pending
-
2016-02-18status Option Pending
-
2016-02-05$174,000 Active
-
2010-08-06soldstatus $2,500,000
ⓘ Source: listings_history table (triggers on properties + properties_extension) + one-shot
backfill from property_details.listing_events for pre-trigger history.
Tax reassessment forecast TX · Resets to sale price
- Current annual tax
- $5,083 · $424/mo
- Projected year-2 tax
- $5,083 · $424/mo
- Expected delta
- $0/yr ($0/mo · 0.0%)
ⓘ Screening estimate from a state-policy table — verify with the county assessor before closing.
Climate risk First Street
- Flood 7/10 Severe FEMA zone X (shaded) · 76% chance over 30 yrs
- Wildfire 3/10 Moderate
- Heat 10/10 Extreme 7 d/yr ≥108°F today · 28 d/yr by 30 yrs out
- Wind 10/10 Extreme 99% chance of damaging wind over 30 yrs
- Air quality 2/10 Low 1 unhealthy d/yr today · 1 by 30 yrs out
Nearby sold comps map
Loading sold comps map…
Walkable amenities ~0.75 mi
Loading nearby amenities…
Taxation est. · year 1
- Rental income
- $24,911
- − Mortgage interest
- −$12,575
- − Property taxes
- −$5,083
- − Insurance
- −$1,920
- − Repairs & maintenance
- −$1,993
- − Management
- −$1,993
- − HOA
- −$444
- − Depreciation
- −$6,531
- Taxable loss
- −$5,628
- Est. tax savings @ 24.0%
- +$1,351
- After-tax cash flow
- $-544/yr
For passive investors: Depreciation is non-cash, so a rental often shows a tax loss while cash-flowing — sheltering income. Rental losses are passive: they offset passive income freely, and up to $25,000/yr can offset ordinary (W-2) income if you actively participate and your MAGI is under $100k (phasing out to $0 by $150k); unused losses carry forward. On sale, claimed depreciation is recaptured at up to 25%, and gains may owe capital-gains tax (a 1031 exchange can defer both). Figures are a year-1 estimate at your 24.0% rate — not tax advice; consult a CPA.
Schools (NCES district)
- District
- Dickinson ISD
- NCES district ID
- 4817070
- Math proficiency
- 39% ▼ -11.00%
- Reading proficiency
- 40% ▼ -2.00%
- Median HH income
- $61,318
- Composite
- 35.16/100
- National rank
- #5005
- State rank
- #366 of 826 in TX
Livability — Bacliff
- Score
- 57/100
- State rank
- #1252
- US rank
- #21864
Category grades
Schools grade is shown separately in the Schools card above.
Census & demographics
- Census place
- Bacliff, TX
- County
- Galveston County · 357,330 people
- City population
- 9,541
- Metro
- Houston-The Woodlands-Sugar Land, TX
- Population (ZIP)
- 9,541
- Household income
- $51,458
- Rent vs Own
- Severe rent burden
- 672.0
Population outlook (Galveston County) Hauer SSP2
- Today (2025)
- 390,640 people
- By 2030
- 425,226 · +8.9%
- By 2040
- 493,765 · +26.4%
- By 2050
- 559,698 · +43.3%
- By 2075
- 719,260 · +84.1%
- By 2100
- 819,628 · +109.8%
Race, ethnicity, and origin ACS 2023
- Neighborhood character
- Diverse neighborhood (Simpson 0.60)
- Race & ethnicity
- Hispanic / Latino 46% White 43% Two or more races 21% Black 7% Asian 2% Native American 1%
- Hispanic origin (detail)
- Mexican 31%
- Common ancestry
- Slovak 3% Lithuanian 2% Romanian 1%
- Foreign-born
- 15% · Canada, Vietnam, China
- Languages at home
- 66% English-only · Spanish 32% Vietnamese 1%
Political lean MEDSL · Galveston
- 2024 margin
- Strong R (+27.4) · D 35.7% · R 63.1% · Other 1.2%
- 2008→2024 swing
- -7.9pp toward R · 2008: -19.5pp · 2024: -27.4pp
- All cycles
- 2024: R+27.4 2020: R+22.6 2016: R+22.6 2012: R+26.9 2008: R+19.5
Not yet ingested
- Civics
- —
Market trends
- HPI YoY
- ▼ -24.15%
- Current HPI
- 293.2677
- Rent YoY
- —
- Metro
- Houston-The Woodlands-Sugar Land, TX
- State GDP YoY
- ▲ 3.95%
- F500 in state
- 110
Industry mix (Fortune 500 HQ in TX)
| Industry | F500 HQs | Revenue |
|---|---|---|
| Energy | 16 | $1,198B |
|
||
| Technology | 5 | $198B |
|
||
| Engineering / Construction | 4 | $72B |
|
||
| Energy Services | 3 | $60B |
|
||
| Utilities | 3 | $41B |
|
||
| Healthcare | 2 | $330B |
|
||
Price history
-91.0% since first listed15 events — show timeline
- 2026-05-15 Pending — HARMLS
- 2026-04-28 Price Changed $224,500 HARMLS
- 2026-03-29 Listed $258,000 HARMLS
- 2025-10-08 Listing Removed — HARMLS
- 2025-07-08 Listed $265,000 HARMLS
- 2025-04-02 Pending — HARMLS
- 2025-03-21 Pending — HARMLS
- 2025-03-21 Listing Removed — HARMLS
- 2025-03-11 Listed $260,000 HARMLS
- 2016-04-01 Sold (Public Records) — Public Records
- 2016-03-30 Sold (MLS) — HARMLS
- 2016-02-28 Pending — HARMLS
- 2016-02-18 Pending — HARMLS
- 2016-02-05 Listed $174,000 HARMLS
- 2010-08-06 Sold (Public Records) $2,500,000 Public Records
Property tax history
+31.7%/yrLatest (2025): $5,083 · -4.6% YoY. Source: county tax records.
Cash-flow waterfall
monthlySold comps — $/sqft
last 12 mo · ≤1 miLoading sold comps…