 🏷️ Likely Rental
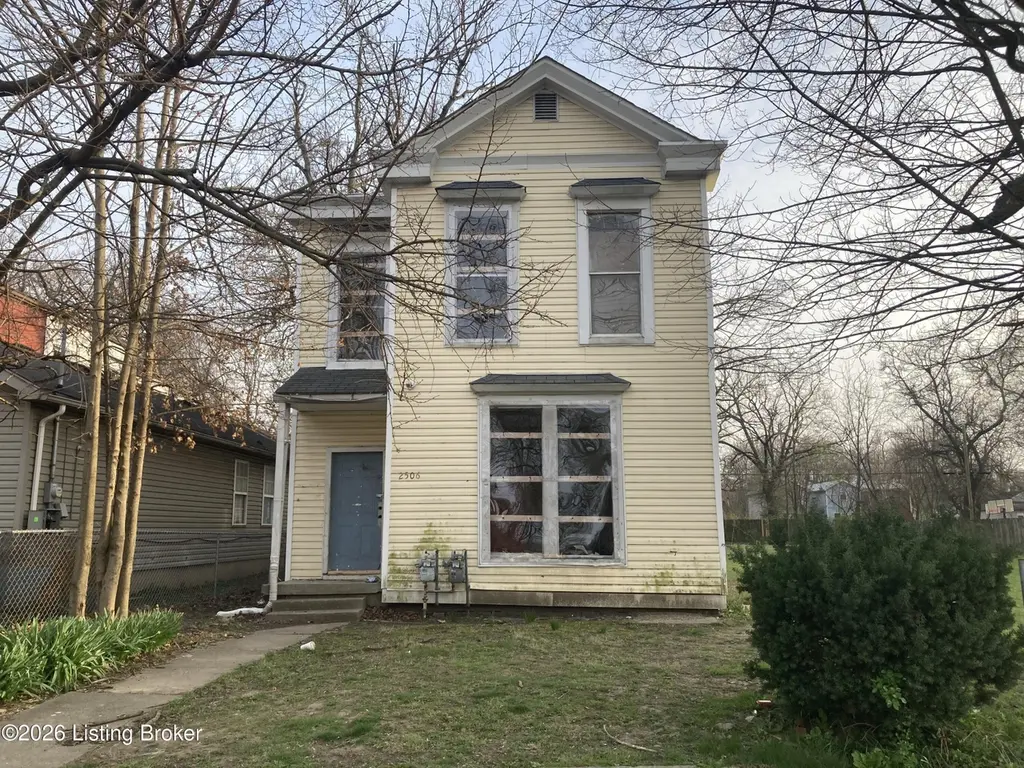
2506 W Jefferson St · Louisville, KY
Flood risk 7/10 · Major
- FEMA flood zone
- X (shaded)
- Chance of flooding over 30 yrs
- 0.99%
- Est. flood insurance / yr
- $507 – $1,088
Fire risk 1/10 · Minimal
- Est. fire insurance / yr
- $839 – $1,559
Heat risk 5/10 · Moderate
- Hot days now (above 105°F)
- 7 days/yr
- Hot days in 30 yrs
- 20 days/yr
Wind risk 2/10 · Minimal
- Chance of severe wind over 30 yrs
- 1.0%
Air-quality risk 2/10 · Minimal
- Unhealthy air days now
- 1 days/yr
- Unhealthy air days in 30 yrs
- 2 days/yr
Risk factors via First Street. Map © Google.
Why this score? — see what drove the B+ grade
The composite is a weighted blend of 9 inputs, each scored 0–100. Each bar is that input's sub-score; the figure is the points it added to the 100-point composite (weight × sub-score).
- Cash flow +30.0/30.0
- 1% rule +10.0/10.0
- DSCR +10.0/10.0
- Appreciation +10.0/10.0
- ARV discount +7.5/15.0
- Livability +3.2/5.0
- Rent growth +2.6/5.0
- Condition / age +2.5/5.0
- Schools +2.3/10.0
$49,900
🖨 Deal sheet (PDF) 📄 Offer letter ✓ Due diligence
Listing remarks MLS
Home just converted back to a duplex, had been a boarding house for several years. Low rents but both on Month to Month, so can be raised at any given time. Long term renters. Call for your appointment to view, thanks!
Key facts
- Deep lot
- Rear alley access
- 5,200 sq ft lot
Tags
Property features AI
Finance
- Other: Subdivision: RUSSELL
- HOA & community: No association fee
Exterior
- Utilities: Electricity connected; Natural gas
- Home design: Single-family residence; Traditional style; Two stories; Built in 1900
- Construction: Vinyl siding and wood frame construction; Shingle roof; Crawl space foundation
- Exterior features: Partial fencing; Sidewalks; Level lot
Interior
- Kitchen: Kitchen present (second level); Dining area on the first floor
- Bedrooms: Four bedrooms total; Two bedrooms on the first floor; Two bedrooms on the second floor
- Bathrooms: Two full bathrooms
- Heating & cooling: Heating present; Natural gas fuel
- Interior features: Nine total rooms; No basement; First-floor primary bedroom
- Laundry & utility: No first-floor laundry
Neighborhood map
What this means for you Summary
Snapshot
- This is a 4-bed/2.0-bath single-family listed at $50k.
Deal economics
- At list price, monthly cash flow is $747 ($9k/yr) — positive.
- The deal already cash-flows at list — no discount required.
- Meets the 1% rule at list price ($1k rent vs $50k).
- Cap rate 25.9% vs local median 5.0% in Louisville — top-decile yield for the area; either an underpriced asset or a hidden risk that comps aren't pricing in. Stress-test before assuming the spread holds.
Location & tenants
- Location reads 63/100 on livability (#333 in KY) — a middle-class / working-renter tenant base. Strengths: cost of living A+, housing A+; Watch: employment C-, health & safety D+, schools D-.
- Jefferson County (urban): math 19% / reading 35% proficiency, ranked #121 of 165 in KY (top 73%) — low school quality limits family demand, transient renter base, plan for 1-2y turnover.
- Market conditions: Rents flat; 140 active listings in the ZIP; 23 comparable units currently listed for rent nearby; rentals at typical pace (median 18d on market — plan ~3-4 weeks tenant-placement turnaround); lower-income renter base — watch delinquency; 2,836 units permitted in Jefferson County in 2024 (1,558 in 5+ unit buildings).
- At $1,469/mo this rent would consume 49% of the median local household income ($36k/yr) (locally 1148% of renters already pay >50% of income on rent) — very limited rent-growth headroom before tenants either downsize or default.
Forward outlook
- In year one you build about $5k of equity ($345 loan paydown + $5k appreciation (10.0% local appreciation)).
- Jefferson County population projected at +13% by 2050 — modest demand growth; plan on rents tracking national, not racing it.
- At projected returns (10.0% appreciation + 0.5% rent growth), your $14k cash investment doubles in ~1 year — after that, you're playing with house money.
- By year 6, paydown + projected appreciation supports a ~$31k cash-out refi (75% LTV) — recoverable capital for the next deal without selling this one.
Negotiation context
- Only 7 days on market — expect competitive offers; lowballing is unlikely to land.
- 5 sale attempts since 23y ago; this cycle's ask has dropped $5k (9%) from the opening price — seller is motivated, your offer sets the floor, not the list.
- Current owner paid $36k; 39% above their basis — modest negotiation headroom, anchor on the comps not their cost.
Risks & watch-outs
- Watch-outs: flood insurance adds $66/mo; built in 1900 — expect roof / HVAC / electrical / plumbing capex.
- Climate carrying-cost: major flood risk; extreme-heat days projected 7→20/yr by 2055 (HVAC capex compounding) — expect insurance premiums to compound above CPI over the hold.
Questions for the listing agent
- Built in 1900 — when were the roof, HVAC, electrical panel, plumbing, and water heater last replaced?
- What's the actual annual flood-insurance premium (NFIP or private), and is the property in a SFHA with mandatory coverage?
- Is there a deadline driving the sale (1031 exchange, divorce, estate, relocation)? That informs how much negotiation room exists.
- Schools are D-rated, which usually means shorter tenancies and higher turnover. Who's the typical renter profile here, and what's been the actual vacancy rate?
- Crime grade is F in this area — have there been break-ins, vandalism, or insurance claims at this property in the last 3 years? What carrier currently insures it and at what premium?
- What's the average days-on-market for RENTAL listings here right now (not sales)? A rising rental-DOM trend means longer vacancies and softer asking-rent achievability than the comps imply.
- What's the recent tenant-quality profile in this submarket — average credit score on applications, eviction rate, late-payment / NSF rate, and stable-employment percentage? A property-management company in the area should have these aggregated.
- How much new for-sale + rental construction is in the pipeline within 1–3 miles? Heavy new supply typically softens prices + rents 12–24 months out; constrained supply supports both.
Investment metrics
- 1% rule
- 2.94% ✓
- Cap rate
- 25.87%
- Cash-on-cash
- 69.90%
- DSCR
- 4.11
- GRM
- 2.8
CMA / ARV
- ARV (on-the-fly)
- $157,788
- Comps found
- 12
Show comp detail 12 sales within ~0.75 mi
| Address | Dist | Beds/Ba | Sqft | Sold | Price | $/sf | Match |
|---|---|---|---|---|---|---|---|
| 2219 W Madison St | 0.34mi | 3/2.0 (-1) | 1,922 (-1%) | 3mo | $22,000 | $11 | 74 |
| 2715 W Market St | 0.24mi | 4/2.0 | 1,735 (-11%) | 8mo | $139,000 | $80 | 64 |
| 2513 W Chestnut St | 0.31mi | 4/2.0 | 2,108 (+8%) | 14mo | $144,000 | $68 | 60 |
| 2535 Duncan St | 0.41mi | 5/2.0 (+1) | 2,100 (+8%) | 10mo | $170,000 | $81 | 54 |
| 2523 Saint Xavier St | 0.72mi | 4/1.0 | 1,894 (-3%) | 9mo | $30,000 | $16 | 50 |
| 2424 Saint Xavier St | 0.68mi | 4/2.5 | 1,921 (-1%) | 19mo | $190,650 | $99 | 49 |
| 1825 W Muhammad Ali Blvd | 0.61mi | 3/2.5 (-1) | 1,817 (-7%) | 6mo | $195,000 | $107 | 48 |
| 2711 W Chestnut St | 0.36mi | 4/1.5 | 1,737 (-11%) | 20mo | $148,000 | $85 | 46 |
| 1944 W Chestnut St | 0.57mi | 4/2.5 | 2,100 (+8%) | 16mo | $190,000 | $90 | 45 |
| 2010 St Xavier St | 0.72mi | 4/1.5 | 1,780 (-9%) | 11mo | $75,000 | $42 | 41 |
| 1924 Rowan St | 0.58mi | 3/2.0 (-1) | 1,844 (-5%) | 22mo | $119,900 | $65 | 40 |
| 1828 W Chestnut St | 0.68mi | 3/2.0 (-1) | 1,722 (-12%) | 22mo | $155,990 | $91 | 25 |
Match score weights: distance 35% · size 25% · config 20% · recency 20%. Top-matched comps best support the ARV.
Projected returns pro-forma
10.0% appreciation · 0.51% rent growth · sell at horizon
- IRR
- 73.7%
- Equity multiple
- 6.10×
- Total profit
- $71,255
- Equity at exit
- $44,954
- IRR
- 66.6%
- Equity multiple
- 12.88×
- Total profit
- $165,956
- Equity at exit
- $96,945
Cash invested: $13,972 (down + closing). Projections, not guarantees.
Landlord ↔ Tenant lean methodology
- Overall (STATE)
- 83 Strongly Landlord-Friendly
- State Kentucky
- 83 Strongly Landlord-Friendly · R+16
- County
- — inherits STATE
- City
- — inherits STATE
ZIP-level market 40212
- Home prices YoY
- 11.0%
- Rents YoY
- 0.5%
- Active inventory
- 140
- Price-to-rent
- 2.8×
Monthly cashflow live
- Estimated rent
- $1,469 high interval (Pro) →
- Mortgage (P&I)
- −$262
- Tax from tax record
- −$64 /mo · $765/yr
- Insurance
- −$21
- Flood insurance flood zone
- −$66 /mo · $798/yr
- HOA
- −$0
- Vacancy / Maint / Mgmt
- −$308
- Net cashflow
- $747
Break-even live
Sensitivity live
| Price | -10% $776 | -5% $762 | +0% $747 | +5% $733 | +10% $719 |
|---|---|---|---|---|---|
| Rent | -10% $631 | -5% $689 | +0% $747 | +5% $805 | +10% $863 |
| Rate | -1.0pp $773 | -0.5pp $760 | base $747 | +0.5pp $734 | +1.0pp $721 |
UW: 25.0% down · 7.5% · 30yr · 1.5% tax · 5.0% vac · 8.0% maint · 8.0% mgmt
Financing live
Cash to close
- Down payment
- $12,475
- Closing costs
- $1,497
- Reserves months
- —
- Total cash needed
- —
Loan-product check · same deal, 3 products live
Conventional
25% down · 7.5% · 30yr
- Down + closing
- —
- Monthly P&I
- —
- Monthly cashflow
- —
- DSCR
- —
- Eligible?
- —
Personal DTI + credit; lowest rate.
DSCR
20% down · 8.5% · 30yr
- Down + closing
- —
- Monthly P&I
- —
- Monthly cashflow
- —
- DSCR
- —
- Eligible?
- —
No personal income docs; deal must DSCR.
Hard money
10% down · 12.0% · 12mo
- Down + closing
- —
- Monthly P&I
- —
- Monthly cashflow
- —
- DSCR
- —
- Eligible?
- —
Short-term bridge; refi at stabilization.
Rent comps 23 comps
| Address | Beds | Baths | Sqft | Rent | $/sqft | DOM | Units | Dist |
|---|---|---|---|---|---|---|---|---|
| 2508 W Main St Louisville, KY | 3.0 | 1.0 | 1327 | $1,500 | $1.13 | 24d | 1 | 0.16mi |
| 430 S 24th St Louisville, KY | 3.0 | 1.5 | 1288 | $1,400 | $1.09 | 24d | 1 | 0.16mi |
| 2529 W Main St #2 Louisville, KY | 3.0 | 1.0 | 1404 | $1,200 | $0.85 | 24d | 1 | 0.20mi |
| 2319 W Muhammad Ali Blvd Louisville, KY | 4.0 | 1.0 | 1644 | $1,300 | $0.79 | 16d | 1 | 0.24mi |
| 205 N 26th St Louisville, KY | 5.0 | 2.0 | 1538 | $1,700 | $1.11 | 24d | 1 | 0.30mi |
| 120 N 20th St Louisville, KY | 3.0 | 1.5 | 1300 | $1,400 | $1.08 | 24d | 1 | 0.51mi |
| 1810 Magazine St Louisville, KY | 3.0 | 1.5 | 1248 | $1,450 | $1.16 | 11d | 1 | 0.77mi |
| 1919 Baird St Louisville, KY | 3.0 | 1.0 | 1500 | $1,100 | $0.73 | 16d | 1 | 0.84mi |
| 858 S 23rd St Louisville, KY | 5.0 | 1.0 | 2228 | $2,100 | $0.94 | 17d | 1 | 0.91mi |
| 737 S 33rd St Louisville, KY | 4.0 | 1.0 | 1356 | $1,595 | $1.18 | 24d | 1 | 1.05mi |
| 820 Hazel St Louisville, KY | 4.0 | 2.0 | 1872 | $1,395 | $0.75 | 3d | 1 | 1.06mi |
| 2825 Greenwood Ave #4 Louisville, KY | 3.0 | 1.0 | 1440 | $1,250 | $0.87 | 24d | 1 | 1.16mi |
| 803 S 35th St Louisville, KY | 3.0 | 1.0 | 1486 | $1,350 | $0.91 | 24d | 1 | 1.19mi |
| 2912 Greenwood Ave Louisville, KY | 3.0 | 2.0 | 1362 | $1,150 | $0.84 | 16d | 1 | 1.21mi |
| 627 S 38th St Louisville, KY | 4.0 | 1.0 | 1300 | $1,349 | $1.04 | 16d | 1 | 1.25mi |
| 127 N 40th St Louisville, KY | 3.0 | 2.0 | 1500 | $1,570 | $1.05 | 4d | 1 | 1.31mi |
| 106 N 40th St Louisville, KY | 3.0 | 1.0 | 1325 | $1,220 | $0.92 | 4d | 1 | 1.32mi |
| 628 S 39th St Louisville, KY | 3.0 | 1.0 | 1448 | $1,220 | $0.84 | 16d | 1 | 1.36mi |
| 980 W Liberty St Louisville, KY | 1.0–3.0 | 1.0–1.5 | 1026 | $1,535 | $1.50 | 24d | 133 | 1.41mi |
| 1115 S 32nd St Louisville, KY | 3.0 | 1.0 | 1393 | $1,275 | $0.92 | 24d | 1 | 1.42mi |
| 1115 S 32nd St Louisville, KY | 3.0 | 1.0 | 1393 | $1,275 | $0.92 | 22d | 1 | 1.42mi |
| 1705 1/2 Hale Ave Louisville, KY | 3.0 | 2.0 | 1257 | $1,400 | $1.11 | 11d | 1 | 1.43mi |
| 3909 W Broadway Louisville, KY | 5.0 | 2.0 | 2000 | $1,745 | $0.87 | 16d | 1 | 1.47mi |
Listing history 7 events
-
2026-06-18days on market $49,900 Active 7 DOM
-
2026-06-17price $49,900 Active 6 DOM
-
2026-06-17days on market $54,900 Active 6 DOM
-
2026-06-16days on market $54,900 Active 5 DOM
-
2026-06-15days on market $54,900 Active 4 DOM
-
2026-06-13remarks 699-char remark
-
2026-06-13$54,900 Active 2 DOM
ⓘ Source: listings_history table (triggers on properties + properties_extension) + one-shot
backfill from property_details.listing_events for pre-trigger history.
Tax reassessment forecast KY · Resets to sale price
- Current annual tax
- $765 · $64/mo
- Projected year-2 tax
- $765 · $64/mo
- Expected delta
- $0/yr ($0/mo · 0.0%)
ⓘ Screening estimate from a state-policy table — verify with the county assessor before closing.
Climate risk First Street
- Flood 7/10 Severe FEMA zone X (shaded) · 99% chance over 30 yrs
- Wildfire 1/10 Low
- Heat 5/10 Major 7 d/yr ≥105°F today · 20 d/yr by 30 yrs out
- Wind 2/10 Low 100% chance of damaging wind over 30 yrs
- Air quality 2/10 Low 1 unhealthy d/yr today · 2 by 30 yrs out
Nearby sold comps map
Loading sold comps map…
Walkable amenities ~0.75 mi
Loading nearby amenities…
Taxation est. · year 1
- Rental income
- $17,622
- − Mortgage interest
- −$2,795
- − Property taxes
- −$765
- − Insurance
- −$1,047
- − Repairs & maintenance
- −$1,410
- − Management
- −$1,410
- − Depreciation
- −$1,452
- Taxable income
- $8,744
- Est. tax owed @ 24.0%
- −$2,098
- After-tax cash flow
- $6,871/yr
For passive investors: Depreciation is non-cash, so a rental often shows a tax loss while cash-flowing — sheltering income. Rental losses are passive: they offset passive income freely, and up to $25,000/yr can offset ordinary (W-2) income if you actively participate and your MAGI is under $100k (phasing out to $0 by $150k); unused losses carry forward. On sale, claimed depreciation is recaptured at up to 25%, and gains may owe capital-gains tax (a 1031 exchange can defer both). Figures are a year-1 estimate at your 24.0% rate — not tax advice; consult a CPA.
Schools (NCES district)
- District
- Jefferson County
- NCES district ID
- 2102990
- Math proficiency
- 19% ▼ -17.00%
- Reading proficiency
- 35% ▼ -11.00%
- Median HH income
- $47,885
- Composite
- 23.45/100
- National rank
- #7884
- State rank
- #121 of 165 in KY
Livability — Louisville
- Score
- 63/100
- State rank
- #333
- US rank
- #15887
Category grades
Schools grade is shown separately in the Schools card above.
Census & demographics
- Census place
- Louisville, KY
- County
- Jefferson County · 790,184 people
- City population
- 769,292
- Metro
- Louisville/Jefferson County, KY-IN
- Population (ZIP)
- 14,661
- Household income
- $35,753
- Rent vs Own
- Severe rent burden
- 1148.0
Population outlook (Jefferson County) Hauer SSP2
- Today (2025)
- 823,112 people
- By 2030
- 849,343 · +3.2%
- By 2040
- 895,696 · +8.8%
- By 2050
- 933,630 · +13.4%
- By 2075
- 1,028,262 · +24.9%
- By 2100
- 1,072,675 · +30.3%
Race, ethnicity, and origin ACS 2023
- Neighborhood character
- Majority Black (60%)
- Race & ethnicity
- Black 60% White 37% Two or more races 2% Hispanic / Latino 1%
- Common ancestry
- Slovak 1% Lithuanian 1% Iranian 1%
- Foreign-born
- 1% · Canada
- Languages at home
- 98% English-only · Spanish 1%
Political lean MEDSL · Jefferson
- 2024 margin
- D (+16.6) · D 57.4% · R 40.9% · Other 1.7%
- 2008→2024 swing
- +4.5pp toward D · 2008: 12.0pp · 2024: 16.6pp
- All cycles
- 2024: D+16.6 2020: D+20.1 2016: D+13.3 2012: D+11.1 2008: D+12.0
Not yet ingested
- Civics
- —
Market trends
- HPI YoY
- ▲ 29.02%
- Current HPI
- 293.2624
- Rent YoY
- ▲ 0.51%
- Metro
- Louisville/Jefferson County, KY-IN
- State GDP YoY
- ▲ 1.81%
- F500 in state
- 4
Industry mix (Fortune 500 HQ in KY)
| Industry | F500 HQs | Revenue |
|---|---|---|
| Healthcare | 1 | $118B |
|
||
| Food / Beverage | 1 | $7B |
|
||
Price history
+83.0% since first listed12 events — show timeline
- 2026-06-11 Listed $54,900 Metro Search MLS
- 2016-08-19 Sold (MLS) $36,000 Metro Search MLS
- 2016-08-08 Pending — Metro Search MLS
- 2016-06-25 Listed $36,000 Metro Search MLS
- 2015-07-06 Sold (MLS) $31,000 Metro Search MLS
- 2015-06-10 Pending — Metro Search MLS
- 2015-06-08 Listed $33,000 Metro Search MLS
- 2011-03-18 Sold (MLS) $5,250 Metro Search MLS
- 2011-02-03 Listed $6,500 Metro Search MLS
- 2007-05-29 Sold (Public Records) $60,000 Public Records
- 2003-11-19 Sold (MLS) $16,000 Metro Search MLS
- 2003-10-24 Listed $30,000 Metro Search MLS
Property tax history
+6.8%/yrLatest (2025): $765 · -1.9% YoY. Source: county tax records.
Cash-flow waterfall
monthlySold comps — $/sqft
last 12 mo · ≤1 miLoading sold comps…