 🏷️ Likely Rental
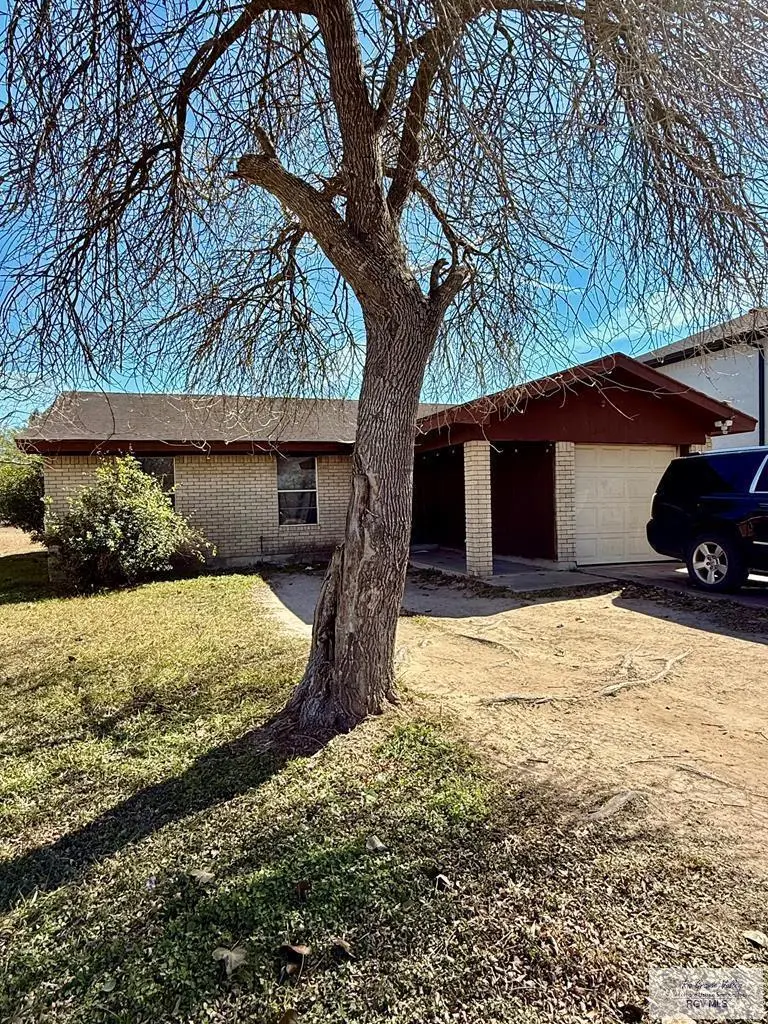
240 Palmero St · San Benito, TX
Flood risk 4/10 · Minor
- FEMA flood zone
- X (unshaded)
- Chance of flooding over 30 yrs
- 0.2%
- Est. flood insurance / yr
- $507 – $1,088
Fire risk 4/10 · Minor
- Est. fire insurance / yr
- $1,222 – $2,270
Heat risk 9/10 · Severe
- Hot days now (above 110°F)
- 7 days/yr
- Hot days in 30 yrs
- 26 days/yr
Wind risk 9/10 · Severe
- Chance of severe wind over 30 yrs
- 99.0%
Air-quality risk 2/10 · Minimal
- Unhealthy air days now
- 1 days/yr
- Unhealthy air days in 30 yrs
- 1 days/yr
Risk factors via First Street. Map © Google.
Why this score? — see what drove the D+ grade
The composite is a weighted blend of 9 inputs, each scored 0–100. Each bar is that input's sub-score; the figure is the points it added to the 100-point composite (weight × sub-score).
- ARV discount +15.0/15.0
- Cash flow +10.6/30.0
- Appreciation +5.0/10.0
- 1% rule +4.4/10.0
- Livability +3.3/5.0
- DSCR +3.1/10.0
- Rent growth +2.5/5.0
- Condition / age +2.5/5.0
- Schools +1.6/10.0
$125,000
🖨 Deal sheet 📄 Offer letter ✓ Due diligence
Listing remarks MLS
Charming 4 bedroom 1.5 bath home with a 1 car garage. Spacious backyard. Currently has a long term tenant.
Key facts
- Spacious backyard
- 0.28 acre lot
- Garage
Tags
Neighborhood map
What this means for you Summary
Snapshot
- This is a 4-bed/1.5-bath single-family listed at $125k.
Deal economics
- At list price, monthly cash flow is $-61 ($-728/yr) — negative.
- To cash-flow at today's rent, offer at most $114k (8.6% below list).
- To meet the 1% rule (rent ≥ 1% of price), the offer needs to be $117k (6.0% below list).
- Recommended offer: $110k (12.0% below list) — sets the bar for market timing.
- Cap rate 5.7% vs local median 3.7% in San Benito — top-decile yield for the area; either an underpriced asset or a hidden risk that comps aren't pricing in. Stress-test before assuming the spread holds.
Location & tenants
- Location reads 66/100 on livability (#621 in TX) — a middle-class / working-renter tenant base. Strengths: cost of living A+, housing A+; Watch: crime C-, schools D-, amenities F.
- San Benito CISD (suburban): math 14% / reading 27% proficiency, ranked #782 of 826 in TX (top 95%) — low school quality limits family demand, transient renter base, plan for 1-2y turnover; 78% free/reduced lunch — lower-income household profile, screen leases tightly.
- Market conditions: 7 active listings in the ZIP; 2 comparable units currently listed for rent nearby; 2,326 units permitted in Cameron County in 2024 (503 in 5+ unit buildings).
Forward outlook
- In year one you build about $5k of equity ($864 loan paydown + $4k appreciation (3.0% local appreciation)).
- Cameron County population projected at +3% by 2050 — modest demand growth; plan on rents tracking national, not racing it.
- At projected returns (3.0% appreciation + 3.0% rent growth), your $35k cash investment doubles in ~7 years — after that, you're playing with house money.
- By year 8, paydown + projected appreciation supports a ~$34k cash-out refi (75% LTV) — recoverable capital for the next deal without selling this one.
Negotiation context
- It's been on market 381 days — a 12% lower offer ($110k) is reasonable based on typical stale-listing flexibility.
- 2 sale attempts since 7y ago; this cycle's ask has dropped $15k (11%) from the opening price — seller is motivated, your offer sets the floor, not the list.
Risks & watch-outs
- Watch-outs: property tax is 2.7% of price.
- Climate carrying-cost: severe wind risk, 99% chance of damaging wind over 30y; extreme-heat days projected 7→26/yr by 2055 (HVAC capex compounding) — expect insurance premiums to compound above CPI over the hold.
Questions for the listing agent
- What do current leases actually rent for vs. the listed asking? Can we see a recent rent roll and the last 12 months of T-12 income?
- It's been on market 381 days. Have you received any prior offers? Is the seller open to a 12% concession, seller financing, or rate buy-down credit?
- Property tax is high relative to price — has the assessment been appealed recently, and will the sale trigger a re-assessment?
- Why hasn't it sold? Are there any deal-killer items the seller is aware of (foundation, flood, title, zoning, code violations)?
- Is there a deadline driving the sale (1031 exchange, divorce, estate, relocation)? That informs how much negotiation room exists.
- Schools are D-rated, which usually means shorter tenancies and higher turnover. Who's the typical renter profile here, and what's been the actual vacancy rate?
- The area grade is low — what's the realistic commute time and amenity access for the typical tenant pool here? Any planned neighborhood developments (good or bad) we should know about?
- What's the average days-on-market for RENTAL listings here right now (not sales)? A rising rental-DOM trend means longer vacancies and softer asking-rent achievability than the comps imply.
- What's the recent tenant-quality profile in this submarket — average credit score on applications, eviction rate, late-payment / NSF rate, and stable-employment percentage? A property-management company in the area should have these aggregated.
- How much new for-sale + rental construction is in the pipeline within 1–3 miles? Heavy new supply typically softens prices + rents 12–24 months out; constrained supply supports both.
Investment metrics
- 1% rule
- 0.94% ✗
- Cap rate
- 5.71%
- Cash-on-cash
- -2.08%
- DSCR
- 0.91
- GRM
- 8.9
CMA / ARV
- ARV (median comp)
- $200,644
- List price
- $125,000
- Delta
- -37.70%
- Verdict
- UNDERPRICED
- Comps
- 8 within 1.0 mi
Show comp detail 2 sales within ~0.75 mi
| Address | Dist | Beds/Ba | Sqft | Sold | Price | $/sf | Match |
|---|---|---|---|---|---|---|---|
| 245 E Cameo Dr | 0.47mi | 3/2.5 (-1) | 1,273 (-1%) | 1mo | $245,000 | $192 | 66 |
| 141 Empire Dr | 0.58mi | 3/2.5 (-1) | 1,317 (+2%) | 11mo | $230,000 | $175 | 51 |
Match score weights: distance 35% · size 25% · config 20% · recency 20%. Top-matched comps best support the ARV.
Projected returns pro-forma
3.0% appreciation · 3.0% rent growth · sell at horizon
- IRR
- 5.6%
- Equity multiple
- 1.32×
- Total profit
- $11,288
- Equity at exit
- $56,205
- IRR
- 8.6%
- Equity multiple
- 2.31×
- Total profit
- $45,749
- Equity at exit
- $86,619
Cash invested: $35,000 (down + closing). Projections, not guarantees.
Landlord ↔ Tenant lean methodology
- Overall (STATE)
- 87 Strongly Landlord-Friendly
- State Texas
- 87 Strongly Landlord-Friendly · R+5
- County
- — inherits STATE
- City
- — inherits STATE
ZIP-level market 78535
- Active inventory
- 7
- Price-to-rent
- 8.9×
Monthly cashflow live
- Estimated rent
- $1,174 medium interval (Pro) →
- Mortgage (P&I)
- −$656
- Tax from tax record
- −$281 /mo · $3,370/yr
- Insurance
- −$52
- HOA
- −$0
- Vacancy / Maint / Mgmt
- −$247
- Net cashflow
- $-61
Break-even live
UW: 25.0% down · 7.5% · 30yr · 1.5% tax · 5.0% vac · 8.0% maint · 8.0% mgmt
Financing live
Cash to close
- Down payment
- $31,250
- Closing costs
- $3,750
- Reserves months
- —
- Total cash needed
- —
Loan-product check · same deal, 3 products live
Conventional
25% down · 7.5% · 30yr
- Down + closing
- —
- Monthly P&I
- —
- Monthly cashflow
- —
- DSCR
- —
- Eligible?
- —
Personal DTI + credit; lowest rate.
DSCR
20% down · 8.5% · 30yr
- Down + closing
- —
- Monthly P&I
- —
- Monthly cashflow
- —
- DSCR
- —
- Eligible?
- —
No personal income docs; deal must DSCR.
Hard money
10% down · 12.0% · 12mo
- Down + closing
- —
- Monthly P&I
- —
- Monthly cashflow
- —
- DSCR
- —
- Eligible?
- —
Short-term bridge; refi at stabilization.
Rent comps 2 comps
| Address | Beds | Baths | Sqft | Rent | $/sqft | DOM | Units | Dist |
|---|---|---|---|---|---|---|---|---|
| 1485 E Stenger St San Benito, TX | 3.0 | 1.0 | 1296 | $1,150 | $0.89 | 13d | 1 | 0.06mi |
| 100 Woodford St Unit D San Benito, TX | 3.0 | 2.5 | 1500 | $1,550 | $1.03 | 43d | 1 | 1.33mi |
Listing history 19 events
-
2026-06-18days on market $125,000 Active 381 DOM
-
2026-06-17days on market $125,000 Active 380 DOM
-
2026-06-16days on market $125,000 Active 379 DOM
-
2026-06-15days on market $125,000 Active 378 DOM
-
2026-06-14days on market $125,000 Active 376 DOM
-
2026-06-10days on market $125,000 Active 373 DOM
-
2026-06-09days on market $125,000 Active 372 DOM
-
2026-06-08days on market $125,000 Active 371 DOM
-
2026-06-07days on market $125,000 Active 370 DOM
-
2026-06-03days on market $125,000 Active 366 DOM
-
2026-06-02days on market $125,000 Active 365 DOM
-
2026-06-01days on market $125,000 Active 364 DOM
-
2026-05-31days on market $125,000 Active 363 DOM
-
2026-05-30days on market $125,000 Active 362 DOM
-
2025-10-25price $125,000 106-char remark
Show marketing remark (106 chars)
Charming 4 bedroom 1.5 bath home with a 1 car garage. Spacious backyard. Currently has a long term tenant.
-
2025-07-22price $130,000 106-char remark
Show marketing remark (106 chars)
Charming 4 bedroom 1.5 bath home with a 1 car garage. Spacious backyard. Currently has a long term tenant.
-
2025-06-03$140,000 Active 106-char remark
Show marketing remark (106 chars)
Charming 4 bedroom 1.5 bath home with a 1 car garage. Spacious backyard. Currently has a long term tenant.
-
2019-06-27$125,000
-
1993-03-01soldstatus
ⓘ Source: listings_history table (triggers on properties + properties_extension) + one-shot
backfill from property_details.listing_events for pre-trigger history.
Tax reassessment forecast TX · Resets to sale price
- Current annual tax
- $3,370 · $281/mo
- Projected year-2 tax
- $3,370 · $281/mo
- Expected delta
- $0/yr ($0/mo · 0.0%)
ⓘ Screening estimate from a state-policy table — verify with the county assessor before closing.
Climate risk First Street
- Flood 4/10 Moderate FEMA zone X (unshaded) · 20% chance over 30 yrs
- Wildfire 4/10 Moderate
- Heat 9/10 Extreme 7 d/yr ≥110°F today · 26 d/yr by 30 yrs out
- Wind 9/10 Extreme 99% chance of damaging wind over 30 yrs
- Air quality 2/10 Low 1 unhealthy d/yr today · 1 by 30 yrs out
Nearby sold comps map
Loading sold comps map…
Walkable amenities ~0.75 mi
Loading nearby amenities…
Taxation est. · year 1
- Rental income
- $14,093
- − Mortgage interest
- −$7,002
- − Property taxes
- −$3,370
- − Insurance
- −$625
- − Repairs & maintenance
- −$1,127
- − Management
- −$1,127
- − Depreciation
- −$3,636
- Taxable loss
- −$2,796
- Est. tax savings @ 24.0%
- +$671
- After-tax cash flow
- $-57/yr
For passive investors: Depreciation is non-cash, so a rental often shows a tax loss while cash-flowing — sheltering income. Rental losses are passive: they offset passive income freely, and up to $25,000/yr can offset ordinary (W-2) income if you actively participate and your MAGI is under $100k (phasing out to $0 by $150k); unused losses carry forward. On sale, claimed depreciation is recaptured at up to 25%, and gains may owe capital-gains tax (a 1031 exchange can defer both). Figures are a year-1 estimate at your 24.0% rate — not tax advice; consult a CPA.
Schools (NCES district)
- District
- San Benito CISD
- NCES district ID
- 4838790
- Math proficiency
- 14% ▼ -31.00%
- Reading proficiency
- 27% ▼ -10.00%
- Median HH income
- $29,403
- Composite
- 16.31/100
- National rank
- #9212
- State rank
- #782 of 826 in TX
Livability — San Benito
- Score
- 66/100
- State rank
- #621
- US rank
- #11846
Category grades
Schools grade is shown separately in the Schools card above.
Census & demographics
- Census place
- San Benito, TX
- Population (ZIP)
- 435
Population outlook (Cameron County) Hauer SSP2
- Today (2025)
- 441,603 people
- By 2030
- 448,113 · +1.5%
- By 2040
- 456,385 · +3.3%
- By 2050
- 456,294 · +3.3%
- By 2075
- 423,851 · -4.0%
- By 2100
- 342,787 · -22.4%
Race, ethnicity, and origin ACS 2023
- Neighborhood character
- Predominantly Hispanic (74%)
- Race & ethnicity
- Hispanic / Latino 74% Two or more races 33% White 26%
- Hispanic origin (detail)
- Mexican 74%
- Common ancestry
- Lithuanian 5%
- Foreign-born
- 25% · Canada
- Languages at home
- 32% English-only · Spanish 68%
Political lean MEDSL · Cameron
- 2024 margin
- Lean R (+5.8) · D 46.7% · R 52.5%
- 2008→2024 swing
- -34.6pp toward R · 2008: 28.8pp · 2024: -5.8pp
- All cycles
- 2024: R+5.8 2020: D+13.2 2016: D+32.5 2012: D+32.4 2008: D+28.8
Not yet ingested
- Civics
- —
Market trends
- HPI YoY
- —
- Current HPI
- —
- Rent YoY
- —
- Metro
- —
- State GDP YoY
- ▲ 3.95%
- F500 in state
- 110
Industry mix (Fortune 500 HQ in TX)
| Industry | F500 HQs | Revenue |
|---|---|---|
| Energy | 16 | $1,198B |
|
||
| Technology | 5 | $198B |
|
||
| Engineering / Construction | 4 | $72B |
|
||
| Energy Services | 3 | $60B |
|
||
| Utilities | 3 | $41B |
|
||
| Healthcare | 2 | $330B |
|
||
Price history
+0.0% since first listed5 events — show timeline
- 2025-10-25 Price Changed $125,000 RGVMLS
- 2025-07-22 Price Changed $130,000 RGVMLS
- 2025-06-03 Listed $140,000 RGVMLS
- 2019-06-27 Listed $125,000 RGVMLS
- 1993-03-01 Sold (Public Records) — Public Records
Property tax history
+6.7%/yrLatest (2025): $3,370 · -0.0% YoY. Source: county tax records.
Cash-flow waterfall
monthlySold comps — $/sqft
last 12 mo · ≤1 miLoading sold comps…