 🔨 Auction
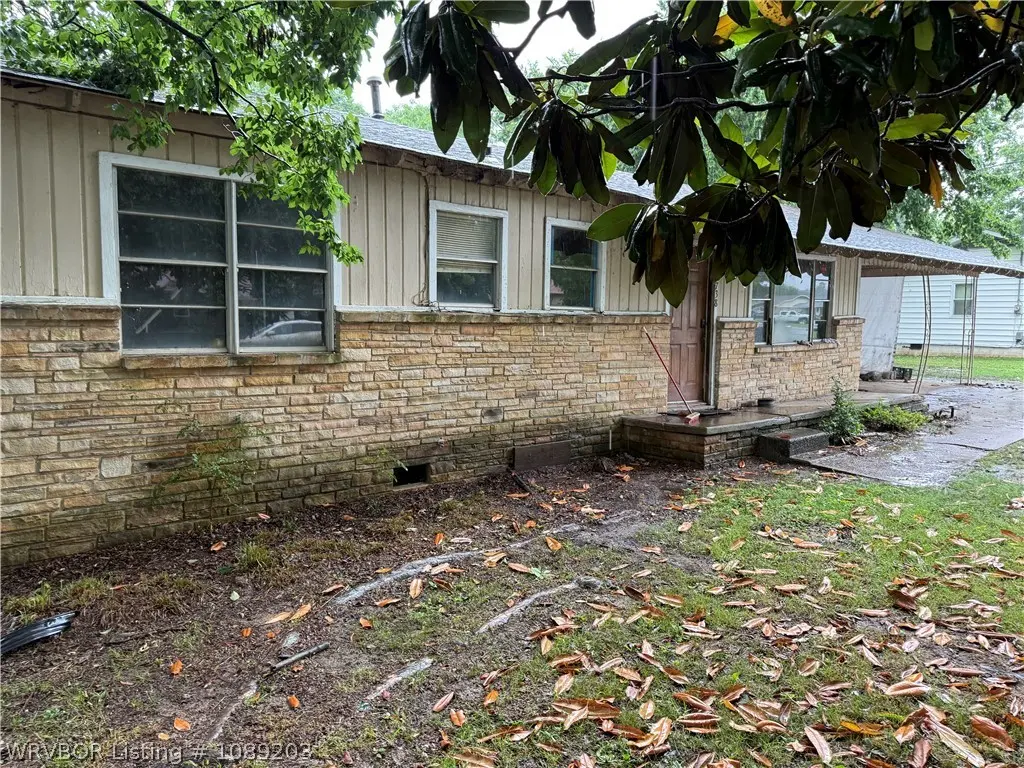
1738 Eastgate Estates Est · Van Buren, AR
Flood risk 1/10 · Minimal
- FEMA flood zone
- X (unshaded)
- Chance of flooding over 30 yrs
- 0.0%
- Est. flood insurance / yr
- $507 – $1,088
Fire risk 4/10 · Minor
- Est. fire insurance / yr
- $1,499 – $2,785
Heat risk 6/10 · Moderate
- Hot days now (above 111°F)
- 7 days/yr
- Hot days in 30 yrs
- 20 days/yr
Wind risk 2/10 · Minimal
- Chance of severe wind over 30 yrs
- 2.0%
Air-quality risk 2/10 · Minimal
- Unhealthy air days now
- 1 days/yr
- Unhealthy air days in 30 yrs
- 1 days/yr
Risk factors via First Street. Map © Google.
Why this score? — see what drove the D grade
The composite is a weighted blend of 9 inputs, each scored 0–100. Each bar is that input's sub-score; the figure is the points it added to the 100-point composite (weight × sub-score).
- Cash flow +13.4/30.0
- ARV discount +7.5/15.0
- DSCR +4.0/10.0
- 1% rule +3.8/10.0
- Rent growth +3.7/5.0
- Livability +3.5/5.0
- Schools +3.4/10.0
- Condition / age +2.5/5.0
- Appreciation +0.0/10.0
$1
🖨 Deal sheet 📄 Offer letter ✓ Due diligence
Listing remarks
Auction 6/17/2026 @ 9:30 am. Renovations are already underway on this charming, approximately 1,280-square-foot home featuring 3 bedrooms and 1.5 baths on a large corner lot. With a rental history of $1,500 per month, this property offers incredible income potential for investors or a fantastic head start for a savvy homebuyer. Don’t miss your chance to bid and finish it to your liking!
Key facts
- 0.34 acre lot
- Built 1964
- Listed 29 days
Property features AI
Exterior
- Parking: Attached carport; 1 covered space; Concrete parking surface
- Utilities: Public water; Electricity available; Natural gas available; Water available
- Home design: Single-family house; One story
- Construction: Stone and Masonite exterior; Shingle roof
- Exterior features: Front porch; Corner lot; Paved, public maintained road
Interior
- Kitchen: Dishwasher
- Flooring: Vinyl flooring
- Bathrooms: 1 full bathroom; 1 half bathroom
- Heating & cooling: Central heating; Central air conditioning
- Interior features: Dishwasher; Gas water heater
- Laundry & utility: Electric dryer hookup
Neighborhood map
What this means for you Summary
Snapshot
- This is a 3-bed/1.5-bath single-family listed at $1.
Deal economics
- At list price, monthly cash flow is $2 ($24/yr) — positive.
- The deal already cash-flows at list — no discount required.
- Meets the 1% rule at list price ($1k rent vs $1).
- Cap rate 6.3% vs local median 3.9% in Van Buren — top-decile yield for the area; either an underpriced asset or a hidden risk that comps aren't pricing in. Stress-test before assuming the spread holds.
Location & tenants
- Location reads 69/100 on livability (#75 in AR) — a middle-class / working-renter tenant base. Strengths: cost of living A+, housing A+, health & safety A; Watch: employment D, crime D-, amenities F.
- Van Buren School District (suburban): math 41% / reading 41% proficiency, ranked #62 of 238 in AR (top 26%) — families likely to look elsewhere, expect single-tenant / working-renter base with shorter leases.
- Zoned schools: Van Buren High School (math 25% / reading 44%, grade F, #92 of 292 statewide, top 37%, 1,228 students, 48% FRL) — zoned schools at 48% FRL track the district average.
- Market conditions: Rents rising fast (+4.8%/yr); 247 active listings in the ZIP; 1 comparable units currently listed for rent nearby; 47 units permitted in Crawford County in 2024 (0 in 5+ unit buildings).
Forward outlook
- Local home prices are declining (-3.0%/yr); year-one equity from $929 of loan paydown is wiped out by about $4k of value loss. Plan a longer hold.
- Crawford County population projected to shrink 7% by 2050 — rents likely to lag national; underwrite the cash flow, not the appreciation.
Negotiation context
- It's been on market 29 days — a 2% lower offer ($0) is reasonable based on typical stale-listing flexibility.
Risks & watch-outs
- Watch-outs: property tax is 201600.0% of price.
- Climate carrying-cost: extreme-heat days projected 7→20/yr by 2055 (HVAC capex compounding) — expect insurance premiums to compound above CPI over the hold.
Questions for the listing agent
- Built in 1964 — when were the roof, HVAC, electrical panel, plumbing, and water heater last replaced?
- Property tax is high relative to price — has the assessment been appealed recently, and will the sale trigger a re-assessment?
- Is there a deadline driving the sale (1031 exchange, divorce, estate, relocation)? That informs how much negotiation room exists.
- Crime grade is D in this area — have there been break-ins, vandalism, or insurance claims at this property in the last 3 years? What carrier currently insures it and at what premium?
- The area grade is low — what's the realistic commute time and amenity access for the typical tenant pool here? Any planned neighborhood developments (good or bad) we should know about?
- What's the average days-on-market for RENTAL listings here right now (not sales)? A rising rental-DOM trend means longer vacancies and softer asking-rent achievability than the comps imply.
- What's the recent tenant-quality profile in this submarket — average credit score on applications, eviction rate, late-payment / NSF rate, and stable-employment percentage? A property-management company in the area should have these aggregated.
- How much new for-sale + rental construction is in the pipeline within 1–3 miles? Heavy new supply typically softens prices + rents 12–24 months out; constrained supply supports both.
Investment metrics
- 1% rule
- 0.88% ✗
- Cap rate
- 6.31%
- Cash-on-cash
- 0.06%
- DSCR
- 1.00
- GRM
- 9.5
CMA / ARV
- ARV (on-the-fly)
- $134,400
- Comps found
- 5
Show comp detail 5 sales within ~0.75 mi
| Address | Dist | Beds/Ba | Sqft | Sold | Price | $/sf | Match |
|---|---|---|---|---|---|---|---|
| 5123 Eastgate Rd | 0.05mi | 3/2.0 | 1,225 (-4%) | 4mo | $165,500 | $135 | 85 |
| 1506 Eastgate Estate Est | 0.12mi | 3/1.5 | 1,189 (-7%) | 4mo | $125,400 | $105 | 80 |
| 1737 Eastgate Estates Est | 0.03mi | 3/1.0 | 1,456 (+14%) | 4mo | $78,500 | $54 | 70 |
| 1434 Eastgate Estates Est | 0.12mi | 3/2.0 | 1,170 (-9%) | 10mo | $195,000 | $167 | 70 |
| 1714 Pleasant Valley Pl | 0.63mi | 3/2.0 | 1,200 (-6%) | 4mo | $85,000 | $71 | 55 |
Match score weights: distance 35% · size 25% · config 20% · recency 20%. Top-matched comps best support the ARV.
Projected returns pro-forma
-3.0% appreciation · 4.76% rent growth · sell at horizon
- IRR
- -14.2%
- Equity multiple
- 0.48×
- Total profit
- $-19,509
- Equity at exit
- $20,039
- IRR
- -2.8%
- Equity multiple
- 0.79×
- Total profit
- $-7,720
- Equity at exit
- $11,620
Cash invested: $37,632 (down + closing). Projections, not guarantees.
Landlord ↔ Tenant lean methodology
- Overall (STATE)
- 92 Strongly Landlord-Friendly
- State Arkansas
- 92 Strongly Landlord-Friendly · R+14
- County
- — inherits STATE
- City
- — inherits STATE
ZIP-level market 72956
- Rents YoY
- 4.8%
- Active inventory
- 247
Monthly cashflow live
- Estimated rent
- $1,178 medium interval (Pro) →
- Mortgage (P&I)
- −$705
- Tax est. 1.5%
- −$168 /mo · $2,016/yr
- Insurance
- −$56
- HOA
- −$0
- Vacancy / Maint / Mgmt
- −$247
- Net cashflow
- $2
Break-even live
UW: 25.0% down · 7.5% · 30yr · 1.5% tax · 5.0% vac · 8.0% maint · 8.0% mgmt
Financing live
Cash to close
- Down payment
- $33,600
- Closing costs
- $4,032
- Reserves months
- —
- Total cash needed
- —
Loan-product check · same deal, 3 products live
Conventional
25% down · 7.5% · 30yr
- Down + closing
- —
- Monthly P&I
- —
- Monthly cashflow
- —
- DSCR
- —
- Eligible?
- —
Personal DTI + credit; lowest rate.
DSCR
20% down · 8.5% · 30yr
- Down + closing
- —
- Monthly P&I
- —
- Monthly cashflow
- —
- DSCR
- —
- Eligible?
- —
No personal income docs; deal must DSCR.
Hard money
10% down · 12.0% · 12mo
- Down + closing
- —
- Monthly P&I
- —
- Monthly cashflow
- —
- DSCR
- —
- Eligible?
- —
Short-term bridge; refi at stabilization.
Rent comps 1 comps
| Address | Beds | Baths | Sqft | Rent | $/sqft | DOM | Units | Dist |
|---|---|---|---|---|---|---|---|---|
| 4510 Alma Hwy Van Buren, AR | 3.0 | 2.0 | 1104 | $890 | $0.81 | 13d | 1 | 0.78mi |
Listing history 23 events
-
2026-06-17status $1 Pending 29 DOM
-
2026-06-17days on market $1 Active 29 DOM
-
2026-06-16days on market $1 Active 28 DOM
-
2026-06-15days on market $1 Active 27 DOM
-
2026-06-14days on market $1 Active 25 DOM
-
2026-06-13days on market $1 Active 24 DOM
-
2026-06-10days on market $1 Active 22 DOM
-
2026-06-09days on market $1 Active 21 DOM
-
2026-06-08days on market $1 Active 20 DOM
-
2026-06-07days on market $1 Active 19 DOM
-
2026-06-05days on market $1 Active 16 DOM
-
2026-06-03days on market $1 Active 15 DOM
-
2026-06-02days on market $1 Active 14 DOM
-
2026-06-01days on market $1 Active 13 DOM
-
2026-05-31days on market $1 Active 12 DOM
-
2026-05-30days on market $1 Active 11 DOM
-
2026-05-19$1 Active
-
2014-08-28soldstatus $64,000
-
2011-12-05soldstatus $61,000
-
1991-04-19soldstatus $47,000
-
1986-11-14soldstatus $45,000
-
1986-10-14soldstatus $40,000
-
1986-10-14soldstatus $43,000
ⓘ Source: listings_history table (triggers on properties + properties_extension) + one-shot
backfill from property_details.listing_events for pre-trigger history.
Climate risk First Street
- Flood 1/10 Low FEMA zone X (unshaded) · 0% chance over 30 yrs
- Wildfire 4/10 Moderate
- Heat 6/10 Major 7 d/yr ≥111°F today · 20 d/yr by 30 yrs out
- Wind 2/10 Low 2% chance of damaging wind over 30 yrs
- Air quality 2/10 Low 1 unhealthy d/yr today · 1 by 30 yrs out
Nearby sold comps map
Loading sold comps map…
Walkable amenities ~0.75 mi
Loading nearby amenities…
Taxation est. · year 1
- Rental income
- $14,139
- − Mortgage interest
- −$7,528
- − Property taxes
- −$2,016
- − Insurance
- −$672
- − Repairs & maintenance
- −$1,131
- − Management
- −$1,131
- − Depreciation
- −$3,910
- Taxable loss
- −$2,249
- Est. tax savings @ 24.0%
- +$540
- After-tax cash flow
- $564/yr
For passive investors: Depreciation is non-cash, so a rental often shows a tax loss while cash-flowing — sheltering income. Rental losses are passive: they offset passive income freely, and up to $25,000/yr can offset ordinary (W-2) income if you actively participate and your MAGI is under $100k (phasing out to $0 by $150k); unused losses carry forward. On sale, claimed depreciation is recaptured at up to 25%, and gains may owe capital-gains tax (a 1031 exchange can defer both). Figures are a year-1 estimate at your 24.0% rate — not tax advice; consult a CPA.
Schools (NCES district)
- District
- Van Buren School District
- NCES district ID
- 0513410
- Math proficiency
- 41% ▼ -8.00%
- Reading proficiency
- 41% ▼ -4.00%
- Median HH income
- $40,350
- Composite
- 34.41/100
- National rank
- #5201
- State rank
- #62 of 238 in AR
Livability — Van Buren
- Score
- 69/100
- State rank
- #75
- US rank
- #8898
Category grades
Schools grade is shown separately in the Schools card above.
Census & demographics
- County
- Crawford County · 34,546 people
- City population
- 34,546
- Metro
- Fort Smith, AR-OK
- Population (ZIP)
- 34,546
- Household income
- $62,988
- Rent vs Own
- Severe rent burden
- 571.0
Population outlook (Crawford County) Hauer SSP2
- Today (2025)
- 62,108 people
- By 2030
- 61,519 · -0.9%
- By 2040
- 59,735 · -3.8%
- By 2050
- 57,521 · -7.4%
- By 2075
- 53,143 · -14.4%
- By 2100
- 49,596 · -20.1%
Race, ethnicity, and origin ACS 2023
- Neighborhood character
- Predominantly White (76%)
- Race & ethnicity
- White 76% Hispanic / Latino 12% Two or more races 11% Asian 2% Native American 1% Black 1%
- Hispanic origin (detail)
- Mexican 5%
- Common ancestry
- Lithuanian 1% Slovak 1% Romanian 1%
- Foreign-born
- 6% · Canada
- Languages at home
- 89% English-only · Spanish 10%
Political lean MEDSL · Crawford
- 2024 margin
- Solid R (+58.2) · D 19.9% · R 78.1% · Other 2.0%
- 2008→2024 swing
- -12.1pp toward R · 2008: -46.0pp · 2024: -58.2pp
- All cycles
- 2024: R+58.2 2020: R+56.7 2016: R+55.0 2012: R+49.9 2008: R+46.0
Not yet ingested
- Civics
- —
Market trends
- HPI YoY
- ▼ -156.05%
- Current HPI
- 221.3066
- Rent YoY
- ▲ 4.76%
- Metro
- Fort Smith, AR-OK
- State GDP YoY
- ▲ 3.80%
- F500 in state
- 10
Industry mix (Fortune 500 HQ in AR)
| Industry | F500 HQs | Revenue |
|---|---|---|
| Retail | 1 | $681B |
|
||
| Food / Agriculture | 1 | $53B |
|
||
| Retail / Energy | 1 | $22B |
|
||
| Transportation / Logistics | 1 | $12B |
|
||
| Energy | 1 | $4B |
|
||
Price history
+60.0% since first listed7 events — show timeline
- 2026-05-19 Listed $1 WRVBOR
- 2014-08-28 Sold (Public Records) $64,000 Public Records
- 2011-12-05 Sold (Public Records) $61,000 Public Records
- 1991-04-19 Sold (Public Records) $47,000 Public Records
- 1986-11-14 Sold (Public Records) $45,000 Public Records
- 1986-10-14 Sold (Public Records) $43,000 Public Records
- 1986-10-14 Sold (Public Records) $40,000 Public Records
Property tax history
+4.8%/yrLatest (2025): $977 · +16.1% YoY. Source: county tax records.
Cash-flow waterfall
monthlySold comps — $/sqft
last 12 mo · ≤1 miLoading sold comps…