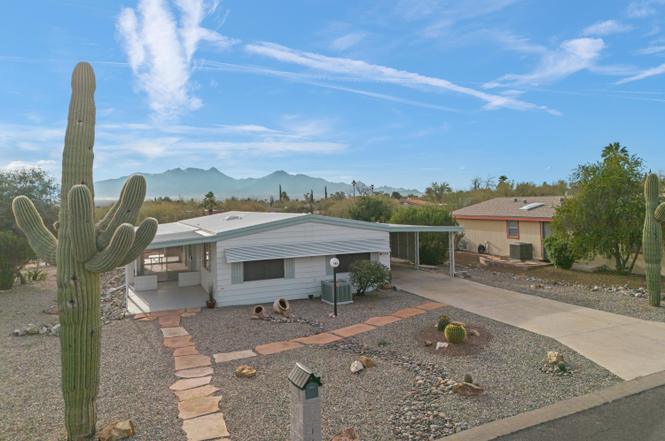
145 W Pinon Dr · Green Valley, AZ
Flood risk 1/10 · Minimal
- FEMA flood zone
- X (unshaded)
- Chance of flooding over 30 yrs
- 0.0%
- Est. flood insurance / yr
- $507 – $1,088
Fire risk 6/10 · Moderate
- Est. fire insurance / yr
- $610 – $1,132
Heat risk 7/10 · Major
- Hot days now (above 106°F)
- 7 days/yr
- Hot days in 30 yrs
- 18 days/yr
Wind risk 1/10 · Minimal
- Chance of severe wind over 30 yrs
- —
Air-quality risk 1/10 · Minimal
- Unhealthy air days now
- 0 days/yr
- Unhealthy air days in 30 yrs
- 0 days/yr
Risk factors via First Street. Map © Google.
Why this score? — see what drove the F grade
The composite is a weighted blend of 9 inputs, each scored 0–100. Each bar is that input's sub-score; the figure is the points it added to the 100-point composite (weight × sub-score).
- Cash flow +13.0/30.0
- DSCR +3.9/10.0
- Rent growth +3.9/5.0
- Schools +3.3/10.0
- Livability +3.1/5.0
- 1% rule +2.8/10.0
- Condition / age +2.5/5.0
- ARV discount +0.0/15.0
- Appreciation +0.0/10.0
$210,000
🖨 Deal sheet 📄 Offer letter ✓ Due diligence
Listing remarks
Beautiful mountain view! This 2-bedroom, 2-bathroom home sits on a very large lot with front and back yards. The living room features windows that frame that everchanging mountain view and a beautiful patio stretches across the entire back of the home for outdoor enjoyment The kitchen looks out on a small hidden patio with a backdrop of mature shrubs for privacy. There's loads of cupboard space in both the kitchen and entryway/laundry room. The primary bedroom includes one full wall of closet space and a large bathroom with walk-in shower. An enclosed Arizona room has sliding glass doors to allow fresh air in year-round. This home includes a workshop plus a storage area in front of the carp
Key facts
- Back yard
- Hidden patio
- Large lot
Tags
Property features AI
Finance
- Other: Zoning: Pima County - TH
- HOA & community: Community association (Desert Pueblo) with $65 monthly fee; HOA fee includes street maintenance; Community amenities: clubhouse, pool, spa/hot tub, recreation room, shuffleboard, fitness center, rec center, street lights, walking trail
Exterior
- Parking: Covered parking; 1 carport space
- Utilities: Water provided by a water company; Sewer connected
- Home design: Manufactured home; Single-story; Faces west
- Construction: Frame construction; Metal roof
- Exterior features: Patio; Decorative gravel; Borders common area; East/West exposure; Paved road access; Spa/Hot Tub (on property)
Interior
- Kitchen: Dishwasher; Disposal; Refrigerator; Electric range; Electric oven
- Flooring: Carpet; Vinyl
- Bathrooms: 2 full bathrooms
- Heating & cooling: Heat pump for heating and cooling
- Interior features: Exhaust fan; Water purifier; Workshop (outbuilding)
- Laundry & utility: Dedicated laundry room with washer and dryer
Neighborhood map
What this means for you Summary
Snapshot
- This is a 2-bed/2.0-bath manufactured listed at $210k.
Deal economics
- At list price, monthly cash flow is $-10 ($-116/yr) — negative.
- To cash-flow at today's rent, offer at most $208k (0.8% below list).
- To meet the 1% rule (rent ≥ 1% of price), the offer needs to be $163k (22.5% below list).
- Recommended offer: $163k (22.5% below list) — sets the bar for 1% rule.
- Cap rate 6.2% vs local median 4.5% in Green Valley — top-decile yield for the area; either an underpriced asset or a hidden risk that comps aren't pricing in. Stress-test before assuming the spread holds.
Location & tenants
- Location reads 61/100 on livability (#165 in AZ) — a middle-class / working-renter tenant base. Strengths: cost of living A+, housing A+; Watch: amenities F, commute F, health & safety F.
- Continental Elementary District (4416) (rural): math 35% / reading 42% proficiency, ranked #72 of 249 in AZ (top 29%) — families likely to look elsewhere, expect single-tenant / working-renter base with shorter leases; only 19% free/reduced lunch — higher-income household profile.
- Zoned schools: Continental Elementary School (math 35% / reading 42%, grade F, #418 of 1,109 statewide, top 38%, 639 students, 31% FRL).
- Market conditions: Rents rising fast (+5.6%/yr); 411 active listings in the ZIP; 20 comparable units currently listed for rent nearby; rentals leasing fast (median 11d on market — plan ~1-2 weeks tenant-placement turnaround); 5,268 units permitted in Pima County in 2024 (996 in 5+ unit buildings).
- This rent runs 30% of the median local income ($65k/yr) — at the standard rent-burdened threshold; future hikes will face affordability resistance.
Forward outlook
- Local home prices are declining (-3.0%/yr); year-one equity from $1k of loan paydown is wiped out by about $6k of value loss. Plan a longer hold.
- Pima County population projected at +8% by 2050 — modest demand growth; plan on rents tracking national, not racing it.
Negotiation context
- It's been on market 107 days — a 9% lower offer ($191k) is reasonable based on typical stale-listing flexibility.
- Current owner paid $53k; list at $210k implies a 296% gain — meaningful room to come down on a strong offer.
Risks & watch-outs
- Climate carrying-cost: major wildfire risk; extreme-heat days projected 7→18/yr by 2055 (HVAC capex compounding) — expect insurance premiums to compound above CPI over the hold.
Questions for the listing agent
- What do current leases actually rent for vs. the listed asking? Can we see a recent rent roll and the last 12 months of T-12 income?
- It's been on market 107 days. Have you received any prior offers? Is the seller open to a 22% concession, seller financing, or rate buy-down credit?
- Built in 1979 — when were the roof, HVAC, electrical panel, plumbing, and water heater last replaced?
- What does the HOA fee cover, when was the last increase, and are there any pending special assessments or reserve-fund shortfalls?
- Why hasn't it sold? Are there any deal-killer items the seller is aware of (foundation, flood, title, zoning, code violations)?
- Is there a deadline driving the sale (1031 exchange, divorce, estate, relocation)? That informs how much negotiation room exists.
- The area grade is low — what's the realistic commute time and amenity access for the typical tenant pool here? Any planned neighborhood developments (good or bad) we should know about?
- What's the average days-on-market for RENTAL listings here right now (not sales)? A rising rental-DOM trend means longer vacancies and softer asking-rent achievability than the comps imply.
- What's the recent tenant-quality profile in this submarket — average credit score on applications, eviction rate, late-payment / NSF rate, and stable-employment percentage? A property-management company in the area should have these aggregated.
- How much new for-sale + rental construction is in the pipeline within 1–3 miles? Heavy new supply typically softens prices + rents 12–24 months out; constrained supply supports both.
Investment metrics
- 1% rule
- 0.78% ✗
- Cap rate
- 6.24%
- Cash-on-cash
- -0.20%
- DSCR
- 0.99
- GRM
- 10.7
CMA / ARV
- ARV (on-the-fly)
- $166,656
- Comps found
- 12
Show comp detail 12 sales within ~0.75 mi
| Address | Dist | Beds/Ba | Sqft | Sold | Price | $/sf | Match |
|---|---|---|---|---|---|---|---|
| 145 W Pinon Dr | 0.00mi | 2/2.0 | 1,344 (0%) | 0mo | $195,000 | $145 | 100 |
| 30 W Rosa Dr | 0.13mi | 2/2.0 | 1,344 (0%) | 2mo | $143,500 | $107 | 93 |
| 182 W Palma Dr | 0.11mi | 2/2.0 | 1,320 (-2%) | 3mo | $155,000 | $117 | 89 |
| 240 W Cumaro Dr | 0.31mi | 2/2.0 | 1,392 (+4%) | 1mo | $135,000 | $97 | 79 |
| 161 W Olive Dr | 0.35mi | 3/2.0 (+1) | 1,347 (+0%) | 1mo | $107,500 | $80 | 78 |
| 266 W Pinon Dr | 0.22mi | 2/2.0 | 1,232 (-8%) | 2mo | $168,000 | $136 | 74 |
| 105 W Mora Dr | 0.32mi | 2/2.0 | 1,440 (+7%) | 3mo | $249,000 | $173 | 70 |
| 267 W Tuna Dr | 0.33mi | 2/2.0 | 1,248 (-7%) | 3mo | $189,000 | $151 | 70 |
| 32 W Pinon Dr | 0.09mi | 2/1.0 | 1,190 (-12%) | 5mo | $118,000 | $99 | 69 |
| 270 W Pinon | 0.23mi | 3/2.0 (+1) | 1,440 (+7%) | 5mo | $179,000 | $124 | 68 |
| 1840 N Pacana Way | 0.42mi | 2/2.0 | 1,456 (+8%) | 2mo | $160,000 | $110 | 65 |
| 269 W Mora Dr | 0.30mi | 3/2.0 (+1) | 1,152 (-14%) | 1mo | $150,000 | $130 | 56 |
Match score weights: distance 35% · size 25% · config 20% · recency 20%. Top-matched comps best support the ARV.
Projected returns pro-forma
-3.0% appreciation · 5.6% rent growth · sell at horizon
- IRR
- -14.1%
- Equity multiple
- 0.48×
- Total profit
- $-30,343
- Equity at exit
- $31,312
- IRR
- -2.0%
- Equity multiple
- 0.85×
- Total profit
- $-8,583
- Equity at exit
- $18,157
Cash invested: $58,800 (down + closing). Projections, not guarantees.
Landlord ↔ Tenant lean methodology
- Overall (STATE)
- 87 Strongly Landlord-Friendly
- State Arizona
- 87 Strongly Landlord-Friendly · R+3
- County
- — inherits STATE
- City
- — inherits STATE
ZIP-level market 85614
- Rents YoY
- 5.6%
- Active inventory
- 411
- Price-to-rent
- 10.7×
Monthly cashflow live
- Estimated rent
- $1,628 high interval (Pro) →
- Mortgage (P&I)
- −$1,101
- Tax from tax record
- −$42 /mo · $508/yr
- Insurance
- −$88
- HOA
- −$65
- Vacancy / Maint / Mgmt
- −$342
- Net cashflow
- $-10
Break-even live
UW: 25.0% down · 7.5% · 30yr · 1.5% tax · 5.0% vac · 8.0% maint · 8.0% mgmt
Financing live
Cash to close
- Down payment
- $52,500
- Closing costs
- $6,300
- Reserves months
- —
- Total cash needed
- —
Loan-product check · same deal, 3 products live
Conventional
25% down · 7.5% · 30yr
- Down + closing
- —
- Monthly P&I
- —
- Monthly cashflow
- —
- DSCR
- —
- Eligible?
- —
Personal DTI + credit; lowest rate.
DSCR
20% down · 8.5% · 30yr
- Down + closing
- —
- Monthly P&I
- —
- Monthly cashflow
- —
- DSCR
- —
- Eligible?
- —
No personal income docs; deal must DSCR.
Hard money
10% down · 12.0% · 12mo
- Down + closing
- —
- Monthly P&I
- —
- Monthly cashflow
- —
- DSCR
- —
- Eligible?
- —
Short-term bridge; refi at stabilization.
Rent comps 20 comps
| Address | Beds | Baths | Sqft | Rent | $/sqft | DOM | Units | Dist |
|---|---|---|---|---|---|---|---|---|
| 1321 N Paseo Maravilloso Green Valley, AZ | 2.0 | 2.0 | 1781 | $1,500 | $0.84 | 3d | 1 | 0.30mi |
| 1567 N Paseo La Tinaja Green Valley, AZ | 2.0 | 2.0 | 1071 | $1,250 | $1.17 | 1d | 1 | 0.41mi |
| 1792 N Rio Mayo Green Valley, AZ | 2.0 | 2.0 | 1678 | $1,550 | $0.92 | 17d | 1 | 0.51mi |
| 1091 W Beta St Green Valley, AZ | 2.0–3.0 | 2.0 | 917 | $1,350 | $1.47 | 1d | 5 | 0.61mi |
| 457 W Windham Blvd Green Valley, AZ | 2.0 | 2.0 | 1369 | $2,300 | $1.68 | 1d | 1 | 0.64mi |
| 724 W Rio Moctezuma Green Valley, AZ | 2.0 | 2.0 | 1234 | $1,450 | $1.18 | 10d | 1 | 0.81mi |
| 312 E Calle Cerita Green Valley, AZ | 3.0 | 2.0 | 1406 | $1,700 | $1.21 | 10d | 1 | 0.83mi |
| 2181 N Avenida Tabica Green Valley, AZ | 3.0 | 2.0 | 1433 | $1,695 | $1.18 | 1d | 1 | 0.85mi |
| 513 W Knotwood St Green Valley, AZ | 2.0 | 2.0 | 1593 | $1,600 | $1.00 | 14d | 1 | 0.98mi |
| 513 W Knotwood St Green Valley, AZ | 2.0 | 2.0 | 1593 | $1,600 | $1.00 | 16d | 1 | 0.98mi |
| 18878 S Esherton Dr Green Valley, AZ | 3.0 | 2.0 | 1329 | $1,850 | $1.39 | 23d | 1 | 1.00mi |
| 18828 S Esherton Dr Green Valley, AZ | 3.0 | 2.5 | 1466 | $1,625 | $1.11 | 3d | 1 | 1.07mi |
| 335 E Calle Nacrita Green Valley, AZ | 3.0 | 2.0 | 1735 | $1,785 | $1.03 | 2d | 1 | 1.11mi |
| 2535 N Avenida Tabica Green Valley, AZ | 3.0 | 2.0 | 1483 | $1,725 | $1.16 | 43d | 1 | 1.13mi |
| 18744 S Via Santa Bonita Sahuarita, AZ | 2.0 | 2.0 | 1261 | $1,595 | $1.26 | 43d | 1 | 1.16mi |
| 390 N Calle de las Profetas Green Valley, AZ | 2.0 | 1.0 | 965 | $1,250 | $1.30 | 3d | 1 | 1.18mi |
| 359 N Calle del Chancero Green Valley, AZ | 2.0 | 2.0 | 1061 | $1,475 | $1.39 | 16d | 1 | 1.22mi |
| 327 N Calle del Chancero Green Valley, AZ | 2.0 | 2.0 | 1343 | $1,400 | $1.04 | 3d | 1 | 1.26mi |
| 257 E Los Rincones Green Valley, AZ | 2.0 | 2.0 | 1800 | $2,200 | $1.22 | 23d | 1 | 1.29mi |
| 230 N Calle Acuarela Unit 230 Green Valley, AZ | 2.0 | 1.0 | 965 | $1,400 | $1.45 | 3d | 1 | 1.32mi |
HOA detail
- Monthly dues
- $65 · $780/yr
Listing history 6 events
-
2026-05-10status Pending
-
2026-03-13price $210,000
-
2026-01-23$215,000 Active
-
1983-08-01soldstatus $53,000
-
1978-12-01soldstatus $8,500
-
1977-10-01soldstatus $5,500
ⓘ Source: listings_history table (triggers on properties + properties_extension) + one-shot
backfill from property_details.listing_events for pre-trigger history.
Tax reassessment forecast AZ · Resets to sale price
- Current annual tax
- $508 · $42/mo
- Projected year-2 tax
- $1,386 · $116/mo
- Expected delta
- +$878/yr (+$73/mo · 172.7%)
ⓘ Screening estimate from a state-policy table — verify with the county assessor before closing.
Climate risk First Street
- Flood 1/10 Low FEMA zone X (unshaded) · 0% chance over 30 yrs
- Wildfire 6/10 Major
- Heat 7/10 Severe 7 d/yr ≥106°F today · 18 d/yr by 30 yrs out
- Wind 1/10 Low
- Air quality 1/10 Low 0 unhealthy d/yr today · 0 by 30 yrs out
Nearby sold comps map
Loading sold comps map…
Walkable amenities ~0.75 mi
Loading nearby amenities…
Taxation est. · year 1
- Rental income
- $19,541
- − Mortgage interest
- −$11,763
- − Property taxes
- −$508
- − Insurance
- −$1,050
- − Repairs & maintenance
- −$1,563
- − Management
- −$1,563
- − HOA
- −$780
- − Depreciation
- −$6,109
- Taxable loss
- −$3,796
- Est. tax savings @ 24.0%
- +$911
- After-tax cash flow
- $795/yr
For passive investors: Depreciation is non-cash, so a rental often shows a tax loss while cash-flowing — sheltering income. Rental losses are passive: they offset passive income freely, and up to $25,000/yr can offset ordinary (W-2) income if you actively participate and your MAGI is under $100k (phasing out to $0 by $150k); unused losses carry forward. On sale, claimed depreciation is recaptured at up to 25%, and gains may owe capital-gains tax (a 1031 exchange can defer both). Figures are a year-1 estimate at your 24.0% rate — not tax advice; consult a CPA.
Schools (NCES district)
- District
- Continental Elementary District (4416)
- NCES district ID
- 0402250
- Math proficiency
- 35% ▼ -11.00%
- Reading proficiency
- 42% ▬ 0.00%
- Median HH income
- $48,475
- Composite
- 33.08/100
- National rank
- #5565
- State rank
- #72 of 249 in AZ
Livability — Green Valley
- Score
- 61/100
- State rank
- #165
- US rank
- #18276
Category grades
Schools grade is shown separately in the Schools card above.
Census & demographics
- Census place
- Green Valley, AZ
- County
- Pima County · 1,012,107 people
- City population
- 25,381
- Metro
- Tucson, AZ
- Population (ZIP)
- 25,381
- Household income
- $64,879
- Rent vs Own
- Severe rent burden
- 860.0
Population outlook (Pima County) Hauer SSP2
- Today (2025)
- 1,066,056 people
- By 2030
- 1,086,684 · +1.9%
- By 2040
- 1,117,160 · +4.8%
- By 2050
- 1,149,778 · +7.9%
- By 2075
- 1,271,480 · +19.3%
- By 2100
- 1,321,160 · +23.9%
Race, ethnicity, and origin ACS 2023
- Neighborhood character
- Predominantly White (80%)
- Race & ethnicity
- White 80% Hispanic / Latino 15% Two or more races 7% Black 2%
- Hispanic origin (detail)
- Mexican 14%
- Common ancestry
- Portuguese 4% Slovak 4% Italian 3%
- Foreign-born
- 8% · Canada, China
- Languages at home
- 87% English-only · Spanish 9% French/Haitian/Cajun 1% German/W. Germanic 0%
Political lean MEDSL · Pima
- 2024 margin
- D (+15.2) · D 57.0% · R 41.8% · Other 1.2%
- 2008→2024 swing
- +9.1pp toward D · 2008: 6.1pp · 2024: 15.2pp
- All cycles
- 2024: D+15.2 2020: D+18.7 2016: D+13.5 2012: D+5.8 2008: D+6.1
Not yet ingested
- Civics
- —
Market trends
- HPI YoY
- ▼ -231.05%
- Current HPI
- 250.5933
- Rent YoY
- ▲ 5.60%
- Metro
- Tucson, AZ
- State GDP YoY
- ▲ 4.54%
- F500 in state
- 20
Industry mix (Fortune 500 HQ in AZ)
| Industry | F500 HQs | Revenue |
|---|---|---|
| Technology | 2 | $13B |
|
||
| Mining / Metals | 1 | $23B |
|
||
| Environmental Services | 1 | $16B |
|
||
| Metals / Steel | 1 | $14B |
|
||
| Technology Distribution | 1 | $9B |
|
||
| Homebuilding | 1 | $8B |
|
||
Price history
+3718.2% since first listed6 events — show timeline
- 2026-05-10 Pending — MLSSAZ
- 2026-03-13 Price Changed $210,000 MLSSAZ
- 2026-01-23 Listed $215,000 MLSSAZ
- 1983-08-01 Sold (Public Records) $53,000 Public Records
- 1978-12-01 Sold (Public Records) $8,500 Public Records
- 1977-10-01 Sold (Public Records) $5,500 Public Records
Property tax history
-2.3%/yrLatest (2025): $508 · +4.6% YoY. Source: county tax records.
Cash-flow waterfall
monthlySold comps — $/sqft
last 12 mo · ≤1 miLoading sold comps…