 Triplex
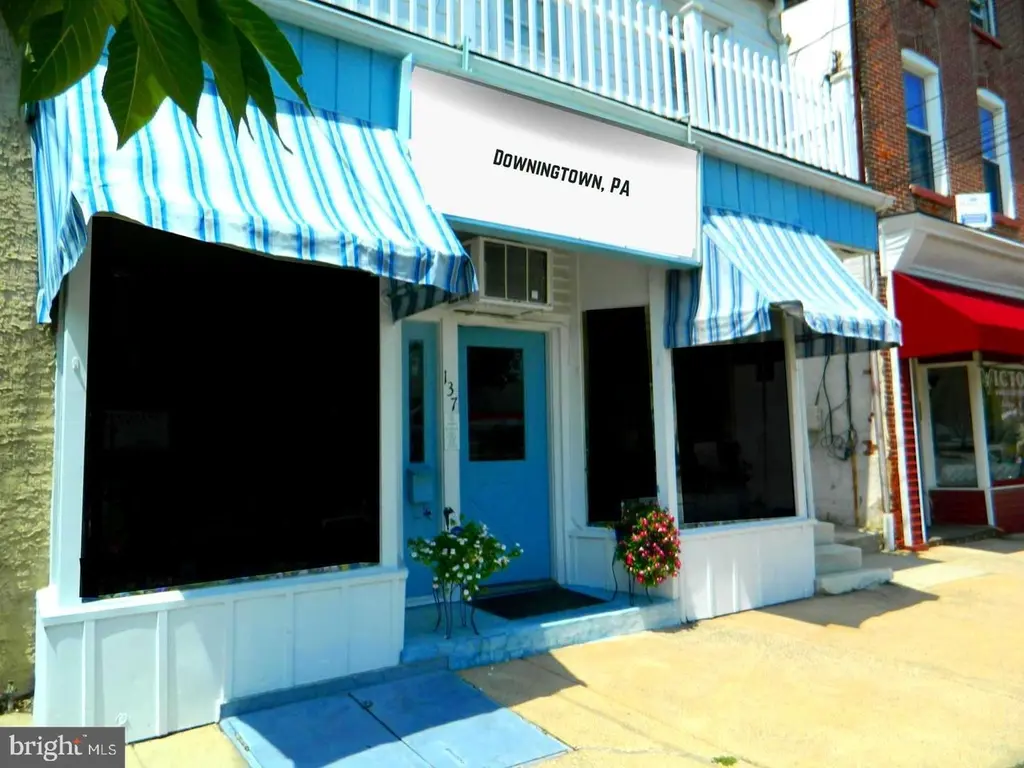
137 W Lancaster Ave · Downingtown, PA
Flood risk No data
- FEMA flood zone
- —
- Chance of flooding over 30 yrs
- —
- Est. flood insurance / yr
- —
Fire risk No data
- Est. fire insurance / yr
- —
Heat risk No data
- Hot days now (above threshold)
- —
- Hot days in 30 yrs
- —
Wind risk No data
- Chance of severe wind over 30 yrs
- —
Air-quality risk No data
- Unhealthy air days now
- —
- Unhealthy air days in 30 yrs
- —
Risk factors via First Street. Map © Google.
Why this score? — see what drove the B grade
The composite is a weighted blend of 9 inputs, each scored 0–100. Each bar is that input's sub-score; the figure is the points it added to the 100-point composite (weight × sub-score).
- Cash flow +30.0/30.0
- 1% rule +10.0/10.0
- DSCR +10.0/10.0
- Schools +6.9/10.0
- ARV discount +4.6/15.0
- Livability +4.5/5.0
- Rent growth +3.0/5.0
- Condition / age +2.2/5.0
- Appreciation +0.0/10.0
$424,900
🖨 Deal sheet 📄 Offer letter ✓ Due diligence
Multi-family units
County records classify this as Multi-Family (2-4 Unit). Listing-text estimate: 3 units. confirmed
Listing remarks
137 W Lancaster Ave Downingtown. mixed unit. Store front and 1 bedroom apartment with 2 bathroom. 3rd floor used to be finished could be finished again for additional bedroom. Call agent for Potential Income for store front with 1 full bathroom (includes shower) and the 2nd floor apartment. This used to be a 3 unit. Owner wanted to have a large store front and turned this into a larger first floor store front. There is 8 parking spots for this lot. Potential Cap rate is 6.8%. This is a good investment for you or a place for your business? The owner is relocating and business is not included. This is 1 block away from the Downingtown Train Station and half a block away from the Septa Bus S
Key facts
- 5,600 sq ft lot
- 8 parking spots
- Built 1950
Property features AI
Finance
- Financial info: Two total units with both currently leased; Owner-occupied existing lease type; Rent control does not apply
Exterior
- Parking: Driveway with space for 8 vehicles; Private, secure parking (8 total garage/parking spaces)
- Utilities: Public water; Public sewer; Natural gas available; Electric available; Cable internet service
- Home design: Semi-detached property; Fee simple ownership; Excellent condition; Estimated year built
- Construction: Frame and stucco construction; Block and other foundation types; Building not winterized; Above-grade and below-grade structures
- Exterior features: Awnings; Rear yard; Road frontage
Interior
- Bedrooms: Contains a single-room unit and a two-bedroom unit (total 2 units)
- Heating & cooling: Hot water heating; Natural gas heating fuel; Window air conditioning units; 200+ amp electrical service
- Interior features: Basement with dirt floor; Level entry on main level; Multiple access exits (2+)
Neighborhood map
What this means for you Summary
Snapshot
- This is a 3 × 2-bed/2.0-bath units multifamily listed at $425k. Condition is rated fair.
Deal economics
- At list price, monthly cash flow is $3k ($33k/yr) — positive. Per door: $912/mo.
- The deal already cash-flows at list — no discount required.
- Meets the 1% rule at list price ($7k rent vs $425k).
- Recommended offer: $374k (12.0% below list) — sets the bar for market timing.
- Cap rate 14.0% vs local median 3.1% in Downingtown — top-decile yield for the area; either an underpriced asset or a hidden risk that comps aren't pricing in. Stress-test before assuming the spread holds.
Location & tenants
- Location reads 91/100 on livability (#13 in PA, #56 nationally) — a professional / high-income tenant draw. Strengths: schools A+, amenities A+, employment A+.
- Downingtown Area SD (suburban): math 67% / reading 83% proficiency, ranked #9 of 539 in PA (top 2%) — strong family-tenant draw, lease renewals of 3-5y typical; only 7% free/reduced lunch — higher-income household profile.
- Market conditions: Rents rising (+2.0%/yr); 232 active listings in the ZIP; high-income renter base; 1,513 units permitted in Chester County in 2024 (354 in 5+ unit buildings).
- At $7,179/mo this rent would consume 60% of the median local household income ($143k/yr) (locally 689% of renters already pay >50% of income on rent) — very limited rent-growth headroom before tenants either downsize or default.
Forward outlook
- Local home prices are declining (-3.0%/yr); year-one equity from $3k of loan paydown is wiped out by about $13k of value loss. Plan a longer hold.
- Chester County population projected at +6% by 2050 — modest demand growth; plan on rents tracking national, not racing it.
- At projected returns (-3.0% appreciation + 2.0% rent growth), your $119k cash investment doubles in ~5 years — after that, you're playing with house money.
Negotiation context
- It's been on market 1442 days — a 12% lower offer ($374k) is reasonable based on typical stale-listing flexibility.
- 4 sale attempts since 5y ago; this cycle's ask has dropped $24k (5%) from the opening price — seller is motivated, your offer sets the floor, not the list.
Risks & watch-outs
- Watch-outs: built in 1950 — expect roof / HVAC / electrical / plumbing capex.
Questions for the listing agent
- It's been on market 1442 days. Have you received any prior offers? Is the seller open to a 12% concession, seller financing, or rate buy-down credit?
- Can we see the unit-by-unit rent roll, current vacancy, and any below-market leases? What's the average tenancy length?
- What capital expenditures (roof, boiler, parking lot, exteriors) have been made in the last 5 years, and what's planned in the next 2?
- Have any recent inspections been done? Can we get a copy of the seller's disclosures and any deferred-maintenance estimates?
- Built in 1950 — when were the roof, HVAC, electrical panel, plumbing, and water heater last replaced?
- Why hasn't it sold? Are there any deal-killer items the seller is aware of (foundation, flood, title, zoning, code violations)?
- Is there a deadline driving the sale (1031 exchange, divorce, estate, relocation)? That informs how much negotiation room exists.
- Schools are A-rated — typically a magnet for longer-tenancy family renters. What's the average tenant stay here, and is there a school-zone premium baked into asking?
- What's the average days-on-market for RENTAL listings here right now (not sales)? A rising rental-DOM trend means longer vacancies and softer asking-rent achievability than the comps imply.
- What's the recent tenant-quality profile in this submarket — average credit score on applications, eviction rate, late-payment / NSF rate, and stable-employment percentage? A property-management company in the area should have these aggregated.
- How much new apartment / multifamily construction is in the pipeline within 1–3 miles? Heavy new supply (>2% of stock underway) typically softens rents 12–24 months out; light construction supports rent growth.
Investment metrics
- 1% rule
- 1.69% ✓
- Cap rate
- 14.02%
- Cash-on-cash
- 27.59%
- DSCR
- 2.23
- GRM
- 4.9
CMA / ARV
- ARV (median comp)
- $399,478
- List price
- $424,900
- Delta
- 6.36%
- Verdict
- FAIR
- Comps
- 4 within 1.0 mi
Projected returns pro-forma
-3.0% appreciation · 2.03% rent growth · sell at horizon
- IRR
- 20.6%
- Equity multiple
- 1.83×
- Total profit
- $98,511
- Equity at exit
- $63,354
- IRR
- 28.1%
- Equity multiple
- 3.38×
- Total profit
- $282,600
- Equity at exit
- $36,738
Cash invested: $118,972 (down + closing). Projections, not guarantees.
Landlord ↔ Tenant lean methodology
- Overall (STATE)
- 62 Landlord-Friendly
- State Pennsylvania
- 62 Landlord-Friendly · EVEN
- County
- — inherits STATE
- City
- — inherits STATE
ZIP-level market 19335
- Rents YoY
- 2.0%
- Active inventory
- 232
- Price-to-rent
- 14.8×
Monthly cashflow live
- Estimated rent
- $7,179 high interval (Pro) →
- Mortgage (P&I)
- −$2,228
- Tax est. 1.5%
- −$531 /mo · $6,374/yr
- Insurance
- −$177
- HOA
- −$0
- Vacancy / Maint / Mgmt
- −$1,508
- Net cashflow
- $2,735
Break-even live
3-unit breakdown (identical units grouped — click to expand)
| Units | Beds | Baths | Est. rent |
|---|---|---|---|
| 3× units | 2 | 2 | $7,179 |
| #1 | 2 | 2 | $2,393 |
| #2 | 2 | 2 | $2,393 |
| #3 | 2 | 2 | $2,393 |
| Total (3 units) | $7,179 | ||
UW: 25.0% down · 7.5% · 30yr · 1.5% tax · 5.0% vac · 8.0% maint · 8.0% mgmt
Financing live
Cash to close
- Down payment
- $106,225
- Closing costs
- $12,747
- Reserves months
- —
- Total cash needed
- —
Loan-product check · same deal, 3 products live
Conventional
25% down · 7.5% · 30yr
- Down + closing
- —
- Monthly P&I
- —
- Monthly cashflow
- —
- DSCR
- —
- Eligible?
- —
Personal DTI + credit; lowest rate.
DSCR
20% down · 8.5% · 30yr
- Down + closing
- —
- Monthly P&I
- —
- Monthly cashflow
- —
- DSCR
- —
- Eligible?
- —
No personal income docs; deal must DSCR.
Hard money
10% down · 12.0% · 12mo
- Down + closing
- —
- Monthly P&I
- —
- Monthly cashflow
- —
- DSCR
- —
- Eligible?
- —
Short-term bridge; refi at stabilization.
Listing history 26 events
-
2026-06-18days on market $424,900 Active 1442 DOM
-
2026-06-17days on market $424,900 Active 1441 DOM
-
2026-06-16days on market $424,900 Active 1440 DOM
-
2026-06-15days on market $424,900 Active 1439 DOM
-
2026-06-13days on market $424,900 Active 1437 DOM
-
2026-06-13days on market $424,900 Active 1436 DOM
-
2026-06-09days on market $424,900 Active 1433 DOM
-
2026-06-08days on market $424,900 Active 1432 DOM
-
2026-06-07days on market $424,900 Active 1431 DOM
-
2026-06-04days on market $424,900 Active 1428 DOM
-
2026-06-03days on market $424,900 Active 1427 DOM
-
2026-06-02days on market $424,900 Active 1426 DOM
-
2026-06-01days on market $424,900 Active 1425 DOM
-
2026-05-31days on market $424,900 Active 1424 DOM
-
2025-11-11price $424,900
-
2024-04-23price $429,900
-
2024-04-12price $439,000
-
2022-07-07$449,000 Active
-
2022-06-27historical
-
2022-05-10$449,000 Active
-
2021-12-31historical
-
2021-09-06status Active
-
2021-09-01historical
-
2021-08-27price $449,000
-
2021-04-30price $458,000
-
2021-04-13$459,000 Active
ⓘ Source: listings_history table (triggers on properties + properties_extension) + one-shot
backfill from property_details.listing_events for pre-trigger history.
Nearby sold comps map
Loading sold comps map…
Walkable amenities ~0.75 mi
Loading nearby amenities…
Taxation est. · year 1
- Rental income
- $86,148
- − Mortgage interest
- −$23,801
- − Property taxes
- −$6,374
- − Insurance
- −$2,124
- − Repairs & maintenance
- −$6,892
- − Management
- −$6,892
- − Depreciation
- −$12,361
- Taxable income
- $27,705
- Est. tax owed @ 24.0%
- −$6,649
- After-tax cash flow
- $26,171/yr
For passive investors: Depreciation is non-cash, so a rental often shows a tax loss while cash-flowing — sheltering income. Rental losses are passive: they offset passive income freely, and up to $25,000/yr can offset ordinary (W-2) income if you actively participate and your MAGI is under $100k (phasing out to $0 by $150k); unused losses carry forward. On sale, claimed depreciation is recaptured at up to 25%, and gains may owe capital-gains tax (a 1031 exchange can defer both). Figures are a year-1 estimate at your 24.0% rate — not tax advice; consult a CPA.
Condition & rehab AI · 13 photos
This multi-family property requires moderate renovations to its kitchen and bathrooms, as well as exterior painting and landscaping. These updates would significantly increase its value for both resale and rental.
Repairs flagged
- Major Kitchen cabinets — The cabinets appear to be outdated and in poor condition.
- Major Kitchen countertops — The countertops appear to be outdated and in poor condition.
- Major Bathroom fixtures — The fixtures appear to be outdated and in poor condition.
- Major Bathroom tile — The tile appears to be outdated and in poor condition.
- Moderate Exterior siding — The siding appears to be in fair condition, but some discoloration and wear is visible.
- Moderate Exterior paint — The exterior paint appears to be in fair condition, but some discoloration and wear is visible.
- Moderate Windows — The windows appear to be in average condition, but some discoloration and wear is visible.
- Moderate Landscaping — The landscaping appears to be in fair condition, with some overgrown areas and lack of maintenance.
Value-add opportunities
- Both Kitchen renovation — A new kitchen with updated cabinetry and countertops would significantly increase the home's value for both resale and rental.
- Both Bathroom renovation — A new bathroom with updated fixtures and tile would significantly increase the home's value for both resale and rental.
- Both Exterior painting — Painting the exterior would improve the home's curb appeal and increase its value for both resale and rental.
- Both Landscaping — Landscaping the yard would improve the home's curb appeal and increase its value for both resale and rental.
Renovation cost estimate screening
| Repair item | Severity | Est. cost |
|---|---|---|
| Kitchen cabinets · The cabinets appear to be outdated and in poor condition. | Major | $15,000–50,000 |
| Kitchen countertops · The countertops appear to be outdated and in poor condition. | Major | $15,000–50,000 |
| Bathroom fixtures · The fixtures appear to be outdated and in poor condition. | Major | $15,000–50,000 |
| Bathroom tile · The tile appears to be outdated and in poor condition. | Major | $15,000–50,000 |
| Exterior siding · The siding appears to be in fair condition, but some discoloration and wear is visible. | Moderate | $3,000–15,000 |
| Exterior paint · The exterior paint appears to be in fair condition, but some discoloration and wear is visible. | Moderate | $3,000–15,000 |
| Windows · The windows appear to be in average condition, but some discoloration and wear is visible. | Moderate | $3,000–15,000 |
| Landscaping · The landscaping appears to be in fair condition, with some overgrown areas and lack of maintenance. | Moderate | $3,000–15,000 |
| Total estimated repair cost · 8 items | $72,000–260,000 |
Value-add ROI direction
- Both Kitchen renovation — A new kitchen with updated cabinetry and countertops would significantly increase the home's value for both resale and rental. ↑
- Both Bathroom renovation — A new bathroom with updated fixtures and tile would significantly increase the home's value for both resale and rental. ↑
- Both Exterior painting — Painting the exterior would improve the home's curb appeal and increase its value for both resale and rental. ↑
- Both Landscaping — Landscaping the yard would improve the home's curb appeal and increase its value for both resale and rental. ↑
ⓘ Cost ranges are severity-bucket heuristics (US national rule-of-thumb). Get contractor quotes + a written scope before underwriting a rehab budget.
Schools (NCES district)
- District
- Downingtown Area SD
- NCES district ID
- 4207710
- Math proficiency
- 67% ▼ -1.00%
- Reading proficiency
- 83% ▼ -1.00%
- Median HH income
- $104,515
- Composite
- 68.66/100
- National rank
- #338
- State rank
- #9 of 539 in PA
Livability — Downingtown
- Score
- 91/100
- State rank
- #13
- US rank
- #56
Category grades
Schools grade is shown separately in the Schools card above.
Census & demographics
- Census place
- Downingtown, PA
- County
- Chester County · 432,350 people
- City population
- 53,629
- Metro
- Philadelphia-Camden-Wilmington, PA-NJ-DE-MD
- Population (ZIP)
- 53,629
- Household income
- $143,249
- Rent vs Own
- Severe rent burden
- 689.0
Population outlook (Chester County) Hauer SSP2
- Today (2025)
- 546,756 people
- By 2030
- 559,441 · +2.3%
- By 2040
- 576,377 · +5.4%
- By 2050
- 580,602 · +6.2%
- By 2075
- 581,575 · +6.4%
- By 2100
- 540,922 · -1.1%
Race, ethnicity, and origin ACS 2023
- Neighborhood character
- Predominantly White (80%)
- Race & ethnicity
- White 80% Asian 8% Black 5% Two or more races 5% Hispanic / Latino 3%
- Common ancestry
- Romanian 5% Italian 2% Slovak 2%
- Foreign-born
- 9% · Canada, China, Vietnam
- Languages at home
- 90% English-only · Other Indo-European 4% Other Asian/Pacific 3% Spanish 1%
Political lean MEDSL · Chester
- 2024 margin
- D (+14.5) · D 56.7% · R 42.2% · Other 1.0%
- 2008→2024 swing
- +5.2pp toward D · 2008: 9.2pp · 2024: 14.5pp
- All cycles
- 2024: D+14.5 2020: D+17.0 2016: D+9.2 2012: R+0.4 2008: D+9.2
Not yet ingested
- Civics
- —
Market trends
- HPI YoY
- ▼ -248.84%
- Current HPI
- 288.2999
- Rent YoY
- ▲ 2.03%
- Metro
- Philadelphia-Camden-Wilmington, PA-NJ-DE-MD
- State GDP YoY
- ▲ 1.68%
- F500 in state
- 34
Industry mix (Fortune 500 HQ in PA)
| Industry | F500 HQs | Revenue |
|---|---|---|
| Healthcare | 2 | $309B |
|
||
| Insurance | 2 | $27B |
|
||
| Telecommunications / Media | 1 | $124B |
|
||
| Industrial Distribution | 1 | $22B |
|
||
| Financial Services | 1 | $20B |
|
||
| Chemicals / Materials | 1 | $18B |
|
||
Price history
-7.4% since first listed12 events — show timeline
- 2025-11-11 Price Changed $424,900 BRIGHT MLS
- 2024-04-23 Price Changed $429,900 BRIGHT MLS
- 2024-04-12 Price Changed $439,000 BRIGHT MLS
- 2022-07-07 Listed $449,000 BRIGHT MLS
- 2022-06-27 Listing Removed — BRIGHT MLS
- 2022-05-10 Listed $449,000 BRIGHT MLS
- 2021-12-31 Listing Removed — BRIGHT MLS
- 2021-09-06 Relisted — BRIGHT MLS
- 2021-09-01 Listing Removed — BRIGHT MLS
- 2021-08-27 Price Changed $449,000 BRIGHT MLS
- 2021-04-30 Price Changed $458,000 BRIGHT MLS
- 2021-04-13 Listed $459,000 BRIGHT MLS
Cash-flow waterfall
monthlySold comps — $/sqft
last 12 mo · ≤1 miLoading sold comps…