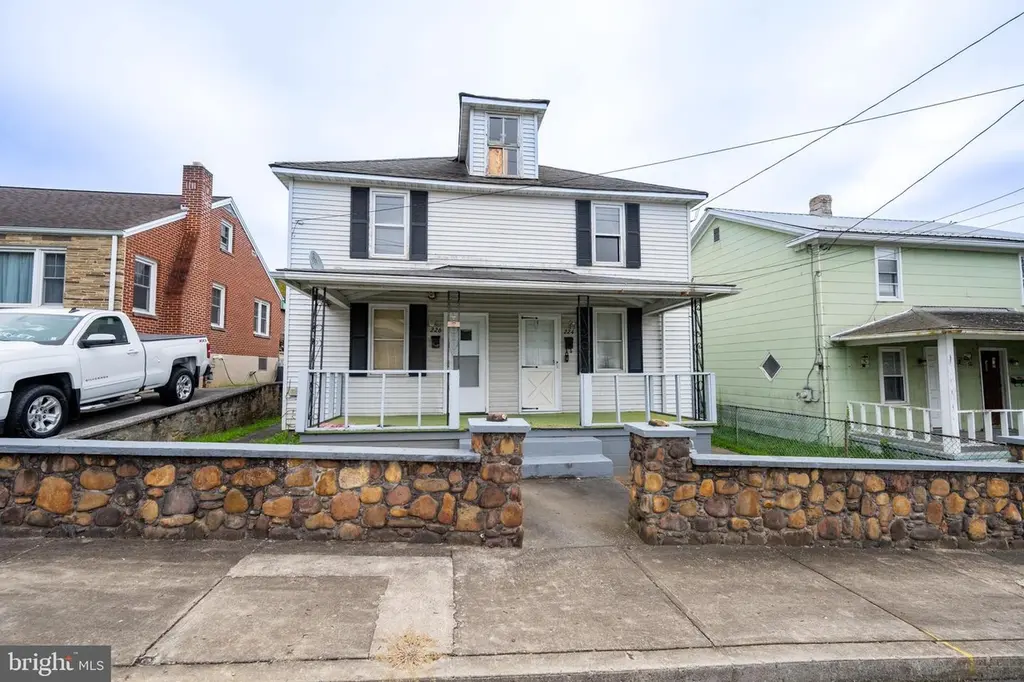
224 / 226 Green St · Westernport, MD
Flood risk 4/10 · Minor
- FEMA flood zone
- X (unshaded)
- Chance of flooding over 30 yrs
- 0.2%
- Est. flood insurance / yr
- $473 – $860
Fire risk 3/10 · Minor
- Est. fire insurance / yr
- $755 – $1,403
Heat risk 4/10 · Minor
- Hot days now (above 94°F)
- 8 days/yr
- Hot days in 30 yrs
- 21 days/yr
Wind risk 2/10 · Minimal
- Chance of severe wind over 30 yrs
- —
Air-quality risk 2/10 · Minimal
- Unhealthy air days now
- 0 days/yr
- Unhealthy air days in 30 yrs
- 1 days/yr
Risk factors via First Street. Map © Google.
Why this score? — see what drove the B grade
The composite is a weighted blend of 9 inputs, each scored 0–100. Each bar is that input's sub-score; the figure is the points it added to the 100-point composite (weight × sub-score).
- Cash flow +27.2/30.0
- ARV discount +15.0/15.0
- DSCR +9.5/10.0
- 1% rule +6.9/10.0
- Appreciation +5.6/10.0
- Livability +3.5/5.0
- Rent growth +2.5/5.0
- Condition / age +2.5/5.0
- Schools +1.9/10.0
$100,000
🖨 Deal sheet 📄 Offer letter ✓ Due diligence
Listing remarks MLS
Duplex opportunity! Purchase 2 homes for the price of one! 224 Green St offers 3 bedroom 1 bath. 226 Green St 1 bedroom 1 bath. brand nw furnace. Enjoy outdoor living with a covered front porch and back. Level grassy backyard features a built in stone fireplace. New a/c installed in both units in 2022
Key facts
- 5,000 sq ft lot
- Built 1913
- Listed 235 days
Neighborhood map
What this means for you Summary
Snapshot
- This is a 4-bed/2.0-bath townhouse listed at $100k.
Deal economics
- At list price, monthly cash flow is $287 ($3k/yr) — positive.
- The deal already cash-flows at list — no discount required.
- Meets the 1% rule at list price ($1k rent vs $100k).
- Recommended offer: $88k (12.0% below list) — sets the bar for market timing.
Location & tenants
- Location reads 69/100 on livability (#188 in MD) — a middle-class / working-renter tenant base. Strengths: cost of living A+, housing A+, crime B; Watch: schools D, amenities F, commute F.
- Allegany County Public Schools (other): math 15% / reading 30% proficiency, ranked #18 of 24 in MD (top 75%) — low school quality limits family demand, transient renter base, plan for 1-2y turnover.
- Market conditions: 23 active listings in the ZIP; 24 units permitted in Allegany County in 2024 (0 in 5+ unit buildings).
Forward outlook
- In year one you build about $2k of equity ($691 loan paydown + $1k appreciation (1.3% local appreciation)).
- Allegany County population projected at -14% by 2050 — secular population decline; favor cash flow + early exit over multi-decade hold.
- At projected returns (1.3% appreciation + 3.0% rent growth), your $28k cash investment doubles in ~5 years — after that, you're playing with house money.
Negotiation context
- It's been on market 236 days — a 12% lower offer ($88k) is reasonable based on typical stale-listing flexibility.
- 12 sale attempts since 22y ago with the ask held roughly flat each time — persistent listings suggest the price (not the market) is what's stuck; bring a comps-based counter.
- Current owner paid $33k; list at $100k implies a 203% gain — meaningful room to come down on a strong offer.
Risks & watch-outs
- Watch-outs: built in 1913 — expect roof / HVAC / electrical / plumbing capex.
Questions for the listing agent
- It's been on market 236 days. Have you received any prior offers? Is the seller open to a 12% concession, seller financing, or rate buy-down credit?
- Built in 1913 — when were the roof, HVAC, electrical panel, plumbing, and water heater last replaced?
- Why hasn't it sold? Are there any deal-killer items the seller is aware of (foundation, flood, title, zoning, code violations)?
- Is there a deadline driving the sale (1031 exchange, divorce, estate, relocation)? That informs how much negotiation room exists.
- Schools are D-rated, which usually means shorter tenancies and higher turnover. Who's the typical renter profile here, and what's been the actual vacancy rate?
- What's the average days-on-market for RENTAL listings here right now (not sales)? A rising rental-DOM trend means longer vacancies and softer asking-rent achievability than the comps imply.
- What's the recent tenant-quality profile in this submarket — average credit score on applications, eviction rate, late-payment / NSF rate, and stable-employment percentage? A property-management company in the area should have these aggregated.
- How much new for-sale + rental construction is in the pipeline within 1–3 miles? Heavy new supply typically softens prices + rents 12–24 months out; constrained supply supports both.
Investment metrics
- 1% rule
- 1.19% ✓
- Cap rate
- 9.74%
- Cash-on-cash
- 12.32%
- DSCR
- 1.55
- GRM
- 7.0
CMA / ARV
- ARV (median comp)
- $167,599
- List price
- $100,000
- Delta
- -40.33%
- Verdict
- UNDERPRICED
- Comps
- 20 within 1.0 mi
Show comp detail 8 sales within ~0.75 mi
| Address | Dist | Beds/Ba | Sqft | Sold | Price | $/sf | Match |
|---|---|---|---|---|---|---|---|
| 402 Maryland Ave | 0.62mi | 5/1.5 (+1) | 1,902 (-4%) | 10mo | $60,800 | $32 | 50 |
| 419 Maryland Ave | 0.60mi | 5/1.0 (+1) | 1,902 (-4%) | 8mo | $52,000 | $27 | 50 |
| 414 Maryland Ave | 0.62mi | 5/1.0 (+1) | 1,902 (-4%) | 13mo | $59,900 | $31 | 45 |
| 309 Maryland Ave | 0.59mi | 4/1.5 | 1,708 (-14%) | 9mo | $66,000 | $39 | 40 |
| 406 Maryland Ave | 0.62mi | 5/1.0 (+1) | 1,902 (-4%) | 19mo | $60,000 | $32 | 40 |
| 316 Maryland Ave | 0.62mi | 4/1.5 | 1,708 (-14%) | 10mo | $52,900 | $31 | 39 |
| 301 Maryland Ave | 0.59mi | 4/1.5 | 1,696 (-14%) | 13mo | $35,000 | $21 | 36 |
| 303 Maryland Ave | 0.59mi | 3/1.5 (-1) | 1,708 (-14%) | 9mo | $26,000 | $15 | 36 |
Match score weights: distance 35% · size 25% · config 20% · recency 20%. Top-matched comps best support the ARV.
Projected returns pro-forma
1.28% appreciation · 3.0% rent growth · sell at horizon
- IRR
- 14.9%
- Equity multiple
- 1.77×
- Total profit
- $21,569
- Equity at exit
- $35,629
- IRR
- 18.1%
- Equity multiple
- 3.24×
- Total profit
- $62,850
- Equity at exit
- $48,523
Cash invested: $28,000 (down + closing). Projections, not guarantees.
Landlord ↔ Tenant lean methodology
- Overall (STATE)
- 27 Tenant-Leaning
- State Maryland
- 27 Tenant-Leaning · D+14
- County
- — inherits STATE
- City
- — inherits STATE
ZIP-level market 21562
- Home prices YoY
- 0.6%
- Active inventory
- 23
- Price-to-rent
- 7.0×
Monthly cashflow live
- Estimated rent
- $1,188 medium interval (Pro) →
- Mortgage (P&I)
- −$524
- Tax from tax record
- −$85 /mo · $1,018/yr
- Insurance
- −$42
- HOA
- −$0
- Vacancy / Maint / Mgmt
- −$249
- Net cashflow
- $287
Break-even live
UW: 25.0% down · 7.5% · 30yr · 1.5% tax · 5.0% vac · 8.0% maint · 8.0% mgmt
Financing live
Cash to close
- Down payment
- $25,000
- Closing costs
- $3,000
- Reserves months
- —
- Total cash needed
- —
Loan-product check · same deal, 3 products live
Conventional
25% down · 7.5% · 30yr
- Down + closing
- —
- Monthly P&I
- —
- Monthly cashflow
- —
- DSCR
- —
- Eligible?
- —
Personal DTI + credit; lowest rate.
DSCR
20% down · 8.5% · 30yr
- Down + closing
- —
- Monthly P&I
- —
- Monthly cashflow
- —
- DSCR
- —
- Eligible?
- —
No personal income docs; deal must DSCR.
Hard money
10% down · 12.0% · 12mo
- Down + closing
- —
- Monthly P&I
- —
- Monthly cashflow
- —
- DSCR
- —
- Eligible?
- —
Short-term bridge; refi at stabilization.
Listing history 43 events
-
2026-06-19days on market $100,000 Active 236 DOM
-
2026-06-18days on market $100,000 Active 235 DOM
-
2026-06-17days on market $100,000 Active 234 DOM
-
2026-06-16days on market $100,000 Active 233 DOM
-
2026-06-15days on market $100,000 Active 232 DOM
-
2026-06-14days on market $100,000 Active 230 DOM
-
2026-06-12days on market $100,000 Active 229 DOM
-
2026-06-09days on market $100,000 Active 226 DOM
-
2026-06-08days on market $100,000 Active 225 DOM
-
2026-06-07days on market $100,000 Active 224 DOM
-
2026-06-02days on market $100,000 Active 219 DOM
-
2026-06-01days on market $100,000 Active 218 DOM
-
2026-05-31days on market $100,000 Active 217 DOM
-
2026-05-30days on market $100,000 Active 216 DOM
-
2026-05-18price $100,000 304-char remark
Show marketing remark (304 chars)
Duplex opportunity! Purchase 2 homes for the price of one! 224 Green St offers 3 bedroom 1 bath. 226 Green St 1 bedroom 1 bath. brand nw furnace. Enjoy outdoor living with a covered front porch and back. Level grassy backyard features a built in stone fireplace. New a/c installed in both units in 2022
-
2026-03-12status Active 304-char remark
Show marketing remark (304 chars)
Duplex opportunity! Purchase 2 homes for the price of one! 224 Green St offers 3 bedroom 1 bath. 226 Green St 1 bedroom 1 bath. brand nw furnace. Enjoy outdoor living with a covered front porch and back. Level grassy backyard features a built in stone fireplace. New a/c installed in both units in 2022
-
2026-03-01historical Active Under Contract 304-char remark
Show marketing remark (304 chars)
Duplex opportunity! Purchase 2 homes for the price of one! 224 Green St offers 3 bedroom 1 bath. 226 Green St 1 bedroom 1 bath. brand nw furnace. Enjoy outdoor living with a covered front porch and back. Level grassy backyard features a built in stone fireplace. New a/c installed in both units in 2022
-
2025-10-28$105,000 Active 304-char remark
Show marketing remark (304 chars)
Duplex opportunity! Purchase 2 homes for the price of one! 224 Green St offers 3 bedroom 1 bath. 226 Green St 1 bedroom 1 bath. brand nw furnace. Enjoy outdoor living with a covered front porch and back. Level grassy backyard features a built in stone fireplace. New a/c installed in both units in 2022
-
2025-10-15$105,000 Active 304-char remark
Show marketing remark (304 chars)
Duplex opportunity! Purchase 2 homes for the price of one! 224 Green St offers 3 bedroom 1 bath. 226 Green St 1 bedroom 1 bath. brand nw furnace. Enjoy outdoor living with a covered front porch and back. Level grassy backyard features a built in stone fireplace. New a/c installed in both units in 2022
-
2025-10-14historical $105,000 304-char remark
Show marketing remark (304 chars)
Duplex opportunity! Purchase 2 homes for the price of one! 224 Green St offers 3 bedroom 1 bath. 226 Green St 1 bedroom 1 bath. brand nw furnace. Enjoy outdoor living with a covered front porch and back. Level grassy backyard features a built in stone fireplace. New a/c installed in both units in 2022
-
2019-01-05historical
-
2019-01-05status Active
-
2019-01-01historical
-
2015-03-12$49,000 Active
-
2015-01-12historical
-
2015-01-12historical
-
2014-10-10price
-
2014-06-10price
-
2014-01-13Active
-
2014-01-13$49,900
-
2013-11-03historical Expired
-
2013-11-03historical
-
2013-02-02status Active
-
2013-01-17historical Temporarily Off-Market
-
2013-01-17Active
-
2013-01-16$61,000
-
2005-11-04soldstatus $33,000
-
2004-10-04historical
-
2004-02-29$35,380
-
1996-08-29soldstatus $35,000
ⓘ Source: listings_history table (triggers on properties + properties_extension) + one-shot
backfill from property_details.listing_events for pre-trigger history.
Tax reassessment forecast MD · Partial reset (capped growth)
- Current annual tax
- $1,018 · $85/mo
- Projected year-2 tax
- $1,054 · $88/mo
- Expected delta
- +$36/yr (+$3/mo · 3.5%)
ⓘ Screening estimate from a state-policy table — verify with the county assessor before closing.
Climate risk First Street
- Flood 4/10 Moderate FEMA zone X (unshaded) · 20% chance over 30 yrs
- Wildfire 3/10 Moderate
- Heat 4/10 Moderate 8 d/yr ≥94°F today · 21 d/yr by 30 yrs out
- Wind 2/10 Low
- Air quality 2/10 Low 0 unhealthy d/yr today · 1 by 30 yrs out
Nearby sold comps map
Loading sold comps map…
Walkable amenities ~0.75 mi
Loading nearby amenities…
Taxation est. · year 1
- Rental income
- $14,253
- − Mortgage interest
- −$5,602
- − Property taxes
- −$1,018
- − Insurance
- −$500
- − Repairs & maintenance
- −$1,140
- − Management
- −$1,140
- − Depreciation
- −$2,909
- Taxable income
- $1,944
- Est. tax owed @ 24.0%
- −$467
- After-tax cash flow
- $2,982/yr
For passive investors: Depreciation is non-cash, so a rental often shows a tax loss while cash-flowing — sheltering income. Rental losses are passive: they offset passive income freely, and up to $25,000/yr can offset ordinary (W-2) income if you actively participate and your MAGI is under $100k (phasing out to $0 by $150k); unused losses carry forward. On sale, claimed depreciation is recaptured at up to 25%, and gains may owe capital-gains tax (a 1031 exchange can defer both). Figures are a year-1 estimate at your 24.0% rate — not tax advice; consult a CPA.
Schools (NCES district)
- District
- Allegany County Public Schools
- NCES district ID
- 2400030
- Math proficiency
- 15% ▼ -26.00%
- Reading proficiency
- 30% ▼ -20.00%
- Median HH income
- $39,760
- Composite
- 18.95/100
- National rank
- #8854
- State rank
- #18 of 24 in MD
Livability — Westernport
- Score
- 69/100
- State rank
- #188
- US rank
- #8479
Category grades
Schools grade is shown separately in the Schools card above.
Census & demographics
- Census place
- Westernport, MD
- Population (ZIP)
- 3,192
Population outlook (Allegany County) Hauer SSP2
- Today (2025)
- 68,778 people
- By 2030
- 66,766 · -2.9%
- By 2040
- 62,784 · -8.7%
- By 2050
- 59,179 · -14.0%
- By 2075
- 50,732 · -26.2%
- By 2100
- 40,837 · -40.6%
Race, ethnicity, and origin ACS 2023
- Neighborhood character
- Predominantly White (98%)
- Race & ethnicity
- White 98% Hispanic / Latino 1%
- Common ancestry
- Slovak 2% Iranian 2% Italian 1%
- Foreign-born
- 0%
Political lean MEDSL · Allegany
- 2024 margin
- Solid R (+40.3) · D 28.9% · R 69.2% · Other 2.0%
- 2008→2024 swing
- -14.4pp toward R · 2008: -25.9pp · 2024: -40.3pp
- All cycles
- 2024: R+40.3 2020: R+38.3 2016: R+48.0 2012: R+32.9 2008: R+25.9
Not yet ingested
- Civics
- —
Market trends
- HPI YoY
- ▲ 1.28%
- Current HPI
- 216.4044
- Rent YoY
- —
- Metro
- —
- State GDP YoY
- ▲ 2.97%
- F500 in state
- 12
Industry mix (Fortune 500 HQ in MD)
| Industry | F500 HQs | Revenue |
|---|---|---|
| Aerospace / Defense | 1 | $71B |
|
||
| Utilities | 1 | $25B |
|
||
| Hotels | 1 | $24B |
|
||
| Consumer Goods | 1 | $7B |
|
||
| Real Estate | 1 | $6B |
|
||
| Chemicals | 1 | $2B |
|
||
Price history
+185.7% since first listed29 events — show timeline
- 2026-05-18 Price Changed $100,000 BRIGHT MLS
- 2026-05-18 Price Changed $100,000 BRIGHT MLS
- 2026-03-12 Relisted — BRIGHT MLS
- 2026-03-12 Relisted — BRIGHT MLS
- 2026-03-01 Contingent — BRIGHT MLS
- 2026-03-01 Contingent — BRIGHT MLS
- 2025-10-28 Listed $105,000 BRIGHT MLS
- 2025-10-15 Listed $105,000 BRIGHT MLS
- 2025-10-14 Coming Soon $105,000 BRIGHT MLS
- 2019-01-05 Listing Removed — BRIGHT MLS
- 2019-01-05 Relisted — BRIGHT MLS
- 2019-01-01 Listing Removed — BRIGHT MLS
- 2015-03-12 Listed $49,000 BRIGHT MLS
- 2015-01-12 Delisted — MRIS
- 2015-01-12 Listing Removed — BRIGHT MLS
- 2014-10-10 Price Changed — MRIS
- 2014-06-10 Price Changed — MRIS
- 2014-01-13 Listed — MRIS
- 2014-01-13 Listed $49,900 BRIGHT MLS
- 2013-11-03 Delisted — MRIS
- 2013-11-03 Listing Removed — BRIGHT MLS
- 2013-02-02 Relisted — MRIS
- 2013-01-17 Delisted — MRIS
- 2013-01-17 Listed — MRIS
- 2013-01-16 Listed $61,000 BRIGHT MLS
- 2005-11-04 Sold (MLS) $33,000 MRIS
- 2004-10-04 Delisted — MRIS
- 2004-02-29 Listed $35,380 MRIS
- 1996-08-29 Sold (Public Records) $35,000 Public Records
Property tax history
+1.5%/yrLatest (2025): $1,018 · +7.5% YoY. Source: county tax records.
Cash-flow waterfall
monthlySold comps — $/sqft
last 12 mo · ≤1 miLoading sold comps…