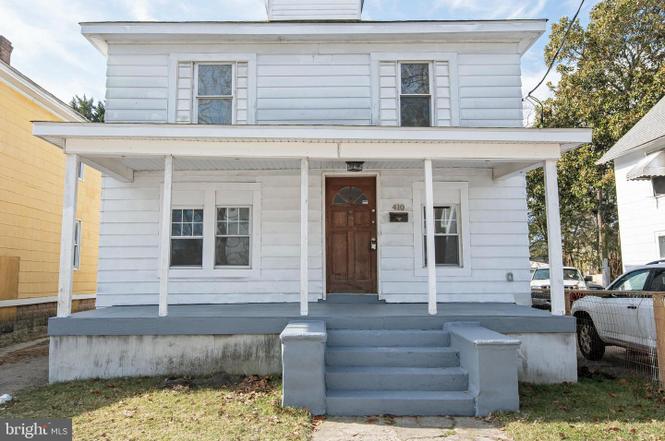
410 Elizabeth St · Salisbury, MD
Flood risk 1/10 · Minimal
- FEMA flood zone
- X (unshaded)
- Chance of flooding over 30 yrs
- 0.0%
- Est. flood insurance / yr
- $473 – $860
Fire risk 1/10 · Minimal
- Est. fire insurance / yr
- $755 – $1,403
Heat risk 9/10 · Severe
- Hot days now (above 105°F)
- 7 days/yr
- Hot days in 30 yrs
- 16 days/yr
Wind risk 7/10 · Major
- Chance of severe wind over 30 yrs
- 78.0%
Air-quality risk 2/10 · Minimal
- Unhealthy air days now
- 1 days/yr
- Unhealthy air days in 30 yrs
- 2 days/yr
Risk factors via First Street. Map © Google.
Why this score? — see what drove the C+ grade
The composite is a weighted blend of 9 inputs, each scored 0–100. Each bar is that input's sub-score; the figure is the points it added to the 100-point composite (weight × sub-score).
- Cash flow +24.8/30.0
- ARV discount +15.0/15.0
- DSCR +8.0/10.0
- 1% rule +5.3/10.0
- Rent growth +3.4/5.0
- Livability +3.0/5.0
- Condition / age +2.5/5.0
- Schools +1.9/10.0
- Appreciation +0.0/10.0
$179,000
🖨 Deal sheet 📄 Offer letter ✓ Due diligence
Listing remarks MLS
This recently update home offers 3 bedrooms and 2 full baths. Additional room on first level can be used as an office or 4th bedroom. Traditional floor plan with larger kitchen, dining room, family room and living room or bonus room. New wiring, newer roof and windows.
Key facts
- Freshly painted
- Brand new carpet
- Move in ready
Tags
Property features AI
Finance
- Financial info: Lease not considered
Exterior
- Parking: Driveway with space for 3 vehicles; Total of 3 garage/parking spaces
- Utilities: Public water; Public sewer
- Home design: Detached property; Effective year of major remodel 2020; Ownership: Fee simple
- Construction: Block foundation; Asphalt roof; Building not winterized
- Exterior features: Property located in city limits; Not in a federal flood zone; Above-grade and below-grade structures noted
Interior
- Kitchen: Stove; Refrigerator
- Bedrooms: Three bedrooms on the upper level; One bedroom on the main level
- Flooring: Carpet; Luxury vinyl plank
- Bathrooms: Two full bathrooms (one on main level, one on upper level)
- Heating & cooling: Forced air heating (electric); Ceiling fans
- Interior features: Dining room; Family room; Unfinished basement
- Laundry & utility: Washer; Dryer; Natural gas hot water
Neighborhood map
What this means for you Summary
Snapshot
- This is a 4-bed/1.0-bath single-family listed at $179k.
Deal economics
- At list price, monthly cash flow is $380 ($5k/yr) — positive.
- The deal already cash-flows at list — no discount required.
- Meets the 1% rule at list price ($2k rent vs $179k).
- Recommended offer: $174k (3.0% below list) — sets the bar for market timing.
- Cap rate 8.8% vs local median 4.8% in Salisbury — top-decile yield for the area; either an underpriced asset or a hidden risk that comps aren't pricing in. Stress-test before assuming the spread holds.
Location & tenants
- Location reads 60/100 on livability (#351 in MD) — a middle-class / working-renter tenant base. Strengths: health & safety A+, cost of living A, housing A; Watch: schools D-, crime F, amenities F.
- Wicomico County Public Schools (urban): math 16% / reading 26% proficiency, ranked #19 of 24 in MD (top 79%) — low school quality limits family demand, transient renter base, plan for 1-2y turnover.
- Market conditions: Rents rising (+3.8%/yr); 195 active listings in the ZIP; 7 comparable units currently listed for rent nearby; rentals at typical pace (median 21d on market — plan ~3-4 weeks tenant-placement turnaround); 43% of comp listings sitting > 30 days — soft ceiling on asking rent; 278 units permitted in Wicomico County in 2024 (44 in 5+ unit buildings).
- This rent runs 30% of the median local income ($73k/yr) — at the standard rent-burdened threshold; future hikes will face affordability resistance.
Forward outlook
- Local home prices are declining (-3.0%/yr); year-one equity from $1k of loan paydown is wiped out by about $5k of value loss. Plan a longer hold.
- Wicomico County population projected at +14% by 2050 — modest demand growth; plan on rents tracking national, not racing it.
Negotiation context
- It's been on market 54 days — a 3% lower offer ($174k) is reasonable based on typical stale-listing flexibility.
- 3 sale attempts since 5y ago; this cycle's ask has dropped $11k (6%) from the opening price — seller is motivated, your offer sets the floor, not the list.
- Current owner paid $118k; list at $179k implies a 51% gain — meaningful room to come down on a strong offer.
Risks & watch-outs
- Watch-outs: built in 1925 — expect roof / HVAC / electrical / plumbing capex.
- Climate carrying-cost: major wind risk, 78% chance of damaging wind over 30y; extreme-heat days projected 7→16/yr by 2055 (HVAC capex compounding) — expect insurance premiums to compound above CPI over the hold.
Questions for the listing agent
- It's been on market 54 days. Have you received any prior offers? Is the seller open to a 3% concession, seller financing, or rate buy-down credit?
- Built in 1925 — when were the roof, HVAC, electrical panel, plumbing, and water heater last replaced?
- Is there a deadline driving the sale (1031 exchange, divorce, estate, relocation)? That informs how much negotiation room exists.
- Schools are D-rated, which usually means shorter tenancies and higher turnover. Who's the typical renter profile here, and what's been the actual vacancy rate?
- Crime grade is F in this area — have there been break-ins, vandalism, or insurance claims at this property in the last 3 years? What carrier currently insures it and at what premium?
- What's the average days-on-market for RENTAL listings here right now (not sales)? A rising rental-DOM trend means longer vacancies and softer asking-rent achievability than the comps imply.
- What's the recent tenant-quality profile in this submarket — average credit score on applications, eviction rate, late-payment / NSF rate, and stable-employment percentage? A property-management company in the area should have these aggregated.
- How much new for-sale + rental construction is in the pipeline within 1–3 miles? Heavy new supply typically softens prices + rents 12–24 months out; constrained supply supports both.
Investment metrics
- 1% rule
- 1.03% ✓
- Cap rate
- 8.84%
- Cash-on-cash
- 9.10%
- DSCR
- 1.40
- GRM
- 8.1
CMA / ARV
- ARV (on-the-fly)
- $264,384
- Comps found
- 12
Show comp detail 12 sales within ~0.75 mi
| Address | Dist | Beds/Ba | Sqft | Sold | Price | $/sf | Match |
|---|---|---|---|---|---|---|---|
| 505 Poplar Hill Ave | 0.20mi | 4/1.0 | 1,748 (+1%) | 1mo | $90,000 | $51 | 88 |
| 618/620 Baker St | 0.12mi | 4/2.0 | 1,632 (-6%) | 3mo | $95,000 | $58 | 78 |
| 711 E Church St | 0.16mi | 4/2.0 | 1,568 (-9%) | 3mo | $125,000 | $80 | 70 |
| 304 Brooklyn Ave | 0.57mi | 4/2.0 | 1,728 (0%) | 6mo | $295,000 | $171 | 64 |
| 416 Truitt St | 0.53mi | 4/2.0 | 1,650 (-4%) | 7mo | $252,900 | $153 | 58 |
| 309 Park Heights Ave | 0.61mi | 3/2.5 (-1) | 1,778 (+3%) | 2mo | $280,000 | $157 | 54 |
| 201 Marshall St | 0.35mi | 3/1.0 (-1) | 1,472 (-15%) | 0mo | $181,500 | $123 | 54 |
| 106 W Philadelphia Ave | 0.35mi | 3/1.5 (-1) | 1,500 (-13%) | 7mo | $230,000 | $153 | 49 |
| 1212 Emerson Ave | 0.68mi | 3/2.0 (-1) | 1,832 (+6%) | 1mo | $307,500 | $168 | 48 |
| 613 Lakeside Dr | 0.48mi | 3/2.5 (-1) | 1,863 (+8%) | 9mo | $296,000 | $159 | 46 |
| 909 Johnson St | 0.72mi | 3/2.0 (-1) | 1,608 (-7%) | 3mo | $246,000 | $153 | 43 |
| 311 W Philadelphia Ave | 0.54mi | 3/2.0 (-1) | 1,922 (+11%) | 8mo | $350,000 | $182 | 41 |
Match score weights: distance 35% · size 25% · config 20% · recency 20%. Top-matched comps best support the ARV.
Projected returns pro-forma
-3.0% appreciation · 3.78% rent growth · sell at horizon
- IRR
- -1.8%
- Equity multiple
- 0.93×
- Total profit
- $-3,407
- Equity at exit
- $26,689
- IRR
- 8.6%
- Equity multiple
- 1.68×
- Total profit
- $34,030
- Equity at exit
- $15,477
Cash invested: $50,120 (down + closing). Projections, not guarantees.
Landlord ↔ Tenant lean methodology
- Overall (STATE)
- 27 Tenant-Leaning
- State Maryland
- 27 Tenant-Leaning · D+14
- County
- — inherits STATE
- City
- — inherits STATE
ZIP-level market 21804
- Home prices YoY
- -26.7%
- Rents YoY
- 3.8%
- Active inventory
- 195
- Price-to-rent
- 8.1×
Monthly cashflow live
- Estimated rent
- $1,852 high interval (Pro) →
- Mortgage (P&I)
- −$939
- Tax from tax record
- −$69 /mo · $834/yr
- Insurance
- −$75
- HOA
- −$0
- Vacancy / Maint / Mgmt
- −$389
- Net cashflow
- $380
Break-even live
UW: 25.0% down · 7.5% · 30yr · 1.5% tax · 5.0% vac · 8.0% maint · 8.0% mgmt
Financing live
Cash to close
- Down payment
- $44,750
- Closing costs
- $5,370
- Reserves months
- —
- Total cash needed
- —
Loan-product check · same deal, 3 products live
Conventional
25% down · 7.5% · 30yr
- Down + closing
- —
- Monthly P&I
- —
- Monthly cashflow
- —
- DSCR
- —
- Eligible?
- —
Personal DTI + credit; lowest rate.
DSCR
20% down · 8.5% · 30yr
- Down + closing
- —
- Monthly P&I
- —
- Monthly cashflow
- —
- DSCR
- —
- Eligible?
- —
No personal income docs; deal must DSCR.
Hard money
10% down · 12.0% · 12mo
- Down + closing
- —
- Monthly P&I
- —
- Monthly cashflow
- —
- DSCR
- —
- Eligible?
- —
Short-term bridge; refi at stabilization.
Rent comps 7 comps
| Address | Beds | Baths | Sqft | Rent | $/sqft | DOM | Units | Dist |
|---|---|---|---|---|---|---|---|---|
| 529 E William St Salisbury, MD | 3.0 | 1.0 | 1057 | $1,495 | $1.41 | 21d | 1 | 0.14mi |
| 604 Liberty St Salisbury, MD | 3.0 | 1.0 | 1110 | $1,500 | $1.35 | 43d | 1 | 0.71mi |
| 550 Riverside Dr Salisbury, MD | 3.0 | 2.0 | 1250 | $1,975 | $1.58 | 43d | 1 | 1.03mi |
| 719 Shiloh St Unit 1 Salisbury, MD | 3.0 | 1.0 | 1152 | $1,625 | $1.41 | 13d | 1 | 1.16mi |
| 518 Alabama Ave Salisbury, MD | 1.0–3.0 | 1.0–2.5 | 1028 | $1,784 | $1.73 | 13d | 14 | 1.24mi |
| 306 Carrollton Ave Salisbury, MD | 4.0 | 1.0 | 1163 | $1,700 | $1.46 | 43d | 1 | 1.46mi |
| 826 S Schumaker Dr Salisbury, MD | 1.0–3.0 | 1.0–2.5 | 1022 | $1,876 | $1.84 | 13d | 5 | 1.47mi |
Listing history 25 events
-
2026-06-18days on market $179,000 Active 54 DOM
-
2026-06-17days on market $179,000 Active 53 DOM
-
2026-06-16days on market $179,000 Active 52 DOM
-
2026-06-15days on market $179,000 Active 51 DOM
-
2026-06-14days on market $179,000 Active 49 DOM
-
2026-06-13days on market $179,000 Active 48 DOM
-
2026-06-10days on market $179,000 Active 46 DOM
-
2026-06-09days on market $179,000 Active 45 DOM
-
2026-06-08days on market $179,000 Active 44 DOM
-
2026-06-07days on market $179,000 Active 43 DOM
-
2026-06-03days on market $179,000 Active 39 DOM
-
2026-06-02pricedays on market $179,000 Active 38 DOM
-
2026-06-01days on market $190,000 Active 37 DOM
-
2026-05-31days on market $190,000 Active 36 DOM
-
2026-05-30days on market $190,000 Active 35 DOM
-
2026-04-30status Active Under Contract
-
2026-04-14historical
-
2026-03-12$190,000 Active
-
2021-12-21soldstatus $118,500
-
2021-12-08historical 269-char remark
Show marketing remark (269 chars)
This recently update home offers 3 bedrooms and 2 full baths. Additional room on first level can be used as an office or 4th bedroom. Traditional floor plan with larger kitchen, dining room, family room and living room or bonus room. New wiring, newer roof and windows.
-
2021-12-03soldstatus $118,500 Closed 269-char remark
Show marketing remark (269 chars)
This recently update home offers 3 bedrooms and 2 full baths. Additional room on first level can be used as an office or 4th bedroom. Traditional floor plan with larger kitchen, dining room, family room and living room or bonus room. New wiring, newer roof and windows.
-
2021-11-18status Pending 269-char remark
Show marketing remark (269 chars)
This recently update home offers 3 bedrooms and 2 full baths. Additional room on first level can be used as an office or 4th bedroom. Traditional floor plan with larger kitchen, dining room, family room and living room or bonus room. New wiring, newer roof and windows.
-
2021-10-28historical Active Under Contract 269-char remark
Show marketing remark (269 chars)
This recently update home offers 3 bedrooms and 2 full baths. Additional room on first level can be used as an office or 4th bedroom. Traditional floor plan with larger kitchen, dining room, family room and living room or bonus room. New wiring, newer roof and windows.
-
2021-10-10$118,500 Active 269-char remark
Show marketing remark (269 chars)
This recently update home offers 3 bedrooms and 2 full baths. Additional room on first level can be used as an office or 4th bedroom. Traditional floor plan with larger kitchen, dining room, family room and living room or bonus room. New wiring, newer roof and windows.
-
1985-09-17soldstatus $14,100
ⓘ Source: listings_history table (triggers on properties + properties_extension) + one-shot
backfill from property_details.listing_events for pre-trigger history.
Tax reassessment forecast MD · Partial reset (capped growth)
- Current annual tax
- $834 · $69/mo
- Projected year-2 tax
- $1,392 · $116/mo
- Expected delta
- +$559/yr (+$47/mo · 67.0%)
ⓘ Screening estimate from a state-policy table — verify with the county assessor before closing.
Climate risk First Street
- Flood 1/10 Low FEMA zone X (unshaded) · 0% chance over 30 yrs
- Wildfire 1/10 Low
- Heat 9/10 Extreme 7 d/yr ≥105°F today · 16 d/yr by 30 yrs out
- Wind 7/10 Severe 78% chance of damaging wind over 30 yrs
- Air quality 2/10 Low 1 unhealthy d/yr today · 2 by 30 yrs out
Nearby sold comps map
Loading sold comps map…
Walkable amenities ~0.75 mi
Loading nearby amenities…
Taxation est. · year 1
- Rental income
- $22,219
- − Mortgage interest
- −$10,027
- − Property taxes
- −$834
- − Insurance
- −$895
- − Repairs & maintenance
- −$1,778
- − Management
- −$1,778
- − Depreciation
- −$5,207
- Taxable income
- $1,701
- Est. tax owed @ 24.0%
- −$408
- After-tax cash flow
- $4,152/yr
For passive investors: Depreciation is non-cash, so a rental often shows a tax loss while cash-flowing — sheltering income. Rental losses are passive: they offset passive income freely, and up to $25,000/yr can offset ordinary (W-2) income if you actively participate and your MAGI is under $100k (phasing out to $0 by $150k); unused losses carry forward. On sale, claimed depreciation is recaptured at up to 25%, and gains may owe capital-gains tax (a 1031 exchange can defer both). Figures are a year-1 estimate at your 24.0% rate — not tax advice; consult a CPA.
Schools (NCES district)
- District
- Wicomico County Public Schools
- NCES district ID
- 2400690
- Math proficiency
- 16% ▼ -18.00%
- Reading proficiency
- 26% ▼ -13.00%
- Median HH income
- $51,745
- Composite
- 18.87/100
- National rank
- #8860
- State rank
- #19 of 24 in MD
Livability — Salisbury
- Score
- 60/100
- State rank
- #351
- US rank
- #18948
Category grades
Schools grade is shown separately in the Schools card above.
Census & demographics
- Census place
- Salisbury, MD
- County
- Wicomico County · 75,969 people
- City population
- 70,518
- Metro
- Salisbury, MD-DE
- Population (ZIP)
- 40,430
- Household income
- $73,156
- Rent vs Own
- Severe rent burden
- 2096.0
Population outlook (Wicomico County) Hauer SSP2
- Today (2025)
- 108,548 people
- By 2030
- 111,783 · +3.0%
- By 2040
- 118,139 · +8.8%
- By 2050
- 123,641 · +13.9%
- By 2075
- 139,784 · +28.8%
- By 2100
- 145,334 · +33.9%
Race, ethnicity, and origin ACS 2023
- Neighborhood character
- Diverse neighborhood (Simpson 0.61)
- Race & ethnicity
- White 54% Black 30% Two or more races 9% Hispanic / Latino 7% Asian 3%
- Hispanic origin (detail)
- Mexican 4% Dominican 1%
- Common ancestry
- Hispanic 8% Romanian 3% Slovak 1%
- Foreign-born
- 13% · Canada, Vietnam, South Korea
- Languages at home
- 83% English-only · French/Haitian/Cajun 7% Spanish 5% Other Indo-European 2%
Political lean MEDSL · Wicomico
- 2024 margin
- Lean R (+5.5) · D 46.1% · R 51.5% · Other 2.4%
- 2008→2024 swing
- +0.3pp no change · 2008: -5.8pp · 2024: -5.5pp
- All cycles
- 2024: R+5.5 2020: R+1.9 2016: R+11.6 2012: R+6.9 2008: R+5.8
Not yet ingested
- Civics
- —
Market trends
- HPI YoY
- ▼ -84.15%
- Current HPI
- 230.6099
- Rent YoY
- ▲ 3.78%
- Metro
- Salisbury, MD-DE
- State GDP YoY
- ▲ 2.97%
- F500 in state
- 12
Industry mix (Fortune 500 HQ in MD)
| Industry | F500 HQs | Revenue |
|---|---|---|
| Aerospace / Defense | 1 | $71B |
|
||
| Utilities | 1 | $25B |
|
||
| Hotels | 1 | $24B |
|
||
| Consumer Goods | 1 | $7B |
|
||
| Real Estate | 1 | $6B |
|
||
| Chemicals | 1 | $2B |
|
||
Price history
+1247.5% since first listed10 events — show timeline
- 2026-04-30 Relisted — BRIGHT MLS
- 2026-04-14 Listing Removed — BRIGHT MLS
- 2026-03-12 Listed $190,000 BRIGHT MLS
- 2021-12-21 Sold (Public Records) $118,500 Public Records
- 2021-12-08 Listing Removed — BRIGHT MLS
- 2021-12-03 Sold (MLS) $118,500 BRIGHT MLS
- 2021-11-18 Pending — BRIGHT MLS
- 2021-10-28 Contingent — BRIGHT MLS
- 2021-10-10 Listed $118,500 BRIGHT MLS
- 1985-09-17 Sold (Public Records) $14,100 Public Records
Property tax history
-0.0%/yrLatest (2025): $834 · +3.6% YoY. Source: county tax records.
Cash-flow waterfall
monthlySold comps — $/sqft
last 12 mo · ≤1 miLoading sold comps…