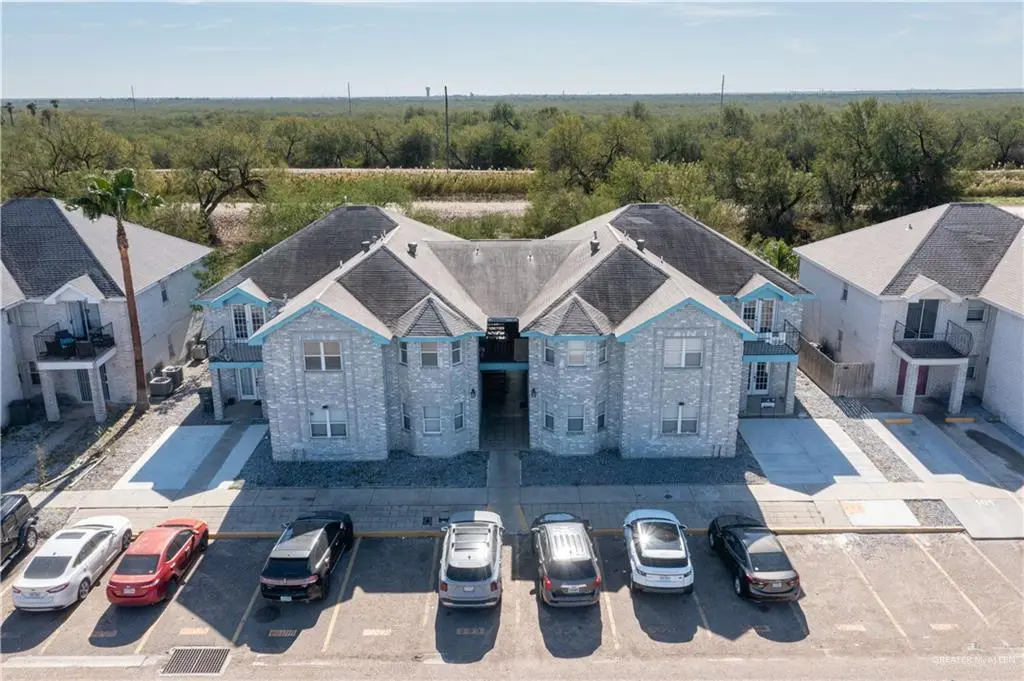
1802 Oasis Ave #206 · Mission, TX
Flood risk 1/10 · Minimal
- FEMA flood zone
- —
- Chance of flooding over 30 yrs
- 0.0%
- Est. flood insurance / yr
- —
Fire risk 5/10 · Moderate
- Est. fire insurance / yr
- $1,222 – $2,270
Heat risk 9/10 · Severe
- Hot days now (above 111°F)
- 7 days/yr
- Hot days in 30 yrs
- 22 days/yr
Wind risk 8/10 · Major
- Chance of severe wind over 30 yrs
- 94.0%
Air-quality risk 2/10 · Minimal
- Unhealthy air days now
- 1 days/yr
- Unhealthy air days in 30 yrs
- 2 days/yr
Risk factors via First Street. Map © Google.
Why this score? — see what drove the C- grade
The composite is a weighted blend of 9 inputs, each scored 0–100. Each bar is that input's sub-score; the figure is the points it added to the 100-point composite (weight × sub-score).
- Cash flow +16.7/30.0
- ARV discount +15.0/15.0
- DSCR +5.2/10.0
- 1% rule +4.5/10.0
- Condition / age +4.0/5.0
- Livability +3.8/5.0
- Rent growth +2.7/5.0
- Schools +1.7/10.0
- Appreciation +0.0/10.0
$110,000
🖨 Deal sheet 📄 Offer letter ✓ Due diligence
Listing remarks MLS
Spacious 3 bedroom, 2 bathroom condo featuring an open living and dining area, functional kitchen, and well-sized bedrooms. Convenient layout with ample storage. Located in an established community with easy access to shopping, dining, and major roadways. Ideal for owner-occupants or investors.
Key facts
- Built 1998
- Listed 156 days
Neighborhood map
What this means for you Summary
Snapshot
- This is a 3-bed/2.0-bath single-family listed at $110k. Condition is rated good.
Deal economics
- At list price, monthly cash flow is $68 ($811/yr) — positive.
- The deal already cash-flows at list — no discount required.
- To meet the 1% rule (rent ≥ 1% of price), the offer needs to be $105k (4.7% below list).
- Recommended offer: $97k (12.0% below list) — sets the bar for market timing.
- Cap rate 7.0% vs local median 3.5% in Mission — top-decile yield for the area; either an underpriced asset or a hidden risk that comps aren't pricing in. Stress-test before assuming the spread holds.
Location & tenants
- Location reads 75/100 on livability (#148 in TX, #4,155 nationally) — a middle-class / working-renter tenant base. Strengths: cost of living A+, housing A+, health & safety A+; Watch: schools C-, amenities F, commute F.
- Mission CISD (urban): math 15% / reading 28% proficiency, ranked #775 of 826 in TX (top 94%) — low school quality limits family demand, transient renter base, plan for 1-2y turnover; 78% free/reduced lunch — lower-income household profile, screen leases tightly.
- Market conditions: Rents flat; 852 active listings in the ZIP; 11 comparable units currently listed for rent nearby; rentals at typical pace (median 24d on market — plan ~3-4 weeks tenant-placement turnaround); 45% of comp listings sitting > 30 days — soft ceiling on asking rent; 7,378 units permitted in Hidalgo County in 2024 (641 in 5+ unit buildings).
Forward outlook
- Local home prices are declining (-3.0%/yr); year-one equity from $761 of loan paydown is wiped out by about $3k of value loss. Plan a longer hold.
- Hidalgo County population projected at +28% by 2050 — long-run rental-demand tailwind backs the buy-and-hold thesis.
Negotiation context
- It's been on market 156 days — a 12% lower offer ($97k) is reasonable based on typical stale-listing flexibility.
- 2 sale attempts with the ask held roughly flat each time — persistent listings suggest the price (not the market) is what's stuck; bring a comps-based counter.
Risks & watch-outs
- Climate carrying-cost: severe wind risk, 94% chance of damaging wind over 30y; moderate wildfire risk; extreme-heat days projected 7→22/yr by 2055 (HVAC capex compounding) — expect insurance premiums to compound above CPI over the hold.
Questions for the listing agent
- It's been on market 156 days. Have you received any prior offers? Is the seller open to a 12% concession, seller financing, or rate buy-down credit?
- Why hasn't it sold? Are there any deal-killer items the seller is aware of (foundation, flood, title, zoning, code violations)?
- Is there a deadline driving the sale (1031 exchange, divorce, estate, relocation)? That informs how much negotiation room exists.
- What's the average days-on-market for RENTAL listings here right now (not sales)? A rising rental-DOM trend means longer vacancies and softer asking-rent achievability than the comps imply.
- What's the recent tenant-quality profile in this submarket — average credit score on applications, eviction rate, late-payment / NSF rate, and stable-employment percentage? A property-management company in the area should have these aggregated.
- How much new for-sale + rental construction is in the pipeline within 1–3 miles? Heavy new supply typically softens prices + rents 12–24 months out; constrained supply supports both.
Investment metrics
- 1% rule
- 0.95% ✗
- Cap rate
- 7.03%
- Cash-on-cash
- 2.63%
- DSCR
- 1.12
- GRM
- 8.7
CMA / ARV
- ARV (median comp)
- $146,812
- List price
- $110,000
- Delta
- -25.07%
- Verdict
- UNDERPRICED
- Comps
- 20 within 1.0 mi
Show comp detail 2 sales within ~0.75 mi
| Address | Dist | Beds/Ba | Sqft | Sold | Price | $/sf | Match |
|---|---|---|---|---|---|---|---|
| 2006 Lake Front Dr | 0.34mi | 2/2.0 (-1) | 904 (-9%) | 3mo | $167,000 | $185 | 62 |
| 708 Lake View Dr | 0.52mi | 3/2.0 | 1,125 (+13%) | 17mo | $179,900 | $160 | 39 |
Match score weights: distance 35% · size 25% · config 20% · recency 20%. Top-matched comps best support the ARV.
Projected returns pro-forma
-3.0% appreciation · 0.93% rent growth · sell at horizon
- IRR
- -14.5%
- Equity multiple
- 0.49×
- Total profit
- $-15,642
- Equity at exit
- $16,401
- IRR
- -9.6%
- Equity multiple
- 0.47×
- Total profit
- $-16,430
- Equity at exit
- $9,511
Cash invested: $30,800 (down + closing). Projections, not guarantees.
Landlord ↔ Tenant lean methodology
- Overall (STATE)
- 87 Strongly Landlord-Friendly
- State Texas
- 87 Strongly Landlord-Friendly · R+5
- County
- — inherits STATE
- City
- — inherits STATE
ZIP-level market 78572
- Home prices YoY
- -22.9%
- Rents YoY
- 0.9%
- Active inventory
- 852
- Price-to-rent
- 8.7×
Monthly cashflow live
- Estimated rent
- $1,048 high interval (Pro) →
- Mortgage (P&I)
- −$577
- Tax est. 1.5%
- −$138 /mo · $1,650/yr
- Insurance
- −$46
- HOA
- −$0
- Vacancy / Maint / Mgmt
- −$220
- Net cashflow
- $68
Break-even live
UW: 25.0% down · 7.5% · 30yr · 1.5% tax · 5.0% vac · 8.0% maint · 8.0% mgmt
Financing live
Cash to close
- Down payment
- $27,500
- Closing costs
- $3,300
- Reserves months
- —
- Total cash needed
- —
Loan-product check · same deal, 3 products live
Conventional
25% down · 7.5% · 30yr
- Down + closing
- —
- Monthly P&I
- —
- Monthly cashflow
- —
- DSCR
- —
- Eligible?
- —
Personal DTI + credit; lowest rate.
DSCR
20% down · 8.5% · 30yr
- Down + closing
- —
- Monthly P&I
- —
- Monthly cashflow
- —
- DSCR
- —
- Eligible?
- —
No personal income docs; deal must DSCR.
Hard money
10% down · 12.0% · 12mo
- Down + closing
- —
- Monthly P&I
- —
- Monthly cashflow
- —
- DSCR
- —
- Eligible?
- —
Short-term bridge; refi at stabilization.
Rent comps 11 comps
| Address | Beds | Baths | Sqft | Rent | $/sqft | DOM | Units | Dist |
|---|---|---|---|---|---|---|---|---|
| 1800 Oasis Dr Unit 101 Mission, TX | 2.0 | 1.0 | 905 | $725 | $0.80 | 23d | 1 | 0.00mi |
| 1804 Oasis Ave Mission, TX | 2.0 | 1.0 | 899 | $788 | $0.88 | 19d | 3 | 0.02mi |
| 1802 Oasis Dr Unit 202 Mission, TX | 2.0 | 1.0 | 893 | $850 | $0.95 | 43d | 1 | 0.02mi |
| 1525 Oasis Dr Unit 4 Mission, TX | 3.0 | 2.0 | 1100 | $825 | $0.75 | 14d | 1 | 0.12mi |
| 1605 W B St Mission, TX | 2.0 | 2.0 | 814 | $1,200 | $1.47 | 43d | 1 | 0.57mi |
| 1525 W B St Mission, TX | 2.0 | 2.0 | 852 | $1,350 | $1.58 | 19d | 1 | 0.57mi |
| 1513 W B St Mission, TX | 3.0 | 2.0 | 868 | $1,300 | $1.50 | 43d | 1 | 0.58mi |
| 1513 W B St Mission, TX | 3.0 | 2.0 | 868 | $1,300 | $1.50 | 14d | 1 | 0.58mi |
| 401 Bertha Ave Unit 3 Mission, TX | 2.0 | 2.0 | 1050 | $1,200 | $1.14 | 19d | 1 | 0.70mi |
| 401 Bertha Ave Unit 2 Mission, TX | 2.0 | 2.0 | 950 | $1,300 | $1.37 | 43d | 1 | 0.70mi |
| 1500 Industrial Way Unit A Mission, TX | 2.0 | 1.0 | 990 | $990 | $1.00 | 43d | 1 | 0.95mi |
Listing history 15 events
-
2026-06-14status $110,000 Pending 156 DOM
-
2026-06-10days on market $110,000 Active 156 DOM
-
2026-06-09days on market $110,000 Active 155 DOM
-
2026-06-08days on market $110,000 Active 154 DOM
-
2026-06-07days on market $110,000 Active 153 DOM
-
2026-06-03days on market $110,000 Active 149 DOM
-
2026-06-02days on market $110,000 Active 148 DOM
-
2026-06-01days on market $110,000 Active 147 DOM
-
2026-05-31days on market $110,000 Active 146 DOM
-
2026-05-31days on market $110,000 Active 145 DOM
-
2026-03-13price $925
-
2026-01-29price $995
-
2026-01-05$110,000 Active 295-char remark
Show marketing remark (295 chars)
Spacious 3 bedroom, 2 bathroom condo featuring an open living and dining area, functional kitchen, and well-sized bedrooms. Convenient layout with ample storage. Located in an established community with easy access to shopping, dining, and major roadways. Ideal for owner-occupants or investors.
-
2025-07-20price $1,150
-
2025-07-15$950
ⓘ Source: listings_history table (triggers on properties + properties_extension) + one-shot
backfill from property_details.listing_events for pre-trigger history.
Climate risk First Street
- Flood 1/10 Low 0% chance over 30 yrs
- Wildfire 5/10 Major
- Heat 9/10 Extreme 7 d/yr ≥111°F today · 22 d/yr by 30 yrs out
- Wind 8/10 Severe 94% chance of damaging wind over 30 yrs
- Air quality 2/10 Low 1 unhealthy d/yr today · 2 by 30 yrs out
Nearby sold comps map
Loading sold comps map…
Walkable amenities ~0.75 mi
Loading nearby amenities…
Taxation est. · year 1
- Rental income
- $12,574
- − Mortgage interest
- −$6,162
- − Property taxes
- −$1,650
- − Insurance
- −$550
- − Repairs & maintenance
- −$1,006
- − Management
- −$1,006
- − Depreciation
- −$3,200
- Taxable loss
- −$1,000
- Est. tax savings @ 24.0%
- +$240
- After-tax cash flow
- $1,051/yr
For passive investors: Depreciation is non-cash, so a rental often shows a tax loss while cash-flowing — sheltering income. Rental losses are passive: they offset passive income freely, and up to $25,000/yr can offset ordinary (W-2) income if you actively participate and your MAGI is under $100k (phasing out to $0 by $150k); unused losses carry forward. On sale, claimed depreciation is recaptured at up to 25%, and gains may owe capital-gains tax (a 1031 exchange can defer both). Figures are a year-1 estimate at your 24.0% rate — not tax advice; consult a CPA.
Condition & rehab AI · 12 photos
This well-maintained, move-in-ready 3-bedroom, 2-bathroom condo is located in an established community with easy access to amenities. It features an open floor plan, modern appliances, and a clean exterior, making it an attractive option for both owner-occupants and investors.
Value-add opportunities
- Both Painting exterior and interior walls — Enhances curb appeal and interior aesthetics
- Both Reorganizing kitchen cabinets for better functionality — Improves storage and usability
- Both Upgrading light fixtures in bathrooms — Enhances ambiance and value
- Both Adding smart home features — Improves convenience and marketability
Renovation cost estimate screening
Value-add ROI direction
- Both Painting exterior and interior walls — Enhances curb appeal and interior aesthetics ↑
- Both Reorganizing kitchen cabinets for better functionality — Improves storage and usability ↑
- Both Upgrading light fixtures in bathrooms — Enhances ambiance and value ↑
- Both Adding smart home features — Improves convenience and marketability ↑
ⓘ Cost ranges are severity-bucket heuristics (US national rule-of-thumb). Get contractor quotes + a written scope before underwriting a rehab budget.
Schools (NCES district)
- District
- Mission CISD
- NCES district ID
- 4831040
- Math proficiency
- 15% ▼ -35.00%
- Reading proficiency
- 28% ▼ -15.00%
- Median HH income
- $32,855
- Composite
- 17.47/100
- National rank
- #9061
- State rank
- #775 of 826 in TX
Livability — Mission
- Score
- 75/100
- State rank
- #148
- US rank
- #4155
Category grades
Schools grade is shown separately in the Schools card above.
Census & demographics
- Census place
- Mission, TX
- County
- Hidalgo County · 623,128 people
- City population
- 78,024
- Metro
- McAllen-Edinburg-Mission, TX
- Population (ZIP)
- 78,024
- Household income
- $54,298
- Rent vs Own
- Severe rent burden
- 1714.0
Population outlook (Hidalgo County) Hauer SSP2
- Today (2025)
- 955,232 people
- By 2030
- 1,009,774 · +5.7%
- By 2040
- 1,120,332 · +17.3%
- By 2050
- 1,225,036 · +28.2%
- By 2075
- 1,439,189 · +50.7%
- By 2100
- 1,533,429 · +60.5%
Race, ethnicity, and origin ACS 2023
- Neighborhood character
- Predominantly Hispanic (85%)
- Race & ethnicity
- Hispanic / Latino 85% Two or more races 47% White 12% Asian 2%
- Hispanic origin (detail)
- Mexican 80%
- Common ancestry
- Slovak 1% Portuguese 0%
- Foreign-born
- 28% · Canada, South Korea
- Languages at home
- 22% English-only · Spanish 76%
Political lean MEDSL · Hidalgo
- 2024 margin
- Toss-up / Even · D 48.1% · R 51.0%
- 2008→2024 swing
- -41.6pp toward R · 2008: 38.7pp · 2024: -2.9pp
- All cycles
- 2024: R+2.9 2020: D+17.1 2016: D+40.5 2012: D+41.8 2008: D+38.7
Not yet ingested
- Civics
- —
Market trends
- HPI YoY
- ▼ -62.35%
- Current HPI
- 209.3573
- Rent YoY
- ▲ 0.93%
- Metro
- McAllen-Edinburg-Mission, TX
- State GDP YoY
- ▲ 3.95%
- F500 in state
- 110
Industry mix (Fortune 500 HQ in TX)
| Industry | F500 HQs | Revenue |
|---|---|---|
| Energy | 16 | $1,198B |
|
||
| Technology | 5 | $198B |
|
||
| Engineering / Construction | 4 | $72B |
|
||
| Energy Services | 3 | $60B |
|
||
| Utilities | 3 | $41B |
|
||
| Healthcare | 2 | $330B |
|
||
Price history
+9465.2% since first listed5 events — show timeline
- 2026-03-13 Price Changed $925 RENTEC
- 2026-01-29 Price Changed $995 RENTEC
- 2026-01-05 Listed $110,000 MCALLENMLS
- 2025-07-20 Price Changed $1,150 RENTEC
- 2025-07-15 Listed for Rent $950 RENTEC
Cash-flow waterfall
monthlySold comps — $/sqft
last 12 mo · ≤1 miLoading sold comps…