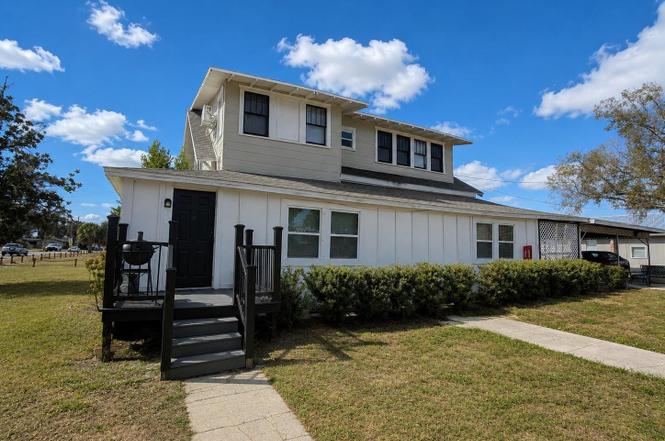
 5-Plex
1339 7th St SW · Winter Haven, FL
Flood risk 1/10 · Minimal
- FEMA flood zone
- X (unshaded)
- Chance of flooding over 30 yrs
- 0.0%
- Est. flood insurance / yr
- $507 – $1,088
Fire risk 3/10 · Minor
- Est. fire insurance / yr
- $947 – $1,759
Heat risk 8/10 · Major
- Hot days now (above 107°F)
- 7 days/yr
- Hot days in 30 yrs
- 23 days/yr
Wind risk 9/10 · Severe
- Chance of severe wind over 30 yrs
- 99.0%
Air-quality risk 2/10 · Minimal
- Unhealthy air days now
- 0 days/yr
- Unhealthy air days in 30 yrs
- 2 days/yr
Risk factors via First Street. Map © Google.
Why this score? — see what drove the B grade
The composite is a weighted blend of 9 inputs, each scored 0–100. Each bar is that input's sub-score; the figure is the points it added to the 100-point composite (weight × sub-score).
- Cash flow +30.0/30.0
- 1% rule +10.0/10.0
- DSCR +10.0/10.0
- ARV discount +7.5/15.0
- Livability +3.7/5.0
- Schools +3.5/10.0
- Rent growth +3.1/5.0
- Condition / age +2.5/5.0
- Appreciation +0.0/10.0
$459,000
🖨 Deal sheet 📄 Offer letter ✓ Due diligence
Multi-family units
County records classify this as Multi-Family (5+ Unit). Listing-text estimate: 5 units. confirmed
5+ unit building — per-unit beds/baths from public records are typically unavailable; the breakdown below (if shown) is an estimate from the listing text.
Listing remarks
Virtually Staged. Fully occupied 5-unit multifamily investment property located minutes from Downtown Winter Haven in a high-demand rental market. Zoned multifamily and currently producing immediate cash flow with all units leased. Strong location near major thoroughfares, retail, and ongoing residential development, including a planned townhome project that is expected to support future rental demand. Opportunity exists for additional income growth through rent optimization. Situated in one of Central Florida's fastest-growing submarkets, this stabilized asset offers current income, long-term appreciation potential, and portfolio expansion opportunities. Contact for rent roll and financial
Key facts
- Diversified unit mix
- 5 unit property
- 0.33 acre lot
Tags
Property features AI
Finance
- Other: Property type: Residential income (multi-family 5+); Lot approximately 0.33 acre (dimensions ~143 x 100); Total building area and living area reported (building area ~3,140; living area ~3,020)
- Financial info: Annual net income reported: $52,800; Unit rent pro formas listed (examples): 2-bed unit $950/month; 1-bed units $700–$950/month
- HOA & community: No association
Exterior
- Parking: Carport available; Five carport spaces
- Utilities: Public water; Public sewer; Cable available; Public utilities
- Home design: Residential income property configured as a 5+ unit multi-family; Single building on the lot
- Construction: Vinyl siding; Shingle roof; Built on stilts / on pilings (stilt/piling foundation)
- Exterior features: Balcony; Asphalt road access
Interior
- Bedrooms: Six bedrooms total (multi-family property with five separate units)
- Bathrooms: Multiple bathrooms across units (each unit lists 1 bathroom)
- Heating & cooling: Ductless heating; Mini-split cooling units; Wall/window air conditioning units
- Interior features: Ceiling fans
- Laundry & utility: No on-site laundry features listed; Tenants pay electricity
Neighborhood map
What this means for you Summary
Snapshot
- This is a 5 × 6-bed/5.0-bath units multifamily listed at $459k.
Deal economics
- At list price, monthly cash flow is $4k ($49k/yr) — positive. Per door: $808/mo.
- The deal already cash-flows at list — no discount required.
- Meets the 1% rule at list price ($9k rent vs $459k).
- Recommended offer: $418k (9.0% below list) — sets the bar for market timing.
Location & tenants
- Location reads 74/100 on livability (#291 in FL, #4,898 nationally) — a middle-class / working-renter tenant base. Strengths: cost of living A+, housing A+, health & safety A; Watch: employment C-, amenities F, commute F.
- Polk (suburban): math 39% / reading 43% proficiency, ranked #62 of 73 in FL (top 85%) — families likely to look elsewhere, expect single-tenant / working-renter base with shorter leases.
- Zoned schools: Winter Haven Senior High School (math 26% / reading 38%, grade F, #415 of 667 statewide, top 63%, 2,467 students, 50% FRL).
- Market conditions: Rents rising (+2.5%/yr); 341 active listings in the ZIP; 1 comparable units currently listed for rent nearby; 10,384 units permitted in Polk County in 2024 (1,716 in 5+ unit buildings).
- At $9,306/mo this rent would consume 198% of the median local household income ($56k/yr) (locally 1412% of renters already pay >50% of income on rent) — very limited rent-growth headroom before tenants either downsize or default.
Forward outlook
- Local home prices are declining (-3.0%/yr); year-one equity from $3k of loan paydown is wiped out by about $14k of value loss. Plan a longer hold.
- Polk County population projected at +33% by 2050 — long-run rental-demand tailwind backs the buy-and-hold thesis.
- At projected returns (-3.0% appreciation + 2.5% rent growth), your $129k cash investment doubles in ~4 years — after that, you're playing with house money.
Negotiation context
- It's been on market 119 days — a 9% lower offer ($418k) is reasonable based on typical stale-listing flexibility.
- 5 sale attempts since 4y ago; this cycle's ask has dropped $40k (8%) from the opening price — seller is motivated, your offer sets the floor, not the list.
- Current owner paid $100k; list at $459k implies a 359% gain — meaningful room to come down on a strong offer.
Risks & watch-outs
- Watch-outs: built in 1920 — expect roof / HVAC / electrical / plumbing capex.
- Climate carrying-cost: severe wind risk, 99% chance of damaging wind over 30y; extreme-heat days projected 7→23/yr by 2055 (HVAC capex compounding) — expect insurance premiums to compound above CPI over the hold.
Questions for the listing agent
- It's been on market 119 days. Have you received any prior offers? Is the seller open to a 9% concession, seller financing, or rate buy-down credit?
- Can we see the unit-by-unit rent roll, current vacancy, and any below-market leases? What's the average tenancy length?
- What capital expenditures (roof, boiler, parking lot, exteriors) have been made in the last 5 years, and what's planned in the next 2?
- Built in 1920 — when were the roof, HVAC, electrical panel, plumbing, and water heater last replaced?
- Why hasn't it sold? Are there any deal-killer items the seller is aware of (foundation, flood, title, zoning, code violations)?
- Is there a deadline driving the sale (1031 exchange, divorce, estate, relocation)? That informs how much negotiation room exists.
- What's the average days-on-market for RENTAL listings here right now (not sales)? A rising rental-DOM trend means longer vacancies and softer asking-rent achievability than the comps imply.
- What's the recent tenant-quality profile in this submarket — average credit score on applications, eviction rate, late-payment / NSF rate, and stable-employment percentage? A property-management company in the area should have these aggregated.
- How much new apartment / multifamily construction is in the pipeline within 1–3 miles? Heavy new supply (>2% of stock underway) typically softens rents 12–24 months out; light construction supports rent growth.
Investment metrics
- 1% rule
- 2.03% ✓
- Cap rate
- 16.86%
- Cash-on-cash
- 37.74%
- DSCR
- 2.68
- GRM
- 4.1
CMA / ARV
No comps found within radius.
Projected returns pro-forma
-3.0% appreciation · 2.47% rent growth · sell at horizon
- IRR
- 33.2%
- Equity multiple
- 2.39×
- Total profit
- $178,346
- Equity at exit
- $68,438
- IRR
- 39.8%
- Equity multiple
- 4.64×
- Total profit
- $467,663
- Equity at exit
- $39,686
Cash invested: $128,520 (down + closing). Projections, not guarantees.
Landlord ↔ Tenant lean methodology
- Overall (STATE)
- 87 Strongly Landlord-Friendly
- State Florida
- 87 Strongly Landlord-Friendly · R+3
- County
- — inherits STATE
- City
- — inherits STATE
ZIP-level market 33880
- Home prices YoY
- -16.2%
- Rents YoY
- 2.5%
- Active inventory
- 341
- Price-to-rent
- 20.6×
Monthly cashflow live
- Estimated rent
- $9,306 medium interval (Pro) →
- Mortgage (P&I)
- −$2,407
- Tax from tax record
- −$711 /mo · $8,538/yr
- Insurance
- −$191
- HOA
- −$0
- Vacancy / Maint / Mgmt
- −$1,954
- Net cashflow
- $4,042
Break-even live
5-unit breakdown (identical units grouped — click to expand)
| Units | Beds | Baths | Est. rent |
|---|---|---|---|
| 5× units | 6 | 5 | $9,305 |
| #1 | 6 | 5 | $1,861 |
| #2 | 6 | 5 | $1,861 |
| #3 | 6 | 5 | $1,861 |
| #4 | 6 | 5 | $1,861 |
| #5 | 6 | 5 | $1,861 |
| Total (5 units) | $9,306 | ||
UW: 25.0% down · 7.5% · 30yr · 1.5% tax · 5.0% vac · 8.0% maint · 8.0% mgmt
Financing live
Cash to close
- Down payment
- $114,750
- Closing costs
- $13,770
- Reserves months
- —
- Total cash needed
- —
Loan-product check · same deal, 3 products live
Conventional
25% down · 7.5% · 30yr
- Down + closing
- —
- Monthly P&I
- —
- Monthly cashflow
- —
- DSCR
- —
- Eligible?
- —
Personal DTI + credit; lowest rate.
DSCR
20% down · 8.5% · 30yr
- Down + closing
- —
- Monthly P&I
- —
- Monthly cashflow
- —
- DSCR
- —
- Eligible?
- —
No personal income docs; deal must DSCR.
Hard money
10% down · 12.0% · 12mo
- Down + closing
- —
- Monthly P&I
- —
- Monthly cashflow
- —
- DSCR
- —
- Eligible?
- —
Short-term bridge; refi at stabilization.
Rent comps 1 comps
| Address | Beds | Baths | Sqft | Rent | $/sqft | DOM | Units | Dist |
|---|---|---|---|---|---|---|---|---|
| 521 20th St SW Unit c Winter Haven, FL | 2.0 | 2.0 | 2732 | $1,175 | $0.43 | 12d | 1 | 1.09mi |
Listing history 30 events
-
2026-06-18days on market $459,000 Active 119 DOM
-
2026-06-17days on market $459,000 Active 118 DOM
-
2026-06-16days on market $459,000 Active 117 DOM
-
2026-06-15days on market $459,000 Active 116 DOM
-
2026-06-13remarks 699-char remark
-
2026-06-13days on market $459,000 Active 114 DOM
-
2026-06-10days on market $459,000 Active 111 DOM
-
2026-06-09days on market $459,000 Active 110 DOM
-
2026-06-08days on market $459,000 Active 109 DOM
-
2026-06-07days on market $459,000 Active 108 DOM
-
2026-06-05days on market $459,000 Active 105 DOM
-
2026-06-03days on market $459,000 Active 103 DOM
-
2026-06-01days on market $459,000 Active 102 DOM
-
2026-05-31days on market $459,000 Active 101 DOM
-
2026-05-07price $459,000
-
2026-04-22price $489,000
-
2026-02-19$499,000 Active
-
2024-12-31historical
-
2024-07-19$499,900 Active
-
2024-04-20historical
-
2024-04-11price $399,900
-
2024-02-01price $479,900
-
2023-12-26$499,900 Active
-
2022-10-25soldstatus $100,000
-
2022-10-13soldstatus $100,000 Closed
-
2022-09-19status Pending
-
2022-09-16price $124,000
-
2022-07-22$169,000 Active
-
2022-07-22historical
-
2022-07-21$169,000 Active
ⓘ Source: listings_history table (triggers on properties + properties_extension) + one-shot
backfill from property_details.listing_events for pre-trigger history.
Tax reassessment forecast FL · Resets to sale price
- Current annual tax
- $8,538 · $711/mo
- Projected year-2 tax
- $8,538 · $711/mo
- Expected delta
- $0/yr ($0/mo · 0.0%)
ⓘ Screening estimate from a state-policy table — verify with the county assessor before closing.
Climate risk First Street
- Flood 1/10 Low FEMA zone X (unshaded) · 0% chance over 30 yrs
- Wildfire 3/10 Moderate
- Heat 8/10 Severe 7 d/yr ≥107°F today · 23 d/yr by 30 yrs out
- Wind 9/10 Extreme 99% chance of damaging wind over 30 yrs
- Air quality 2/10 Low 0 unhealthy d/yr today · 2 by 30 yrs out
Nearby sold comps map
Loading sold comps map…
Walkable amenities ~0.75 mi
Loading nearby amenities…
Taxation est. · year 1
- Rental income
- $111,672
- − Mortgage interest
- −$25,711
- − Property taxes
- −$8,538
- − Insurance
- −$2,295
- − Repairs & maintenance
- −$8,934
- − Management
- −$8,934
- − Depreciation
- −$13,353
- Taxable income
- $43,908
- Est. tax owed @ 24.0%
- −$10,538
- After-tax cash flow
- $37,966/yr
For passive investors: Depreciation is non-cash, so a rental often shows a tax loss while cash-flowing — sheltering income. Rental losses are passive: they offset passive income freely, and up to $25,000/yr can offset ordinary (W-2) income if you actively participate and your MAGI is under $100k (phasing out to $0 by $150k); unused losses carry forward. On sale, claimed depreciation is recaptured at up to 25%, and gains may owe capital-gains tax (a 1031 exchange can defer both). Figures are a year-1 estimate at your 24.0% rate — not tax advice; consult a CPA.
Schools (NCES district)
- District
- Polk
- NCES district ID
- 1201590
- Math proficiency
- 39% ▼ -11.00%
- Reading proficiency
- 43% ▼ -4.00%
- Median HH income
- $43,979
- Composite
- 34.74/100
- National rank
- #5132
- State rank
- #62 of 73 in FL
Livability — Winter Haven
- Score
- 74/100
- State rank
- #291
- US rank
- #4898
Category grades
Schools grade is shown separately in the Schools card above.
Census & demographics
- Census place
- Winter Haven, FL
- County
- Polk County · 740,051 people
- City population
- 121,740
- Metro
- Lakeland-Winter Haven, FL
- Population (ZIP)
- 43,371
- Household income
- $56,390
- Rent vs Own
- Severe rent burden
- 1412.0
Population outlook (Polk County) Hauer SSP2
- Today (2025)
- 752,975 people
- By 2030
- 804,621 · +6.9%
- By 2040
- 906,117 · +20.3%
- By 2050
- 1,000,476 · +32.9%
- By 2075
- 1,197,520 · +59.0%
- By 2100
- 1,271,518 · +68.9%
Race, ethnicity, and origin ACS 2023
- Neighborhood character
- Diverse neighborhood (Simpson 0.65)
- Race & ethnicity
- White 49% Hispanic / Latino 27% Black 17% Two or more races 14% Asian 1%
- Hispanic origin (detail)
- Mexican 11% Puerto Rican 10% Cuban 2%
- Common ancestry
- Hispanic 2% Lithuanian 1% Italian 1%
- Foreign-born
- 9% · Canada, Jamaica
- Languages at home
- 74% English-only · Spanish 21% French/Haitian/Cajun 4%
Political lean MEDSL · Polk
- 2024 margin
- Strong R (+20.7) · D 39.2% · R 59.9%
- 2008→2024 swing
- -14.6pp toward R · 2008: -6.1pp · 2024: -20.7pp
- All cycles
- 2024: R+20.7 2020: R+14.4 2016: R+14.1 2012: R+6.8 2008: R+6.1
Not yet ingested
- Civics
- —
Market trends
- HPI YoY
- ▼ -61.41%
- Current HPI
- 317.8788
- Rent YoY
- ▲ 2.47%
- Metro
- Lakeland-Winter Haven, FL
- State GDP YoY
- ▲ 3.28%
- F500 in state
- 36
Industry mix (Fortune 500 HQ in FL)
| Industry | F500 HQs | Revenue |
|---|---|---|
| Industrial Technology | 2 | $29B |
|
||
| Insurance | 2 | $17B |
|
||
| Retail | 1 | $60B |
|
||
| Technology Distribution | 1 | $58B |
|
||
| Homebuilding | 1 | $35B |
|
||
| Technology Manufacturing | 1 | $35B |
|
||
Price history
+171.6% since first listed16 events — show timeline
- 2026-05-07 Price Changed $459,000 Stellar MLS as Distributed by MLS Grid
- 2026-04-22 Price Changed $489,000 Stellar MLS as Distributed by MLS Grid
- 2026-02-19 Listed $499,000 Stellar MLS as Distributed by MLS Grid
- 2024-12-31 Listing Removed — Stellar MLS as Distributed by MLS Grid
- 2024-07-19 Listed $499,900 Stellar MLS as Distributed by MLS Grid
- 2024-04-20 Listing Removed — Stellar MLS as Distributed by MLS Grid
- 2024-04-11 Price Changed $399,900 Stellar MLS as Distributed by MLS Grid
- 2024-02-01 Price Changed $479,900 Stellar MLS as Distributed by MLS Grid
- 2023-12-26 Listed $499,900 Stellar MLS as Distributed by MLS Grid
- 2022-10-25 Sold (Public Records) $100,000 Public Records
- 2022-10-13 Sold (MLS) $100,000 Stellar MLS as Distributed by MLS Grid
- 2022-09-19 Pending — Stellar MLS as Distributed by MLS Grid
- 2022-09-16 Price Changed $124,000 Stellar MLS as Distributed by MLS Grid
- 2022-07-22 Listing Removed — Stellar MLS as Distributed by MLS Grid
- 2022-07-22 Listed $169,000 Stellar MLS as Distributed by MLS Grid
- 2022-07-21 Listed $169,000 Stellar MLS as Distributed by MLS Grid
Property tax history
+15.1%/yrLatest (2025): $8,538 · +8.4% YoY. Source: county tax records.
Cash-flow waterfall
monthlySold comps — $/sqft
last 12 mo · ≤1 miLoading sold comps…