 Duplex
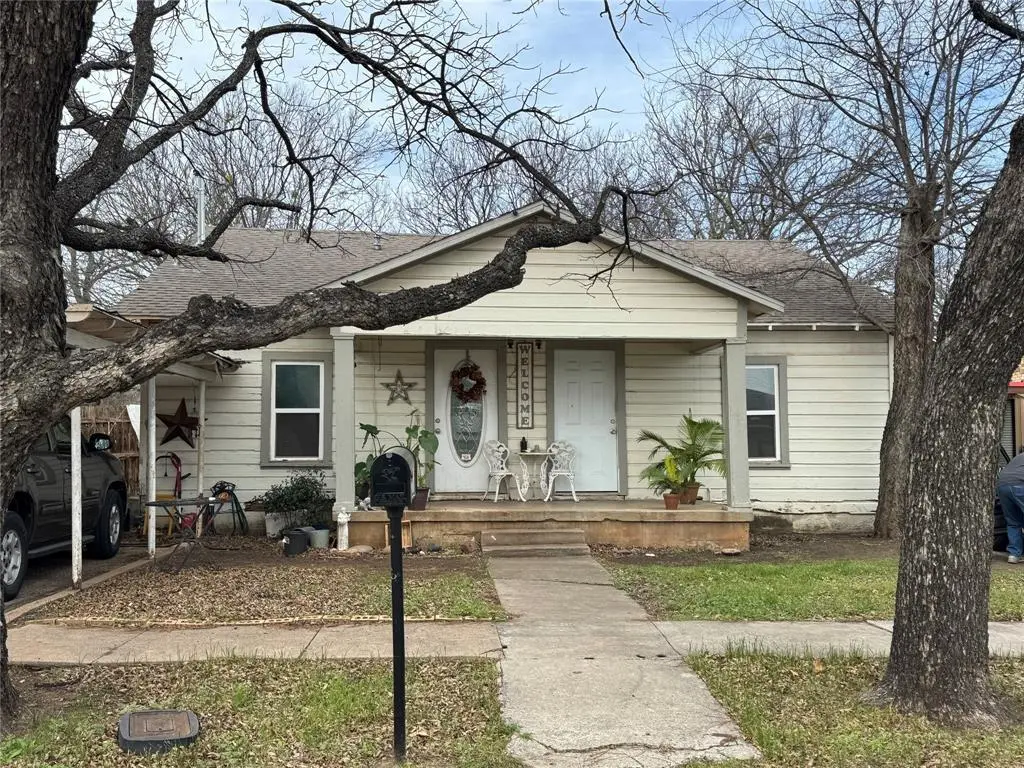
111 N Nueces · Coleman, TX
Flood risk No data
- FEMA flood zone
- —
- Chance of flooding over 30 yrs
- —
- Est. flood insurance / yr
- —
Fire risk No data
- Est. fire insurance / yr
- —
Heat risk No data
- Hot days now (above threshold)
- —
- Hot days in 30 yrs
- —
Wind risk No data
- Chance of severe wind over 30 yrs
- —
Air-quality risk No data
- Unhealthy air days now
- —
- Unhealthy air days in 30 yrs
- —
Risk factors via First Street. Map © Google.
Why this score? — see what drove the B- grade
The composite is a weighted blend of 9 inputs, each scored 0–100. Each bar is that input's sub-score; the figure is the points it added to the 100-point composite (weight × sub-score).
- Cash flow +30.0/30.0
- 1% rule +10.0/10.0
- DSCR +10.0/10.0
- ARV discount +7.5/15.0
- Livability +3.4/5.0
- Schools +3.3/10.0
- Rent growth +2.5/5.0
- Condition / age +2.5/5.0
- Appreciation +0.0/10.0
$114,900
🖨 Deal sheet 📄 Offer letter ✓ Due diligence
Multi-family units
County records classify this as Multi-Family (2-4 Unit). Listing-text estimate: 2 units. confirmed
Listing remarks MLS
Cash-flowing duplex investment opportunity in Coleman, Texas, located just 45 minutes from Abilene. This income-producing property is currently leased and offers immediate rental income for investors looking to expand their portfolio. The property has been renovated in the past and provides functional layouts with reliable tenancy already in place. Situated in a quiet area with small-town charm, this duplex is a solid addition for both new and seasoned investors seeking steady cash flow. The property can be purchased individually or as part of a larger investment package that includes additional multifamily opportunities at 516 and 518 S Nueces and 502 Cottonwood.
Key facts
- Reliable tenancy
- Functional layouts
- 6,251 sq ft lot
Tags
Neighborhood map
What this means for you Summary
Snapshot
- This is a 2 × 2-bed/2.0-bath units multifamily listed at $115k.
Deal economics
- At list price, monthly cash flow is $1k ($15k/yr) — positive. Per door: $615/mo.
- The deal already cash-flows at list — no discount required.
- Meets the 1% rule at list price ($3k rent vs $115k).
- Recommended offer: $105k (9.0% below list) — sets the bar for market timing.
- Cap rate 19.1% vs local median 4.5% in Coleman — top-decile yield for the area; either an underpriced asset or a hidden risk that comps aren't pricing in. Stress-test before assuming the spread holds.
Location & tenants
- Location reads 68/100 on livability (#454 in TX) — a middle-class / working-renter tenant base. Strengths: crime A+, cost of living A+, housing A+; Watch: health & safety D+, schools F, amenities F.
- Coleman ISD (town): math 42% / reading 39% proficiency, ranked #439 of 826 in TX (top 53%) — families likely to look elsewhere, expect single-tenant / working-renter base with shorter leases.
- Market conditions: 26 active listings in the ZIP; 5 units permitted in Coleman County in 2024 (0 in 5+ unit buildings).
Forward outlook
- Local home prices are declining (-3.0%/yr); year-one equity from $794 of loan paydown is wiped out by about $3k of value loss. Plan a longer hold.
- Coleman County population projected at -28% by 2050 — secular population decline; favor cash flow + early exit over multi-decade hold.
- At projected returns (-3.0% appreciation + 3.0% rent growth), your $32k cash investment doubles in ~3 years — after that, you're playing with house money.
Negotiation context
- It's been on market 104 days — a 9% lower offer ($105k) is reasonable based on typical stale-listing flexibility.
- 3 sale attempts since 11y ago with the ask held roughly flat each time — persistent listings suggest the price (not the market) is what's stuck; bring a comps-based counter.
Questions for the listing agent
- It's been on market 104 days. Have you received any prior offers? Is the seller open to a 9% concession, seller financing, or rate buy-down credit?
- Can we see the unit-by-unit rent roll, current vacancy, and any below-market leases? What's the average tenancy length?
- What capital expenditures (roof, boiler, parking lot, exteriors) have been made in the last 5 years, and what's planned in the next 2?
- Built in 1960 — when were the roof, HVAC, electrical panel, plumbing, and water heater last replaced?
- Why hasn't it sold? Are there any deal-killer items the seller is aware of (foundation, flood, title, zoning, code violations)?
- Is there a deadline driving the sale (1031 exchange, divorce, estate, relocation)? That informs how much negotiation room exists.
- Schools are F-rated, which usually means shorter tenancies and higher turnover. Who's the typical renter profile here, and what's been the actual vacancy rate?
- What's the average days-on-market for RENTAL listings here right now (not sales)? A rising rental-DOM trend means longer vacancies and softer asking-rent achievability than the comps imply.
- What's the recent tenant-quality profile in this submarket — average credit score on applications, eviction rate, late-payment / NSF rate, and stable-employment percentage? A property-management company in the area should have these aggregated.
- How much new apartment / multifamily construction is in the pipeline within 1–3 miles? Heavy new supply (>2% of stock underway) typically softens rents 12–24 months out; light construction supports rent growth.
Investment metrics
- 1% rule
- 2.20% ✓
- Cap rate
- 19.14%
- Cash-on-cash
- 45.88%
- DSCR
- 3.04
- GRM
- 3.8
CMA / ARV
No comps found within radius.
Projected returns pro-forma
-3.0% appreciation · 3.0% rent growth · sell at horizon
- IRR
- 43.1%
- Equity multiple
- 2.86×
- Total profit
- $59,745
- Equity at exit
- $17,132
- IRR
- 49.1%
- Equity multiple
- 5.76×
- Total profit
- $152,987
- Equity at exit
- $9,934
Cash invested: $32,172 (down + closing). Projections, not guarantees.
Landlord ↔ Tenant lean methodology
- Overall (STATE)
- 87 Strongly Landlord-Friendly
- State Texas
- 87 Strongly Landlord-Friendly · R+5
- County
- — inherits STATE
- City
- — inherits STATE
ZIP-level market 76384
- Active inventory
- 26
- Price-to-rent
- 7.6×
Monthly cashflow live
- Estimated rent
- $2,525 medium interval (Pro) →
- Mortgage (P&I)
- −$603
- Tax from tax record
- −$114 /mo · $1,371/yr
- Insurance
- −$48
- HOA
- −$0
- Vacancy / Maint / Mgmt
- −$530
- Net cashflow
- $1,230
Break-even live
2-unit breakdown (identical units grouped — click to expand)
| Units | Beds | Baths | Est. rent |
|---|---|---|---|
| 2× units | 2 | 2 | $2,524 |
| #1 | 2 | 2 | $1,262 |
| #2 | 2 | 2 | $1,262 |
| Total (2 units) | $2,525 | ||
UW: 25.0% down · 7.5% · 30yr · 1.5% tax · 5.0% vac · 8.0% maint · 8.0% mgmt
Financing live
Cash to close
- Down payment
- $28,725
- Closing costs
- $3,447
- Reserves months
- —
- Total cash needed
- —
Loan-product check · same deal, 3 products live
Conventional
25% down · 7.5% · 30yr
- Down + closing
- —
- Monthly P&I
- —
- Monthly cashflow
- —
- DSCR
- —
- Eligible?
- —
Personal DTI + credit; lowest rate.
DSCR
20% down · 8.5% · 30yr
- Down + closing
- —
- Monthly P&I
- —
- Monthly cashflow
- —
- DSCR
- —
- Eligible?
- —
No personal income docs; deal must DSCR.
Hard money
10% down · 12.0% · 12mo
- Down + closing
- —
- Monthly P&I
- —
- Monthly cashflow
- —
- DSCR
- —
- Eligible?
- —
Short-term bridge; refi at stabilization.
Listing history 22 events
-
2026-06-18days on market $114,900 Active 104 DOM
-
2026-06-17days on market $114,900 Active 103 DOM
-
2026-06-16days on market $114,900 Active 102 DOM
-
2026-06-15days on market $114,900 Active 101 DOM
-
2026-06-13days on market $114,900 Active 99 DOM
-
2026-06-12days on market $114,900 Active 98 DOM
-
2026-06-09days on market $114,900 Active 95 DOM
-
2026-06-08days on market $114,900 Active 94 DOM
-
2026-06-08days on market $114,900 Active 93 DOM
-
2026-06-07days on market $114,900 Active 92 DOM
-
2026-06-03days on market $114,900 Active 89 DOM
-
2026-06-02days on market $114,900 Active 88 DOM
-
2026-06-01days on market $114,900 Active 87 DOM
-
2026-05-31days on market $114,900 Active 86 DOM
-
2026-03-06$114,900 Active 675-char remark
Show marketing remark (675 chars)
Cash-flowing duplex investment opportunity in Coleman, Texas, located just 45 minutes from Abilene. This income-producing property is currently leased and offers immediate rental income for investors looking to expand their portfolio. The property has been renovated in the past and provides functional layouts with reliable tenancy already in place. Situated in a quiet area with small-town charm, this duplex is a solid addition for both new and seasoned investors seeking steady cash flow. The property can be purchased individually or as part of a larger investment package that includes additional multifamily opportunities at 516 and 518 S Nueces and 502 Cottonwood.
-
2024-01-24historical $475
-
2023-12-14price $475
-
2023-10-04price $495
-
2023-09-20$595
-
2019-11-05soldstatus $251,764
-
2015-10-29historical
-
2015-05-05$39,950 Active
ⓘ Source: listings_history table (triggers on properties + properties_extension) + one-shot
backfill from property_details.listing_events for pre-trigger history.
Tax reassessment forecast TX · Resets to sale price
- Current annual tax
- $1,371 · $114/mo
- Projected year-2 tax
- $2,103 · $175/mo
- Expected delta
- +$732/yr (+$61/mo · 53.4%)
ⓘ Screening estimate from a state-policy table — verify with the county assessor before closing.
Nearby sold comps map
Loading sold comps map…
Walkable amenities ~0.75 mi
Loading nearby amenities…
Taxation est. · year 1
- Rental income
- $30,300
- − Mortgage interest
- −$6,436
- − Property taxes
- −$1,371
- − Insurance
- −$574
- − Repairs & maintenance
- −$2,424
- − Management
- −$2,424
- − Depreciation
- −$3,343
- Taxable income
- $13,728
- Est. tax owed @ 24.0%
- −$3,295
- After-tax cash flow
- $11,466/yr
For passive investors: Depreciation is non-cash, so a rental often shows a tax loss while cash-flowing — sheltering income. Rental losses are passive: they offset passive income freely, and up to $25,000/yr can offset ordinary (W-2) income if you actively participate and your MAGI is under $100k (phasing out to $0 by $150k); unused losses carry forward. On sale, claimed depreciation is recaptured at up to 25%, and gains may owe capital-gains tax (a 1031 exchange can defer both). Figures are a year-1 estimate at your 24.0% rate — not tax advice; consult a CPA.
Schools (NCES district)
- District
- Coleman ISD
- NCES district ID
- 4814550
- Math proficiency
- 42% ▲ 3.00%
- Reading proficiency
- 39% ▲ 3.00%
- Median HH income
- $31,765
- Composite
- 33.18/100
- National rank
- #5540
- State rank
- #439 of 826 in TX
Livability — Coleman
- Score
- 68/100
- State rank
- #454
- US rank
- #9173
Category grades
Schools grade is shown separately in the Schools card above.
Census & demographics
- Census place
- Coleman, TX
- Population (ZIP)
- 12,239
Population outlook (Coleman County) Hauer SSP2
- Today (2025)
- 7,321 people
- By 2030
- 6,834 · -6.7%
- By 2040
- 5,968 · -18.5%
- By 2050
- 5,283 · -27.8%
- By 2075
- 4,205 · -42.6%
- By 2100
- 3,405 · -53.5%
Race, ethnicity, and origin ACS 2023
- Neighborhood character
- Diverse neighborhood (Simpson 0.60)
- Race & ethnicity
- White 54% Hispanic / Latino 31% Two or more races 17% Black 6% Asian 3%
- Hispanic origin (detail)
- Mexican 26%
- Common ancestry
- Italian 3% Slovak 1% Lithuanian 1%
- Foreign-born
- 5% · Canada, Philippines
- Languages at home
- 81% English-only · Spanish 17% Other Asian/Pacific 1%
Political lean MEDSL · Coleman
- 2024 margin
- Solid R (+79.0) · D 10.3% · R 89.3%
- 2008→2024 swing
- -15.1pp toward R · 2008: -64.0pp · 2024: -79.0pp
- All cycles
- 2024: R+79.0 2020: R+77.3 2016: R+76.8 2012: R+73.7 2008: R+64.0
Not yet ingested
- Civics
- —
Market trends
- HPI YoY
- ▼ -99.65%
- Current HPI
- 110.9147
- Rent YoY
- —
- Metro
- —
- State GDP YoY
- ▲ 3.95%
- F500 in state
- 110
Industry mix (Fortune 500 HQ in TX)
| Industry | F500 HQs | Revenue |
|---|---|---|
| Energy | 16 | $1,198B |
|
||
| Technology | 5 | $198B |
|
||
| Engineering / Construction | 4 | $72B |
|
||
| Energy Services | 3 | $60B |
|
||
| Utilities | 3 | $41B |
|
||
| Healthcare | 2 | $330B |
|
||
Price history
+187.6% since first listed8 events — show timeline
- 2026-03-06 Listed $114,900 NTREIS
- 2024-01-24 Rental Removed $475 NTREIS
- 2023-12-14 Price Changed $475 NTREIS
- 2023-10-04 Price Changed $495 NTREIS
- 2023-09-20 Listed for Rent $595 NTREIS
- 2019-11-05 Sold (Public Records) $251,764 Public Records
- 2015-10-29 Listing Removed — NTREIS
- 2015-05-05 Listed $39,950 NTREIS
Property tax history
+7.7%/yrLatest (2025): $1,371 · -11.7% YoY. Source: county tax records.
Cash-flow waterfall
monthlySold comps — $/sqft
last 12 mo · ≤1 miLoading sold comps…