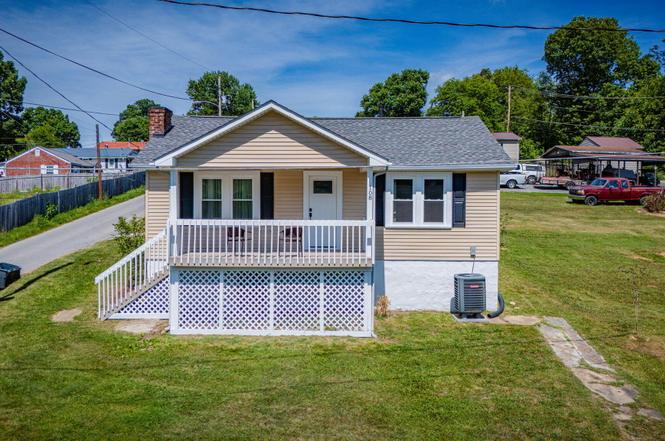
108 Independence Ave · Mount Carmel, TN
Flood risk 6/10 · Moderate
- FEMA flood zone
- X (unshaded)
- Chance of flooding over 30 yrs
- 0.69%
- Est. flood insurance / yr
- $507 – $1,088
Fire risk 4/10 · Minor
- Est. fire insurance / yr
- $949 – $1,763
Heat risk 5/10 · Moderate
- Hot days now (above 100°F)
- 8 days/yr
- Hot days in 30 yrs
- 23 days/yr
Wind risk 2/10 · Minimal
- Chance of severe wind over 30 yrs
- —
Air-quality risk 2/10 · Minimal
- Unhealthy air days now
- 0 days/yr
- Unhealthy air days in 30 yrs
- 2 days/yr
Risk factors via First Street. Map © Google.
Why this score? — see what drove the F grade
The composite is a weighted blend of 9 inputs, each scored 0–100. Each bar is that input's sub-score; the figure is the points it added to the 100-point composite (weight × sub-score).
- Cash flow +10.1/30.0
- Livability +3.2/5.0
- DSCR +2.9/10.0
- Rent growth +2.5/5.0
- Condition / age +2.5/5.0
- Schools +2.0/10.0
- 1% rule +1.8/10.0
- ARV discount +0.0/15.0
- Appreciation +0.0/10.0
$189,900
🖨 Deal sheet (PDF) 📄 Offer letter ✓ Due diligence
Listing remarks
Convenient one-level living in this renovated 2 bedroom / 1 bathroom home! Enter from the covered front porch into the living room to find a gas fireplace and an inviting layout that extends into the dining area and kitchen. The kitchen features stainless steel appliances, updated counters, tiled backsplash, and ample cabinetry. Off the main living spaces you'll find 2 bedrooms - 1 with a huge walk-in closet - and an updated full bathroom with a modern vanity and fixtures. The dedicated laundry room offers flexibility to serve as a mud room or utility space. Outside, you'll find a spacious backyard with convenient off-street parking. This home also has a stand-up crawl space that provides a
Key facts
- Covered front porch
- Huge walk-in closet
- Tiled backsplash
Tags
Property features AI
Exterior
- Parking: Gravel parking
- Utilities: Public water; Public sewer
- Home design: Single-family house; Updated/remodeled condition; Zoning: MX 2
- Construction: Vinyl siding; Shingle roof
- Exterior features: Covered front porch; Level to sloped topography
Interior
- Kitchen: Dishwasher; Electric range; Microwave; Refrigerator
- Bedrooms: Includes walk-in closet(s)
- Flooring: Carpet
- Bathrooms: 1 full bathroom
- Heating & cooling: Heat pump heating; Heat pump cooling
- Interior features: Walk-in closet(s); Fireplace in the living room; 7 total rooms
- Laundry & utility: Washer hookup; Electric dryer hookup
Neighborhood map
What this means for you Summary
Snapshot
- This is a 2-bed/1.0-bath single-family listed at $190k.
Deal economics
- At list price, monthly cash flow is $-111 ($-1k/yr) — negative.
- To cash-flow at today's rent, offer at most $170k (10.3% below list).
- To meet the 1% rule (rent ≥ 1% of price), the offer needs to be $129k (31.8% below list).
- Recommended offer: $129k (31.8% below list) — sets the bar for 1% rule.
- Cap rate 5.6% vs local median 4.2% in Mount Carmel — top-decile yield for the area; either an underpriced asset or a hidden risk that comps aren't pricing in. Stress-test before assuming the spread holds.
Location & tenants
- Location reads 65/100 on livability (#140 in TN) — a middle-class / working-renter tenant base. Strengths: cost of living A+, housing A+; Watch: crime C-, employment D+, amenities F.
- Hawkins County (rural): math 23% / reading 26% proficiency, ranked #93 of 139 in TN (top 67%) — low school quality limits family demand, transient renter base, plan for 1-2y turnover.
- Zoned schools: Mt Carmel Elementary (math 42% / reading 52%, grade D-, #139 of 952 statewide, top 16%, 272 students, 0% FRL); Church Hill Middle School (math 24% / reading 22%, grade F, #168 of 333 statewide, top 51%, 350 students, 0% FRL); Volunteer High School (math 19% / reading 37%, grade F, #101 of 332 statewide, top 30%, 1,045 students, 0% FRL) — zoned schools average 0% FRL vs 57% district-wide (57 pts lower); this property's tenant base skews higher-income than the district average.
- Market conditions: 38 active listings in the ZIP; 151 units permitted in Hawkins County in 2024 (0 in 5+ unit buildings).
Forward outlook
- Local home prices are declining (-3.0%/yr); year-one equity from $1k of loan paydown is wiped out by about $6k of value loss. Plan a longer hold.
- Hawkins County population projected at -17% by 2050 — secular population decline; favor cash flow + early exit over multi-decade hold.
Negotiation context
- Only 2 days on market — expect competitive offers; lowballing is unlikely to land.
- Current owner paid $53k; list at $190k implies a 259% gain — meaningful room to come down on a strong offer.
Risks & watch-outs
- Watch-outs: built in 1930 — expect roof / HVAC / electrical / plumbing capex.
- Climate carrying-cost: major flood risk; extreme-heat days projected 8→23/yr by 2055 (HVAC capex compounding) — expect insurance premiums to compound above CPI over the hold.
Questions for the listing agent
- What do current leases actually rent for vs. the listed asking? Can we see a recent rent roll and the last 12 months of T-12 income?
- Built in 1930 — when were the roof, HVAC, electrical panel, plumbing, and water heater last replaced?
- Is there a deadline driving the sale (1031 exchange, divorce, estate, relocation)? That informs how much negotiation room exists.
- Schools are D-rated, which usually means shorter tenancies and higher turnover. Who's the typical renter profile here, and what's been the actual vacancy rate?
- The area grade is low — what's the realistic commute time and amenity access for the typical tenant pool here? Any planned neighborhood developments (good or bad) we should know about?
- What's the average days-on-market for RENTAL listings here right now (not sales)? A rising rental-DOM trend means longer vacancies and softer asking-rent achievability than the comps imply.
- What's the recent tenant-quality profile in this submarket — average credit score on applications, eviction rate, late-payment / NSF rate, and stable-employment percentage? A property-management company in the area should have these aggregated.
- How much new for-sale + rental construction is in the pipeline within 1–3 miles? Heavy new supply typically softens prices + rents 12–24 months out; constrained supply supports both.
Investment metrics
- 1% rule
- 0.68% ✗
- Cap rate
- 5.59%
- Cash-on-cash
- -2.50%
- DSCR
- 0.89
- GRM
- 12.2
CMA / ARV
- ARV (on-the-fly)
- $155,136
- Comps found
- 8
Show comp detail 8 sales within ~0.75 mi
| Address | Dist | Beds/Ba | Sqft | Sold | Price | $/sf | Match |
|---|---|---|---|---|---|---|---|
| 329 Cypress St | 0.16mi | 2/1.0 | 726 (-6%) | 10mo | $109,000 | $150 | 75 |
| 313 Bay St | 0.05mi | 2/1.0 | 672 (-12%) | 5mo | $197,400 | $294 | 72 |
| 318 Cypress Street St | 0.09mi | 2/1.0 | 840 (+9%) | 10mo | $157,000 | $187 | 72 |
| 433 Cypress St | 0.39mi | 2/1.0 | 720 (-6%) | 4mo | $160,000 | $222 | 68 |
| 325 Kaywood Ave | 0.50mi | 2/1.0 | 768 (0%) | 10mo | $155,000 | $202 | 68 |
| 105 Jefferson Ave | 0.21mi | 2/1.0 | 705 (-8%) | 21mo | $130,000 | $184 | 59 |
| 444 Pine St | 0.54mi | 3/1.0 (+1) | 772 (+0%) | 19mo | $40,000 | $52 | 53 |
| 447 Pine St | 0.56mi | 2/1.0 | 672 (-12%) | 6mo | $160,000 | $238 | 48 |
Match score weights: distance 35% · size 25% · config 20% · recency 20%. Top-matched comps best support the ARV.
Projected returns pro-forma
-3.0% appreciation · 3.0% rent growth · sell at horizon
- IRR
- -20.5%
- Equity multiple
- 0.29×
- Total profit
- $-37,904
- Equity at exit
- $28,315
- IRR
- -13.8%
- Equity multiple
- 0.20×
- Total profit
- $-42,441
- Equity at exit
- $16,419
Cash invested: $53,172 (down + closing). Projections, not guarantees.
Landlord ↔ Tenant lean methodology
- Overall (STATE)
- 87 Strongly Landlord-Friendly
- State Tennessee
- 87 Strongly Landlord-Friendly · R+13
- County
- — inherits STATE
- City
- — inherits STATE
ZIP-level market 37645
- Home prices YoY
- -7.3%
- Active inventory
- 38
- Price-to-rent
- 12.2×
Monthly cashflow live
- Estimated rent
- $1,295 medium interval (Pro) →
- Mortgage (P&I)
- −$996
- Tax from tax record
- −$58 /mo · $699/yr
- Insurance
- −$79
- HOA
- −$0
- Vacancy / Maint / Mgmt
- −$272
- Net cashflow
- $-111
Break-even live
Sensitivity live
| Price | -10% $-3 | -5% $-57 | +0% $-111 | +5% $-164 | +10% $-218 |
|---|---|---|---|---|---|
| Rent | -10% $-213 | -5% $-162 | +0% $-111 | +5% $-59 | +10% $-8 |
| Rate | -1.0pp $-15 | -0.5pp $-62 | base $-111 | +0.5pp $-160 | +1.0pp $-210 |
UW: 25.0% down · 7.5% · 30yr · 1.5% tax · 5.0% vac · 8.0% maint · 8.0% mgmt
Financing live
Cash to close
- Down payment
- $47,475
- Closing costs
- $5,697
- Reserves months
- —
- Total cash needed
- —
Loan-product check · same deal, 3 products live
Conventional
25% down · 7.5% · 30yr
- Down + closing
- —
- Monthly P&I
- —
- Monthly cashflow
- —
- DSCR
- —
- Eligible?
- —
Personal DTI + credit; lowest rate.
DSCR
20% down · 8.5% · 30yr
- Down + closing
- —
- Monthly P&I
- —
- Monthly cashflow
- —
- DSCR
- —
- Eligible?
- —
No personal income docs; deal must DSCR.
Hard money
10% down · 12.0% · 12mo
- Down + closing
- —
- Monthly P&I
- —
- Monthly cashflow
- —
- DSCR
- —
- Eligible?
- —
Short-term bridge; refi at stabilization.
Listing history 3 events
-
2026-06-21days on market $189,900 Active 2 DOM
-
2026-06-19remarks 699-char remark
-
2026-06-19$189,900 Active 1 DOM
ⓘ Source: listings_history table (triggers on properties + properties_extension) + one-shot
backfill from property_details.listing_events for pre-trigger history.
Tax reassessment forecast TN · Resets to sale price
- Current annual tax
- $699 · $58/mo
- Projected year-2 tax
- $1,348 · $112/mo
- Expected delta
- +$649/yr (+$54/mo · 92.9%)
ⓘ Screening estimate from a state-policy table — verify with the county assessor before closing.
Climate risk First Street
- Flood 6/10 Major FEMA zone X (unshaded) · 69% chance over 30 yrs
- Wildfire 4/10 Moderate
- Heat 5/10 Major 8 d/yr ≥100°F today · 23 d/yr by 30 yrs out
- Wind 2/10 Low
- Air quality 2/10 Low 0 unhealthy d/yr today · 2 by 30 yrs out
Nearby sold comps map
Loading sold comps map…
Walkable amenities ~0.75 mi
Loading nearby amenities…
Taxation est. · year 1
- Rental income
- $15,534
- − Mortgage interest
- −$10,637
- − Property taxes
- −$699
- − Insurance
- −$950
- − Repairs & maintenance
- −$1,243
- − Management
- −$1,243
- − Depreciation
- −$5,524
- Taxable loss
- −$4,761
- Est. tax savings @ 24.0%
- +$1,143
- After-tax cash flow
- $-184/yr
For passive investors: Depreciation is non-cash, so a rental often shows a tax loss while cash-flowing — sheltering income. Rental losses are passive: they offset passive income freely, and up to $25,000/yr can offset ordinary (W-2) income if you actively participate and your MAGI is under $100k (phasing out to $0 by $150k); unused losses carry forward. On sale, claimed depreciation is recaptured at up to 25%, and gains may owe capital-gains tax (a 1031 exchange can defer both). Figures are a year-1 estimate at your 24.0% rate — not tax advice; consult a CPA.
Schools (NCES district)
- District
- Hawkins County
- NCES district ID
- 4701740
- Math proficiency
- 23% ▼ -9.00%
- Reading proficiency
- 26% ▼ -6.00%
- Median HH income
- $37,555
- Composite
- 20.45/100
- National rank
- #8581
- State rank
- #93 of 139 in TN
Livability — Mount Carmel
- Score
- 65/100
- State rank
- #140
- US rank
- #12696
Category grades
Schools grade is shown separately in the Schools card above.
Census & demographics
- Census place
- Mount Carmel, TN
- City population
- 5,504
- Population (ZIP)
- 5,504
Population outlook (Hawkins County) Hauer SSP2
- Today (2025)
- 55,226 people
- By 2030
- 53,784 · -2.6%
- By 2040
- 50,015 · -9.4%
- By 2050
- 45,682 · -17.3%
- By 2075
- 36,211 · -34.4%
- By 2100
- 26,536 · -52.0%
Race, ethnicity, and origin ACS 2023
- Neighborhood character
- Predominantly White (97%)
- Race & ethnicity
- White 97% Two or more races 2%
- Common ancestry
- Serbian 4% Slovak 2% Iranian 1%
- Foreign-born
- 0%
Political lean MEDSL · Hawkins
- 2024 margin
- Solid R (+68.8) · D 15.2% · R 84.0%
- 2008→2024 swing
- -26.9pp toward R · 2008: -42.0pp · 2024: -68.8pp
- All cycles
- 2024: R+68.8 2020: R+65.8 2016: R+63.4 2012: R+47.0 2008: R+42.0
Not yet ingested
- Civics
- —
Market trends
- HPI YoY
- ▼ -26.04%
- Current HPI
- 329.6095
- Rent YoY
- —
- Metro
- —
- State GDP YoY
- ▲ 2.78%
- F500 in state
- 22
Industry mix (Fortune 500 HQ in TN)
| Industry | F500 HQs | Revenue |
|---|---|---|
| Healthcare | 3 | $91B |
|
||
| Retail | 3 | $72B |
|
||
| Transportation / Logistics | 1 | $88B |
|
||
| Paper / Packaging | 1 | $19B |
|
||
| Insurance | 1 | $13B |
|
||
| Energy | 1 | $12B |
|
||
Price history
+1050.9% since first listed4 events — show timeline
- 2026-06-19 Listed $189,900 TVRMLS
- 2002-11-12 Sold (Public Records) $52,900 Public Records
- 2001-11-28 Sold (Public Records) $41,300 Public Records
- 2000-04-18 Sold (Public Records) $16,500 Public Records
Property tax history
+1.6%/yrLatest (2025): $699 · +0.0% YoY. Source: county tax records.
Cash-flow waterfall
monthlySold comps — $/sqft
last 12 mo · ≤1 miLoading sold comps…