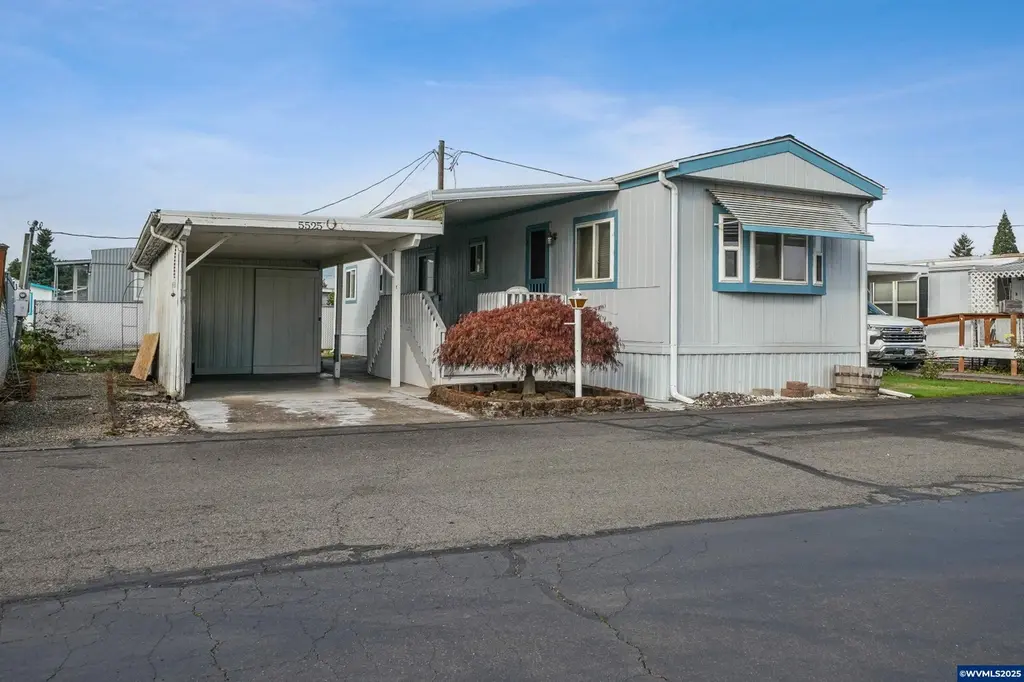
5525 43rd Way NE · Salem, OR
Flood risk 1/10 · Minimal
- FEMA flood zone
- X (unshaded)
- Chance of flooding over 30 yrs
- 0.0%
- Est. flood insurance / yr
- $507 – $1,088
Fire risk 3/10 · Minor
- Est. fire insurance / yr
- $498 – $926
Heat risk 3/10 · Minor
- Hot days now (above 92°F)
- 7 days/yr
- Hot days in 30 yrs
- 14 days/yr
Wind risk 1/10 · Minimal
- Chance of severe wind over 30 yrs
- —
Air-quality risk 10/10 · Severe
- Unhealthy air days now
- 13 days/yr
- Unhealthy air days in 30 yrs
- 14 days/yr
Risk factors via First Street. Map © Google.
Why this score? — see what drove the C- grade
The composite is a weighted blend of 9 inputs, each scored 0–100. Each bar is that input's sub-score; the figure is the points it added to the 100-point composite (weight × sub-score).
- Cash flow +15.0/30.0
- ARV discount +15.0/15.0
- 1% rule +5.0/10.0
- DSCR +5.0/10.0
- Livability +4.0/5.0
- Schools +3.7/10.0
- Rent growth +2.5/5.0
- Condition / age +2.5/5.0
- Appreciation +0.0/10.0
$34,000
🖨 Deal sheet 📄 Offer letter ✓ Due diligence
Listing remarks MLS
COME SEE IT AGAIN-- new flooring & paint! A cozy single-level home located in a quiet & quaint 55+ park near shopping & restaurants, with easy freeway access yet rural adjacent. Tidy yard, covered deck & patio, long driveway, covered carport, plus 3 storage sheds. Comfortable floorplan includes open kitchen with a bar, a newer walk-in shower for accessibility, natural gas range, and AC with the heat pump. Don't miss it! Park rent is just $975 and includes community well water. Nice ramp to the front door.
Key facts
- Covered deck
- Covered carport
- Three storage sheds
Tags
Neighborhood map
What this means for you Summary
Snapshot
- This is a 2-bed/1.0-bath manufactured listed at $34k.
Deal economics
- At list price, monthly cash flow is $1k ($12k/yr) — positive.
- The deal already cash-flows at list — no discount required.
- Meets the 1% rule at list price ($2k rent vs $34k).
- Recommended offer: $30k (12.0% below list) — sets the bar for market timing.
- Cap rate 42.4% vs local median 2.9% in Salem — top-decile yield for the area; either an underpriced asset or a hidden risk that comps aren't pricing in. Stress-test before assuming the spread holds.
Location & tenants
- Location reads 79/100 on livability (#59 in OR, #2,084 nationally) — a middle-class / working-renter tenant base. Strengths: amenities A+, commute A+, housing A+; Watch: schools D, crime F.
- Salem-Keizer SD 24J (urban): math 34% / reading 47% proficiency, ranked #103 of 183 in OR (top 56%) — families likely to look elsewhere, expect single-tenant / working-renter base with shorter leases.
- Market conditions: 175 active listings in the ZIP; 6 comparable units currently listed for rent nearby; rentals at typical pace (median 14d on market — plan ~3-4 weeks tenant-placement turnaround); 1,591 units permitted in Marion County in 2024 (716 in 5+ unit buildings).
Forward outlook
- Local home prices are declining (-3.0%/yr); year-one equity from $235 of loan paydown is wiped out by about $1k of value loss. Plan a longer hold.
- Marion County population projected at +17% by 2050 — long-run rental-demand tailwind backs the buy-and-hold thesis.
- At projected returns (-3.0% appreciation + 3.0% rent growth), your $10k cash investment doubles in ~1 year — after that, you're playing with house money.
Negotiation context
- It's been on market 237 days — a 12% lower offer ($30k) is reasonable based on typical stale-listing flexibility.
Questions for the listing agent
- It's been on market 237 days. Have you received any prior offers? Is the seller open to a 12% concession, seller financing, or rate buy-down credit?
- Why hasn't it sold? Are there any deal-killer items the seller is aware of (foundation, flood, title, zoning, code violations)?
- Is there a deadline driving the sale (1031 exchange, divorce, estate, relocation)? That informs how much negotiation room exists.
- Schools are D-rated, which usually means shorter tenancies and higher turnover. Who's the typical renter profile here, and what's been the actual vacancy rate?
- Crime grade is F in this area — have there been break-ins, vandalism, or insurance claims at this property in the last 3 years? What carrier currently insures it and at what premium?
- What's the average days-on-market for RENTAL listings here right now (not sales)? A rising rental-DOM trend means longer vacancies and softer asking-rent achievability than the comps imply.
- What's the recent tenant-quality profile in this submarket — average credit score on applications, eviction rate, late-payment / NSF rate, and stable-employment percentage? A property-management company in the area should have these aggregated.
- How much new for-sale + rental construction is in the pipeline within 1–3 miles? Heavy new supply typically softens prices + rents 12–24 months out; constrained supply supports both.
Investment metrics
- 1% rule
- 4.72% ✓
- Cap rate
- 42.39%
- Cash-on-cash
- 128.93%
- DSCR
- 6.74
- GRM
- 1.8
CMA / ARV
- ARV (median comp)
- $56,955
- List price
- $34,000
- Delta
- -40.30%
- Verdict
- UNDERPRICED
- Comps
- 11 within 1.0 mi
Show comp detail 10 sales within ~0.75 mi
| Address | Dist | Beds/Ba | Sqft | Sold | Price | $/sf | Match |
|---|---|---|---|---|---|---|---|
| 5422 Portland Rd NE #19 | 0.09mi | 2/2.0 | 828 (-1%) | 17mo | $22,500 | $27 | 75 |
| 5512 43rd Ave NE | 0.05mi | 2/1.0 | 784 (-7%) | 22mo | $26,000 | $33 | 68 |
| 5422 Portland Rd NE #68 | 0.09mi | 2/1.0 | 924 (+10%) | 15mo | $36,000 | $39 | 67 |
| 5552 Portland Rd NE #10 | 0.02mi | 2/2.0 | 924 (+10%) | 15mo | $42,500 | $46 | 66 |
| 4228 Lemon St NE #57 | 0.11mi | 2/1.0 | 960 (+14%) | 8mo | $49,000 | $51 | 64 |
| 5422 Portland Rd NE #72 | 0.09mi | 2/1.0 | 924 (+10%) | 21mo | $40,900 | $44 | 61 |
| 5131 NE Copper Crk #67 | 0.25mi | 3/2.0 (+1) | 924 (+10%) | 6mo | $65,000 | $70 | 57 |
| 5593 43rd Pl NE | 0.02mi | 2/2.0 | 960 (+14%) | 17mo | $80,000 | $83 | 57 |
| 4882 Lancaster Dr NE #71 | 0.63mi | 2/1.0 | 784 (-7%) | 13mo | $30,000 | $38 | 48 |
| 4882 Lancaster Dr NE Unit 145B | 0.57mi | 2/2.0 | 924 (+10%) | 9mo | $53,000 | $57 | 46 |
Match score weights: distance 35% · size 25% · config 20% · recency 20%. Top-matched comps best support the ARV.
Projected returns pro-forma
-3.0% appreciation · 3.0% rent growth · sell at horizon
- IRR
- —
- Equity multiple
- 7.27×
- Total profit
- $59,668
- Equity at exit
- $5,070
- IRR
- —
- Equity multiple
- 15.28×
- Total profit
- $135,970
- Equity at exit
- $2,940
Cash invested: $9,520 (down + closing). Projections, not guarantees.
Landlord ↔ Tenant lean methodology
- Overall (STATE)
- 28 Tenant-Leaning
- State Oregon
- 28 Tenant-Leaning · D+6
- County
- — inherits STATE
- City
- — inherits STATE
ZIP-level market 97305
- Active inventory
- 175
- Price-to-rent
- 1.8×
Monthly cashflow live
- Estimated rent
- $1,606 high interval (Pro) →
- Mortgage (P&I)
- −$178
- Tax from tax record
- −$54 /mo · $642/yr
- Insurance
- −$14
- HOA
- −$0
- Vacancy / Maint / Mgmt
- −$337
- Net cashflow
- $1,023
Break-even live
UW: 25.0% down · 7.5% · 30yr · 1.5% tax · 5.0% vac · 8.0% maint · 8.0% mgmt
Financing live
Cash to close
- Down payment
- $8,500
- Closing costs
- $1,020
- Reserves months
- —
- Total cash needed
- —
Loan-product check · same deal, 3 products live
Conventional
25% down · 7.5% · 30yr
- Down + closing
- —
- Monthly P&I
- —
- Monthly cashflow
- —
- DSCR
- —
- Eligible?
- —
Personal DTI + credit; lowest rate.
DSCR
20% down · 8.5% · 30yr
- Down + closing
- —
- Monthly P&I
- —
- Monthly cashflow
- —
- DSCR
- —
- Eligible?
- —
No personal income docs; deal must DSCR.
Hard money
10% down · 12.0% · 12mo
- Down + closing
- —
- Monthly P&I
- —
- Monthly cashflow
- —
- DSCR
- —
- Eligible?
- —
Short-term bridge; refi at stabilization.
Rent comps 6 comps
| Address | Beds | Baths | Sqft | Rent | $/sqft | DOM | Units | Dist |
|---|---|---|---|---|---|---|---|---|
| 5115 Countryside St NE Salem, OR | 3.0 | 1.0–2.0 | 876 | $1,958 | $2.23 | 14d | 20 | 0.40mi |
| 4828 Lancaster Dr NE Salem, OR | 2.0 | 1.0 | 832 | $1,435 | $1.72 | 14d | 5 | 0.79mi |
| 4040 Hayesville Dr NE Salem, OR | 1.0–3.0 | 1.0–2.0 | 927 | $1,695 | $1.83 | 14d | 25 | 0.98mi |
| 4624 Lancaster Dr NE Salem, OR | 2.0–3.0 | 2.0–2.5 | 963 | $1,495 | $1.55 | 14d | 10 | 1.11mi |
| 4553 Lancaster Dr NE Unit 4553-B Salem, OR | 1.0 | 1.0 | 575 | $995 | $1.73 | 44d | 1 | 1.20mi |
| 4007 Iberis St NE Unit 4007 Salem, OR | 2.0 | 1.0 | 850 | $1,195 | $1.41 | 44d | 1 | 1.48mi |
Listing history 18 events
-
2026-06-18days on market $34,000 Active 237 DOM
-
2026-06-17days on market $34,000 Active 236 DOM
-
2026-06-16days on market $34,000 Active 235 DOM
-
2026-06-15days on market $34,000 Active 234 DOM
-
2026-06-14days on market $34,000 Active 232 DOM
-
2026-06-10days on market $34,000 Active 229 DOM
-
2026-06-09days on market $34,000 Active 228 DOM
-
2026-06-08days on market $34,000 Active 227 DOM
-
2026-06-07statusdays on market $34,000 Active 226 DOM
-
2026-06-03days on market $34,000 Active under Contract 222 DOM
-
2026-06-02days on market $34,000 Active under Contract 221 DOM
-
2026-06-01days on market $34,000 Active under Contract 220 DOM
-
2026-05-31days on market $34,000 Active under Contract 219 DOM
-
2026-05-30remarks 553-char remark
-
2026-05-30statusdays on market $34,000 Active under Contract 218 DOM
-
2026-02-17price $34,000 526-char remark
Show marketing remark (526 chars)
COME SEE IT AGAIN-- new flooring & paint! A cozy single-level home located in a quiet & quaint 55+ park near shopping & restaurants, with easy freeway access yet rural adjacent. Tidy yard, covered deck & patio, long driveway, covered carport, plus 3 storage sheds. Comfortable floorplan includes open kitchen with a bar, a newer walk-in shower for accessibility, natural gas range, and AC with the heat pump. Don't miss it! Park rent is just $975 and includes community well water. Nice ramp to the front door.
-
2025-12-15price $37,000 526-char remark
Show marketing remark (526 chars)
COME SEE IT AGAIN-- new flooring & paint! A cozy single-level home located in a quiet & quaint 55+ park near shopping & restaurants, with easy freeway access yet rural adjacent. Tidy yard, covered deck & patio, long driveway, covered carport, plus 3 storage sheds. Comfortable floorplan includes open kitchen with a bar, a newer walk-in shower for accessibility, natural gas range, and AC with the heat pump. Don't miss it! Park rent is just $975 and includes community well water. Nice ramp to the front door.
-
2025-10-23$40,000 Active 526-char remark
Show marketing remark (526 chars)
COME SEE IT AGAIN-- new flooring & paint! A cozy single-level home located in a quiet & quaint 55+ park near shopping & restaurants, with easy freeway access yet rural adjacent. Tidy yard, covered deck & patio, long driveway, covered carport, plus 3 storage sheds. Comfortable floorplan includes open kitchen with a bar, a newer walk-in shower for accessibility, natural gas range, and AC with the heat pump. Don't miss it! Park rent is just $975 and includes community well water. Nice ramp to the front door.
ⓘ Source: listings_history table (triggers on properties + properties_extension) + one-shot
backfill from property_details.listing_events for pre-trigger history.
Tax reassessment forecast OR · Resets to sale price
- Current annual tax
- $642 · $54/mo
- Projected year-2 tax
- $642 · $54/mo
- Expected delta
- $0/yr ($0/mo · 0.0%)
ⓘ Screening estimate from a state-policy table — verify with the county assessor before closing.
Climate risk First Street
- Flood 1/10 Low FEMA zone X (unshaded) · 0% chance over 30 yrs
- Wildfire 3/10 Moderate
- Heat 3/10 Moderate 7 d/yr ≥92°F today · 14 d/yr by 30 yrs out
- Wind 1/10 Low
- Air quality 10/10 Extreme 13 unhealthy d/yr today · 14 by 30 yrs out
Nearby sold comps map
Loading sold comps map…
Walkable amenities ~0.75 mi
Loading nearby amenities…
Taxation est. · year 1
- Rental income
- $19,274
- − Mortgage interest
- −$1,905
- − Property taxes
- −$642
- − Insurance
- −$170
- − Repairs & maintenance
- −$1,542
- − Management
- −$1,542
- − Depreciation
- −$989
- Taxable income
- $12,484
- Est. tax owed @ 24.0%
- −$2,996
- After-tax cash flow
- $9,278/yr
For passive investors: Depreciation is non-cash, so a rental often shows a tax loss while cash-flowing — sheltering income. Rental losses are passive: they offset passive income freely, and up to $25,000/yr can offset ordinary (W-2) income if you actively participate and your MAGI is under $100k (phasing out to $0 by $150k); unused losses carry forward. On sale, claimed depreciation is recaptured at up to 25%, and gains may owe capital-gains tax (a 1031 exchange can defer both). Figures are a year-1 estimate at your 24.0% rate — not tax advice; consult a CPA.
Schools (NCES district)
- District
- Salem-Keizer SD 24J
- NCES district ID
- 4110820
- Math proficiency
- 34% ▼ -1.00%
- Reading proficiency
- 47% ▼ -2.00%
- Median HH income
- $48,632
- Composite
- 37.16/100
- National rank
- #9017
- State rank
- #103 of 183 in OR
Livability — Salem
- Score
- 79/100
- State rank
- #59
- US rank
- #2084
Category grades
Schools grade is shown separately in the Schools card above.
Census & demographics
- Census place
- Salem, OR
- City population
- 193,601
- Population (ZIP)
- 45,044
Population outlook (Marion County) Hauer SSP2
- Today (2025)
- 360,940 people
- By 2030
- 375,178 · +3.9%
- By 2040
- 400,914 · +11.1%
- By 2050
- 422,187 · +17.0%
- By 2075
- 460,305 · +27.5%
- By 2100
- 464,025 · +28.6%
Race, ethnicity, and origin ACS 2023
- Neighborhood character
- Diverse neighborhood (Simpson 0.61)
- Race & ethnicity
- Hispanic / Latino 44% White 44% Two or more races 16% Asian 3% Pacific Islander 3% Native American 3% Black 1%
- Hispanic origin (detail)
- Mexican 41%
- Common ancestry
- Italian 2% Slovak 2% Scotch-Irish 2%
- Foreign-born
- 23% · Canada, China
- Languages at home
- 57% English-only · Spanish 35% Other Asian/Pacific 3% Russian/Polish/Slavic 2%
Political lean MEDSL · Marion
- 2024 margin
- Toss-up / Even · D 47.5% · R 49.5% · Other 3.0%
- 2008→2024 swing
- -4.2pp toward R · 2008: 2.2pp · 2024: -2.0pp
- All cycles
- 2024: R+2.0 2020: D+1.1 2016: R+5.0 2012: R+3.5 2008: D+2.2
Not yet ingested
- Civics
- —
Market trends
- HPI YoY
- ▼ -328.50%
- Current HPI
- 296.3428
- Rent YoY
- —
- Metro
- —
- State GDP YoY
- ▲ 2.05%
- F500 in state
- 2
Industry mix (Fortune 500 HQ in OR)
| Industry | F500 HQs | Revenue |
|---|---|---|
| Consumer Goods | 1 | $51B |
|
||
Price history
-15.0% since first listed3 events — show timeline
- 2026-02-17 Price Changed $34,000 WVMLS
- 2025-12-15 Price Changed $37,000 WVMLS
- 2025-10-23 Listed $40,000 WVMLS
Property tax history
+5.1%/yrLatest (2025): $642 · +7.6% YoY. Source: county tax records.
Cash-flow waterfall
monthlySold comps — $/sqft
last 12 mo · ≤1 miLoading sold comps…